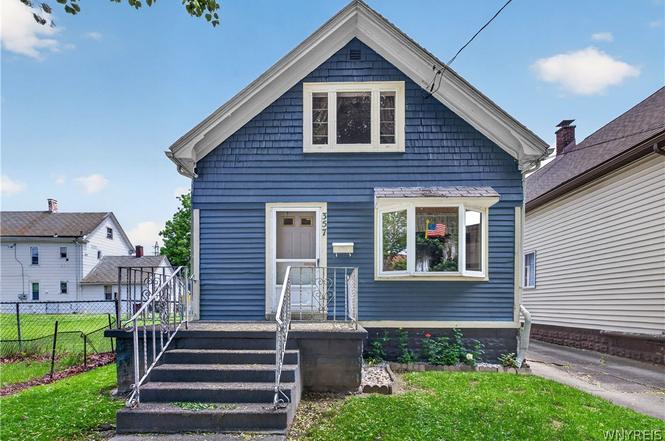
357 Gold St · Buffalo, NY
Flood risk 1/10 · Minimal
- FEMA flood zone
- X (unshaded)
- Chance of flooding over 30 yrs
- 0.0%
- Est. flood insurance / yr
- $473 – $860
Fire risk 1/10 · Minimal
- Est. fire insurance / yr
- $691 – $1,283
Heat risk 3/10 · Minor
- Hot days now (above 92°F)
- 7 days/yr
- Hot days in 30 yrs
- 15 days/yr
Wind risk 1/10 · Minimal
- Chance of severe wind over 30 yrs
- —
Air-quality risk 3/10 · Minor
- Unhealthy air days now
- 2 days/yr
- Unhealthy air days in 30 yrs
- 3 days/yr
Risk factors via First Street. Map © Google.
Why this score? — see what drove the B+ grade
The composite is a weighted blend of 9 inputs, each scored 0–100. Each bar is that input's sub-score; the figure is the points it added to the 100-point composite (weight × sub-score).
- Cash flow +30.0/30.0
- 1% rule +10.0/10.0
- DSCR +10.0/10.0
- Appreciation +9.0/10.0
- ARV discount +7.5/15.0
- Livability +3.9/5.0
- Schools +3.3/10.0
- Rent growth +2.5/5.0
- Condition / age +2.5/5.0
$59,999
🖨 Deal sheet (PDF) 📄 Offer letter ✓ Due diligence
Listing remarks
Seller will consider offers between $59,999 and $99,999. Attention all investors, this is the opportunity you've been searching for. This 2 Bedroom home in the transforming Lovejoy area is the perfect house for that next investment. With similar houses selling for over $150,000, this one is screaming with potential. Making this one even more appealing is the portion of the attic that's ready to be finished and turned into another room. Some of the prime features of this property are the huge driveway, florida room, and well maintained yard. With a little love, this one could be the deal of the year or the best investment you've made in while. Low taxes and a great price make this one somet
Key facts
- Well maintained yard
- Huge driveway
- Florida room
Tags
Property features AI
Exterior
- Parking: Detached 2-car garage
- Utilities: Public water connected; Sewer connected
- Home design: Single-story home; Existing construction
- Construction: Wood siding; Block foundation
- Exterior features: Concrete driveway; Near public transit; Rectangular residential lot; City street frontage
Interior
- Kitchen: Appliances negotiable
- Bedrooms: 2 bedrooms on the main level
- Flooring: Carpet; Laminate; Varied flooring
- Bathrooms: 1 full bathroom on the main level
- Heating & cooling: Gas heating; Baseboard heat
- Interior features: Eat-in kitchen; Convertible bedroom; Bedroom on main level; Other interior features (see remarks)
- Laundry & utility: Gas water heater
Neighborhood map
What this means for you Summary
Snapshot
- This is a 2-bed/1.0-bath single-family listed at $60k.
Deal economics
- At list price, monthly cash flow is $600 ($7k/yr) — positive.
- The deal already cash-flows at list — no discount required.
- Meets the 1% rule at list price ($1k rent vs $60k).
- Cap rate 18.3% vs local median 8.0% in Buffalo — top-decile yield for the area; either an underpriced asset or a hidden risk that comps aren't pricing in. Stress-test before assuming the spread holds.
Location & tenants
- Location reads 77/100 on livability (#195 in NY, #3,011 nationally) — a middle-class / working-renter tenant base. Strengths: commute A+, housing A+, health & safety A+; Watch: crime F, employment D-.
- Buffalo City School District (urban): math 41% / reading 40% proficiency, ranked #535 of 590 in NY (top 91%) — families likely to look elsewhere, expect single-tenant / working-renter base with shorter leases; 75% free/reduced lunch — lower-income household profile, screen leases tightly.
- Market conditions: 169 active listings in the ZIP; 8 comparable units currently listed for rent nearby; rentals lingering (median 45d on market — plan ~5-8 weeks vacancy on turnover, expect pricing pressure); 50% of comp listings sitting > 30 days — soft ceiling on asking rent; 1,244 units permitted in Erie County in 2024 (563 in 5+ unit buildings).
Forward outlook
- In year one you build about $5k of equity ($415 loan paydown + $5k appreciation (8.1% local appreciation)).
- At projected returns (8.1% appreciation + 3.0% rent growth), your $17k cash investment doubles in ~2 years — after that, you're playing with house money.
- By year 7, paydown + projected appreciation supports a ~$36k cash-out refi (75% LTV) — recoverable capital for the next deal without selling this one.
Negotiation context
- Only 4 days on market — expect competitive offers; lowballing is unlikely to land.
Risks & watch-outs
- Watch-outs: built in 1900 — expect roof / HVAC / electrical / plumbing capex.
Questions for the listing agent
- Built in 1900 — when were the roof, HVAC, electrical panel, plumbing, and water heater last replaced?
- Is there a deadline driving the sale (1031 exchange, divorce, estate, relocation)? That informs how much negotiation room exists.
- Crime grade is F in this area — have there been break-ins, vandalism, or insurance claims at this property in the last 3 years? What carrier currently insures it and at what premium?
- What's the average days-on-market for RENTAL listings here right now (not sales)? A rising rental-DOM trend means longer vacancies and softer asking-rent achievability than the comps imply.
- What's the recent tenant-quality profile in this submarket — average credit score on applications, eviction rate, late-payment / NSF rate, and stable-employment percentage? A property-management company in the area should have these aggregated.
- How much new for-sale + rental construction is in the pipeline within 1–3 miles? Heavy new supply typically softens prices + rents 12–24 months out; constrained supply supports both.
Investment metrics
- 1% rule
- 2.05% ✓
- Cap rate
- 18.30%
- Cash-on-cash
- 42.88%
- DSCR
- 2.91
- GRM
- 4.1
CMA / ARV
- ARV (on-the-fly)
- $170,560
- Comps found
- 12
Show comp detail 12 sales within ~0.75 mi
| Address | Dist | Beds/Ba | Sqft | Sold | Price | $/sf | Match |
|---|---|---|---|---|---|---|---|
| 379 N Ogden St Unit E | 0.15mi | 3/1.0 (+1) | 1,083 (+2%) | 3mo | $160,000 | $148 | 82 |
| 74 Vanderbilt St | 0.17mi | 3/1.0 (+1) | 1,136 (+7%) | 3mo | $105,000 | $92 | 74 |
| 317 Atlantic Ave | 0.39mi | 3/1.0 (+1) | 1,095 (+3%) | 3mo | $174,900 | $160 | 70 |
| 391 Greene St | 0.25mi | 3/1.0 (+1) | 1,144 (+7%) | 2mo | $200,000 | $175 | 70 |
| 105 Regent St | 0.37mi | 3/2.0 (+1) | 1,138 (+7%) | 6mo | $110,000 | $97 | 58 |
| 109 Currier Ave | 0.74mi | 3/1.0 (+1) | 1,088 (+2%) | 8mo | $200,000 | $184 | 50 |
| 215 Curtiss St | 0.62mi | 3/1.0 (+1) | 1,160 (+9%) | 7mo | $240,000 | $207 | 45 |
| 128 Gatchell St | 0.67mi | 2/1.0 | 926 (-13%) | 2mo | $82,500 | $89 | 45 |
| 131 Hirschbeck St | 0.73mi | 3/1.0 (+1) | 993 (-7%) | 9mo | $111,550 | $112 | 42 |
| 269 Michael Ave | 0.53mi | 3/1.5 (+1) | 940 (-12%) | 9mo | $165,000 | $176 | 41 |
| 67 Gold St | 0.55mi | 3/2.0 (+1) | 1,183 (+11%) | 8mo | $103,500 | $87 | 40 |
| 232 Boll St | 0.71mi | 3/1.0 (+1) | 1,224 (+15%) | 1mo | $240,000 | $196 | 36 |
Match score weights: distance 35% · size 25% · config 20% · recency 20%. Top-matched comps best support the ARV.
Projected returns pro-forma
8.06% appreciation · 3.0% rent growth · sell at horizon
- IRR
- 55.1%
- Equity multiple
- 4.76×
- Total profit
- $63,168
- Equity at exit
- $45,821
- IRR
- 50.1%
- Equity multiple
- 10.22×
- Total profit
- $154,858
- Equity at exit
- $91,183
Cash invested: $16,800 (down + closing). Projections, not guarantees.
Landlord ↔ Tenant lean methodology
- Overall (STATE)
- 15 Strongly Tenant-Friendly
- State New York
- 15 Strongly Tenant-Friendly · D+10
- County
- — inherits STATE
- City
- — inherits STATE
ZIP-level market 14206
- Home prices YoY
- 1.8%
- Active inventory
- 169
- Price-to-rent
- 4.1×
Monthly cashflow live
- Estimated rent
- $1,230 high interval (Pro) →
- Mortgage (P&I)
- −$315
- Tax from tax record
- −$31 /mo · $376/yr
- Insurance
- −$25
- HOA
- −$0
- Vacancy / Maint / Mgmt
- −$258
- Net cashflow
- $600
Break-even live
Sensitivity live
| Price | -10% $634 | -5% $617 | +0% $600 | +5% $583 | +10% $566 |
|---|---|---|---|---|---|
| Rent | -10% $503 | -5% $552 | +0% $600 | +5% $649 | +10% $697 |
| Rate | -1.0pp $631 | -0.5pp $616 | base $600 | +0.5pp $585 | +1.0pp $569 |
UW: 25.0% down · 7.5% · 30yr · 1.5% tax · 5.0% vac · 8.0% maint · 8.0% mgmt
Financing live
Cash to close
- Down payment
- $15,000
- Closing costs
- $1,800
- Reserves months
- —
- Total cash needed
- —
Loan-product check · same deal, 3 products live
Conventional
25% down · 7.5% · 30yr
- Down + closing
- —
- Monthly P&I
- —
- Monthly cashflow
- —
- DSCR
- —
- Eligible?
- —
Personal DTI + credit; lowest rate.
DSCR
20% down · 8.5% · 30yr
- Down + closing
- —
- Monthly P&I
- —
- Monthly cashflow
- —
- DSCR
- —
- Eligible?
- —
No personal income docs; deal must DSCR.
Hard money
10% down · 12.0% · 12mo
- Down + closing
- —
- Monthly P&I
- —
- Monthly cashflow
- —
- DSCR
- —
- Eligible?
- —
Short-term bridge; refi at stabilization.
Rent comps 8 comps
| Address | Beds | Baths | Sqft | Rent | $/sqft | DOM | Units | Dist |
|---|---|---|---|---|---|---|---|---|
| 1777 Broadway Unit 2 Buffalo, NY | 3.0 | 1.0 | 1300 | $1,200 | $0.92 | 44d | 1 | 0.26mi |
| 24 Euclid Ave Buffalo, NY | 3.0 | 2.0 | 1150 | $1,700 | $1.48 | 44d | 1 | 0.96mi |
| 1202 Walden Ave Unit 3 Buffalo, NY | 3.0 | 1.0 | 1500 | $1,400 | $0.93 | 18d | 1 | 1.10mi |
| 1202 Walden Ave Unit 2 Buffalo, NY | 3.0 | 1.0 | 800 | $1,350 | $1.69 | 44d | 1 | 1.10mi |
| 67 Moeller St Unit UPPER Buffalo, NY | 3.0 | 1.0 | 960 | $1,000 | $1.04 | 4d | 1 | 1.10mi |
| 67 Moeller St Unit LOWER Buffalo, NY | 3.0 | 1.0 | 960 | $1,200 | $1.25 | 24d | 1 | 1.10mi |
| 143 Reo Ave Buffalo, NY | 3.0 | 2.0 | 1143 | $1,600 | $1.40 | 12d | 1 | 1.42mi |
| 56 Hagen St #2 Buffalo, NY | 2.0 | 1.0 | 850 | $950 | $1.12 | 44d | 1 | 1.50mi |
Listing history 5 events
-
2026-06-18days on market $59,999 Active 4 DOM
-
2026-06-17days on market $59,999 Active 3 DOM
-
2026-06-16days on market $59,999 Active 2 DOM
-
2026-06-15remarks 699-char remark
-
2026-06-15$59,999 Active 1 DOM
ⓘ Source: listings_history table (triggers on properties + properties_extension) + one-shot
backfill from property_details.listing_events for pre-trigger history.
Tax reassessment forecast NY · Partial reset (capped growth)
- Current annual tax
- $376 · $31/mo
- Projected year-2 tax
- $695 · $58/mo
- Expected delta
- +$319/yr (+$27/mo · 84.7%)
ⓘ Screening estimate from a state-policy table — verify with the county assessor before closing.
Climate risk First Street
- Flood 1/10 Low FEMA zone X (unshaded) · 0% chance over 30 yrs
- Wildfire 1/10 Low
- Heat 3/10 Moderate 7 d/yr ≥92°F today · 15 d/yr by 30 yrs out
- Wind 1/10 Low
- Air quality 3/10 Moderate 2 unhealthy d/yr today · 3 by 30 yrs out
Nearby sold comps map
Loading sold comps map…
Walkable amenities ~0.75 mi
Loading nearby amenities…
Taxation est. · year 1
- Rental income
- $14,755
- − Mortgage interest
- −$3,361
- − Property taxes
- −$376
- − Insurance
- −$300
- − Repairs & maintenance
- −$1,180
- − Management
- −$1,180
- − Depreciation
- −$1,745
- Taxable income
- $6,611
- Est. tax owed @ 24.0%
- −$1,587
- After-tax cash flow
- $5,617/yr
For passive investors: Depreciation is non-cash, so a rental often shows a tax loss while cash-flowing — sheltering income. Rental losses are passive: they offset passive income freely, and up to $25,000/yr can offset ordinary (W-2) income if you actively participate and your MAGI is under $100k (phasing out to $0 by $150k); unused losses carry forward. On sale, claimed depreciation is recaptured at up to 25%, and gains may owe capital-gains tax (a 1031 exchange can defer both). Figures are a year-1 estimate at your 24.0% rate — not tax advice; consult a CPA.
Schools (NCES district)
- District
- Buffalo City School District
- NCES district ID
- 3605850
- Math proficiency
- 41% ▲ 11.00%
- Reading proficiency
- 40% ▲ 7.00%
- Median HH income
- $31,665
- Composite
- 33.17/100
- National rank
- #5544
- State rank
- #535 of 590 in NY
Livability — Buffalo
- Score
- 77/100
- State rank
- #195
- US rank
- #3011
Category grades
Schools grade is shown separately in the Schools card above.
Census & demographics
- Census place
- Buffalo, NY
- County
- Erie County · 714,559 people
- City population
- 440,021
- Metro
- Buffalo-Cheektowaga, NY
- Population (ZIP)
- 21,631
- Household income
- $50,450
- Rent vs Own
- Severe rent burden
- 841.0
Population outlook (Erie County) Hauer SSP2
- Today (2025)
- 933,037 people
- By 2030
- 935,181 · +0.2%
- By 2040
- 928,531 · -0.5%
- By 2050
- 905,725 · -2.9%
- By 2075
- 834,037 · -10.6%
- By 2100
- 708,033 · -24.1%
Race, ethnicity, and origin ACS 2023
- Neighborhood character
- Majority White (65%)
- Race & ethnicity
- White 65% Hispanic / Latino 13% Black 12% Two or more races 8% Asian 4%
- Hispanic origin (detail)
- Mexican 2% Puerto Rican 10%
- Common ancestry
- Romanian 25% Lithuanian 1% Italian 1%
- Foreign-born
- 6% · Canada, China
- Languages at home
- 88% English-only · Spanish 5% Other Indo-European 3% Arabic 2%
Political lean MEDSL · Erie
- 2024 margin
- Lean D (+9.7) · D 54.8% · R 45.2%
- 2008→2024 swing
- -7.9pp toward R · 2008: 17.5pp · 2024: 9.7pp
- All cycles
- 2024: D+9.7 2020: D+14.7 2016: D+4.8 2012: D+15.6 2008: D+17.5
Not yet ingested
- Civics
- —
Market trends
- HPI YoY
- ▲ 8.06%
- Current HPI
- 457.3935
- Rent YoY
- —
- Metro
- Buffalo-Cheektowaga, NY
- State GDP YoY
- ▲ 2.60%
- F500 in state
- 92
Industry mix (Fortune 500 HQ in NY)
| Industry | F500 HQs | Revenue |
|---|---|---|
| Financial Services | 10 | $950B |
|
||
| Consumer Goods | 9 | $162B |
|
||
| Insurance | 4 | $225B |
|
||
| Telecommunications | 2 | $144B |
|
||
| Pharmaceuticals | 2 | $112B |
|
||
| Media / Entertainment | 2 | $69B |
|
||
Price history
1 event — show timeline
- 2026-06-14 Listed $59,999 WNYREIS
Property tax history
+4.4%/yrLatest (2025): $376 · +29.2% YoY. Source: county tax records.
Cash-flow waterfall
monthlySold comps — $/sqft
last 12 mo · ≤1 miLoading sold comps…