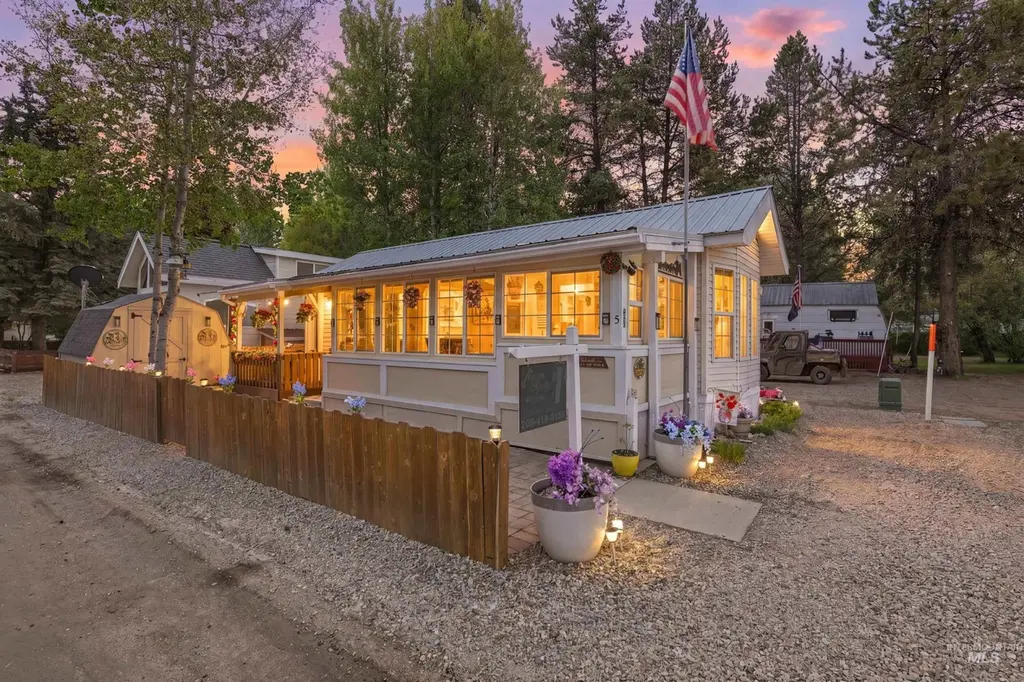
5 D St · Cascade, ID
Flood risk 7/10 · Major
- FEMA flood zone
- AE
- Chance of flooding over 30 yrs
- 0.77%
- Est. flood insurance / yr
- $1,737 – $8,500
Fire risk 8/10 · Major
- Est. fire insurance / yr
- $584 – $1,086
Heat risk 2/10 · Minimal
- Hot days now (above 89°F)
- 7 days/yr
- Hot days in 30 yrs
- 18 days/yr
Wind risk 1/10 · Minimal
- Chance of severe wind over 30 yrs
- —
Air-quality risk 7/10 · Major
- Unhealthy air days now
- 10 days/yr
- Unhealthy air days in 30 yrs
- 17 days/yr
Risk factors via First Street. Map © Google.
Why this score? — see what drove the B- grade
The composite is a weighted blend of 9 inputs, each scored 0–100. Each bar is that input's sub-score; the figure is the points it added to the 100-point composite (weight × sub-score).
- Cash flow +23.9/30.0
- ARV discount +15.0/15.0
- DSCR +7.7/10.0
- 1% rule +6.6/10.0
- Condition / age +3.8/5.0
- Schools +3.7/10.0
- Livability +3.3/5.0
- Rent growth +2.5/5.0
- Appreciation +0.0/10.0
$171,700
🖨 Deal sheet (PDF) 📄 Offer letter ✓ Due diligence
Listing remarks MLS
EXCELLENT FULLY REFURBISHED park model. New refrigerator, new combo microwave convection oven. Screened in porch. Just across the street from the seasonal pool, laundry facility, and pavilion. Leisure Time borders the Payette River and the 2.5 mile Strand with Kelly's Whitewater Park only 1/2 mile downstream.
Key facts
- 1,742 sq ft lot
- Community pool
- Built 1998
Property features AI
Finance
- Other: Residential zoning; Small lot (~5999 sq ft)
- HOA & community: Annual association fee of $660; Leisuretime R.V. Park community
Exterior
- Utilities: City water service; Sewer connected
- Home design: Single-family residence; Corner lot
- Construction: Built in 1998; Metal roof
- Exterior features: Wood fencing; Covered patio/deck; Community pool; Storage shed
Interior
- Kitchen: Microwave; Oven/Range (freestanding); Gas range; Refrigerator
- Bedrooms: 1 bedroom (master on main level)
- Bathrooms: 1 bathroom
- Heating & cooling: Forced air heating (propane); Wall/window air conditioning unit(s)
- Interior features: Master bedroom on main level
Neighborhood map
What this means for you Summary
Snapshot
- This is a 1-bed/1.0-bath single-family listed at $172k. Condition is rated good.
Deal economics
- At list price, monthly cash flow is $-93 ($-1k/yr) — negative.
- To cash-flow at today's rent, offer at most $158k (7.8% below list).
- Meets the 1% rule at list price ($2k rent vs $172k).
- Recommended offer: $158k (7.8% below list) — sets the bar for cash-flow.
- Cap rate 8.6% vs local median 3.6% in Cascade — top-decile yield for the area; either an underpriced asset or a hidden risk that comps aren't pricing in. Stress-test before assuming the spread holds.
Location & tenants
- Location reads 66/100 on livability (#116 in ID) — a middle-class / working-renter tenant base. Strengths: housing A+, cost of living A, crime A-; Watch: employment C-, amenities F, commute F.
- Cascade District (rural): math 35% / reading 45% proficiency, ranked #94 of 133 in ID (top 71%) — families likely to look elsewhere, expect single-tenant / working-renter base with shorter leases.
- Zoned schools: Cascade Elementary School (math 54% / reading 44%, grade D, #148 of 357 statewide, top 47%, 119 students, 33% FRL); Cascade Jr/Sr High School (math 54% / reading 74%, grade B-, #10 of 169 statewide, top 7%, 87 students, 15% FRL).
- Zoned-school proficiency averages 57% at this address vs 40% district-wide (+17 pts) — the actual schools serving this property are materially stronger than the Cascade District average implies; a family-tenant draw the district grade alone would hide.
- Market conditions: 410 active listings in the ZIP; 250 units permitted in Valley County in 2024 (0 in 5+ unit buildings).
Forward outlook
- Local home prices are declining (-3.0%/yr); year-one equity from $1k of loan paydown is wiped out by about $5k of value loss. Plan a longer hold.
- Valley County population projected at +7% by 2050 — modest demand growth; plan on rents tracking national, not racing it.
Negotiation context
- It's been on market 48 days — a 3% lower offer ($167k) is reasonable based on typical stale-listing flexibility.
- 4 sale attempts since 11y ago; this cycle's ask has dropped $13k (7%) from the opening price — seller is motivated, your offer sets the floor, not the list.
Risks & watch-outs
- Watch-outs: flood insurance adds $427/mo.
- Climate carrying-cost: in FEMA flood zone AE (mandatory federal flood insurance); severe wildfire risk — expect insurance premiums to compound above CPI over the hold.
Questions for the listing agent
- What do current leases actually rent for vs. the listed asking? Can we see a recent rent roll and the last 12 months of T-12 income?
- It's been on market 48 days. Have you received any prior offers? Is the seller open to a 8% concession, seller financing, or rate buy-down credit?
- What's the actual annual flood-insurance premium (NFIP or private), and is the property in a SFHA with mandatory coverage?
- What does the HOA fee cover, when was the last increase, and are there any pending special assessments or reserve-fund shortfalls?
- Is there a deadline driving the sale (1031 exchange, divorce, estate, relocation)? That informs how much negotiation room exists.
- Schools are D-rated, which usually means shorter tenancies and higher turnover. Who's the typical renter profile here, and what's been the actual vacancy rate?
- What's the average days-on-market for RENTAL listings here right now (not sales)? A rising rental-DOM trend means longer vacancies and softer asking-rent achievability than the comps imply.
- What's the recent tenant-quality profile in this submarket — average credit score on applications, eviction rate, late-payment / NSF rate, and stable-employment percentage? A property-management company in the area should have these aggregated.
- How much new for-sale + rental construction is in the pipeline within 1–3 miles? Heavy new supply typically softens prices + rents 12–24 months out; constrained supply supports both.
Investment metrics
- 1% rule
- 1.16% ✓
- Cap rate
- 8.62%
- Cash-on-cash
- 8.33%
- DSCR
- 1.37
- GRM
- 7.2
CMA / ARV
- ARV (on-the-fly)
- $206,948
- Comps found
- 1
Show comp detail 1 sale within ~0.75 mi
| Address | Dist | Beds/Ba | Sqft | Sold | Price | $/sf | Match |
|---|---|---|---|---|---|---|---|
| 32 C St | 0.06mi | 1/1.0 | 461 (-13%) | 9mo | $179,500 | $389 | 67 |
Match score weights: distance 35% · size 25% · config 20% · recency 20%. Top-matched comps best support the ARV.
Projected returns pro-forma
-3.0% appreciation · 3.0% rent growth · sell at horizon
- IRR
- -19.9%
- Equity multiple
- 0.30×
- Total profit
- $-33,413
- Equity at exit
- $25,601
- IRR
- -12.3%
- Equity multiple
- 0.26×
- Total profit
- $-35,389
- Equity at exit
- $14,845
Cash invested: $48,076 (down + closing). Projections, not guarantees.
Landlord ↔ Tenant lean methodology
- Overall (STATE)
- 91 Strongly Landlord-Friendly
- State Idaho
- 91 Strongly Landlord-Friendly · R+18
- County
- — inherits STATE
- City
- — inherits STATE
ZIP-level market 83611
- Home prices YoY
- -27.9%
- Active inventory
- 410
- Price-to-rent
- 7.2×
Monthly cashflow live
- Estimated rent
- $1,994 medium interval (Pro) →
- Mortgage (P&I)
- −$900
- Tax est. 1.5%
- −$215 /mo · $2,576/yr
- Insurance
- −$72
- Flood insurance flood zone
- −$427 /mo · $5,118/yr
- HOA
- −$55
- Vacancy / Maint / Mgmt
- −$419
- Net cashflow
- $-93
Break-even live
Sensitivity live
| Price | -10% $26 | -5% $-34 | +0% $-93 | +5% $-152 | +10% $-212 |
|---|---|---|---|---|---|
| Rent | -10% $-250 | -5% $-172 | +0% $-93 | +5% $-14 | +10% $65 |
| Rate | -1.0pp $-6 | -0.5pp $-49 | base $-93 | +0.5pp $-137 | +1.0pp $-183 |
UW: 25.0% down · 7.5% · 30yr · 1.5% tax · 5.0% vac · 8.0% maint · 8.0% mgmt
Financing live
Cash to close
- Down payment
- $42,925
- Closing costs
- $5,151
- Reserves months
- —
- Total cash needed
- —
Loan-product check · same deal, 3 products live
Conventional
25% down · 7.5% · 30yr
- Down + closing
- —
- Monthly P&I
- —
- Monthly cashflow
- —
- DSCR
- —
- Eligible?
- —
Personal DTI + credit; lowest rate.
DSCR
20% down · 8.5% · 30yr
- Down + closing
- —
- Monthly P&I
- —
- Monthly cashflow
- —
- DSCR
- —
- Eligible?
- —
No personal income docs; deal must DSCR.
Hard money
10% down · 12.0% · 12mo
- Down + closing
- —
- Monthly P&I
- —
- Monthly cashflow
- —
- DSCR
- —
- Eligible?
- —
Short-term bridge; refi at stabilization.
HOA detail
- Monthly dues
- $55 · $660/yr
- Likely covers
- waterpool
Listing history 20 events
-
2026-06-16status $171,700 Pending 48 DOM
-
2026-06-15days on market $171,700 Active 48 DOM
-
2026-06-13days on market $171,700 Active 46 DOM
-
2026-06-12days on market $171,700 Active 45 DOM
-
2026-06-09days on market $171,700 Active 42 DOM
-
2026-06-08days on market $171,700 Active 41 DOM
-
2026-06-07remarks 699-char remark
-
2026-06-07days on market $171,700 Active 40 DOM
-
2026-06-04days on market $171,700 Active 36 DOM
-
2026-06-02days on market $171,700 Active 35 DOM
-
2026-06-01days on market $171,700 Active 34 DOM
-
2026-05-31days on market $171,700 Active 33 DOM
-
2026-05-31days on market $171,700 Active 32 DOM
-
2026-05-12price $179,000
-
2026-04-28$185,000 Active
-
2018-04-20soldstatus 310-char remark
Show marketing remark (310 chars)
EXCELLENT FULLY REFURBISHED park model. New refrigerator, new combo microwave convection oven. Screened in porch. Just across the street from the seasonal pool, laundry facility, and pavilion. Leisure Time borders the Payette River and the 2.5 mile Strand with Kelly's Whitewater Park only 1/2 mile downstream.
-
2018-03-22$69,000 310-char remark
Show marketing remark (310 chars)
EXCELLENT FULLY REFURBISHED park model. New refrigerator, new combo microwave convection oven. Screened in porch. Just across the street from the seasonal pool, laundry facility, and pavilion. Leisure Time borders the Payette River and the 2.5 mile Strand with Kelly's Whitewater Park only 1/2 mile downstream.
-
2016-08-15soldstatus
-
2015-08-21$49,900
-
2015-08-21$49,900
ⓘ Source: listings_history table (triggers on properties + properties_extension) + one-shot
backfill from property_details.listing_events for pre-trigger history.
Climate risk First Street
- Flood 7/10 Severe FEMA zone AE · 77% chance over 30 yrs
- Wildfire 8/10 Severe
- Heat 2/10 Low 7 d/yr ≥89°F today · 18 d/yr by 30 yrs out
- Wind 1/10 Low
- Air quality 7/10 Severe 10 unhealthy d/yr today · 17 by 30 yrs out
Nearby sold comps map
Loading sold comps map…
Walkable amenities ~0.75 mi
Loading nearby amenities…
Taxation est. · year 1
- Rental income
- $23,928
- − Mortgage interest
- −$9,618
- − Property taxes
- −$2,576
- − Insurance
- −$5,977
- − Repairs & maintenance
- −$1,914
- − Management
- −$1,914
- − HOA
- −$660
- − Depreciation
- −$4,995
- Taxable loss
- −$3,726
- Est. tax savings @ 24.0%
- +$894
- After-tax cash flow
- $-220/yr
For passive investors: Depreciation is non-cash, so a rental often shows a tax loss while cash-flowing — sheltering income. Rental losses are passive: they offset passive income freely, and up to $25,000/yr can offset ordinary (W-2) income if you actively participate and your MAGI is under $100k (phasing out to $0 by $150k); unused losses carry forward. On sale, claimed depreciation is recaptured at up to 25%, and gains may owe capital-gains tax (a 1031 exchange can defer both). Figures are a year-1 estimate at your 24.0% rate — not tax advice; consult a CPA.
Condition & rehab AI · 12 photos
This home is in good condition with recent updates and is ready for immediate occupancy. It offers a great location with easy access to recreational activities and amenities.
Value-add opportunities
- Both landscaping and curb appeal — enhances curb appeal and property value
- Both interior paint — fresh paint can make a significant difference in the home's appearance
- Rental furniture — furniture can make the home more appealing to renters
Renovation cost estimate screening
Value-add ROI direction
- Both landscaping and curb appeal — enhances curb appeal and property value ↑
- Both interior paint — fresh paint can make a significant difference in the home's appearance ↑
- Rental furniture — furniture can make the home more appealing to renters ↑
ⓘ Cost ranges are severity-bucket heuristics (US national rule-of-thumb). Get contractor quotes + a written scope before underwriting a rehab budget.
Schools (NCES district)
- District
- Cascade District
- NCES district ID
- 1600630
- Math proficiency
- 35% ▲ 5.00%
- Reading proficiency
- 45% ▬ 0.00%
- Median HH income
- $49,227
- Composite
- 36.83/100
- National rank
- #9162
- State rank
- #94 of 133 in ID
Livability — Cascade
- Score
- 66/100
- State rank
- #116
- US rank
- #12378
Category grades
Schools grade is shown separately in the Schools card above.
Census & demographics
- Census place
- Cascade, ID
- Population (ZIP)
- 2,997
Population outlook (Valley County) Hauer SSP2
- Today (2025)
- 10,964 people
- By 2030
- 11,279 · +2.9%
- By 2040
- 11,584 · +5.7%
- By 2050
- 11,754 · +7.2%
- By 2075
- 12,246 · +11.7%
- By 2100
- 11,948 · +9.0%
Race, ethnicity, and origin ACS 2023
- Neighborhood character
- Predominantly White (91%)
- Race & ethnicity
- White 91% Hispanic / Latino 7% Two or more races 6%
- Hispanic origin (detail)
- Mexican 2%
- Common ancestry
- Slovak 7% Dutch 6% Portuguese 5%
- Foreign-born
- 3% · Canada
- Languages at home
- 95% English-only · Spanish 4%
Political lean MEDSL · Valley
- 2024 margin
- R (+18.6) · D 39.6% · R 58.2% · Other 2.2%
- 2008→2024 swing
- -11.6pp toward R · 2008: -6.9pp · 2024: -18.6pp
- All cycles
- 2024: R+18.6 2020: R+13.7 2016: R+18.6 2012: R+11.6 2008: R+6.9
Not yet ingested
- Civics
- —
Market trends
- HPI YoY
- ▼ -118.61%
- Current HPI
- 307.0117
- Rent YoY
- —
- Metro
- —
- State GDP YoY
- ▲ 4.51%
- F500 in state
- 6
Industry mix (Fortune 500 HQ in ID)
| Industry | F500 HQs | Revenue |
|---|---|---|
| Retail | 1 | $79B |
|
||
| Technology | 1 | $25B |
|
||
| Food / Agriculture | 1 | $6B |
|
||
Price history
+258.7% since first listed7 events — show timeline
- 2026-05-12 Price Changed $179,000 IMLS
- 2026-04-28 Listed $185,000 IMLS
- 2018-04-20 Sold (MLS) — MCAOR
- 2018-03-22 Listed $69,000 MCAOR
- 2016-08-15 Sold (MLS) — MCAOR
- 2015-08-21 Listed $49,900 MCAOR
- 2015-08-21 Listed $49,900 IMLS
Cash-flow waterfall
monthlySold comps — $/sqft
last 12 mo · ≤1 miLoading sold comps…