 Duplex
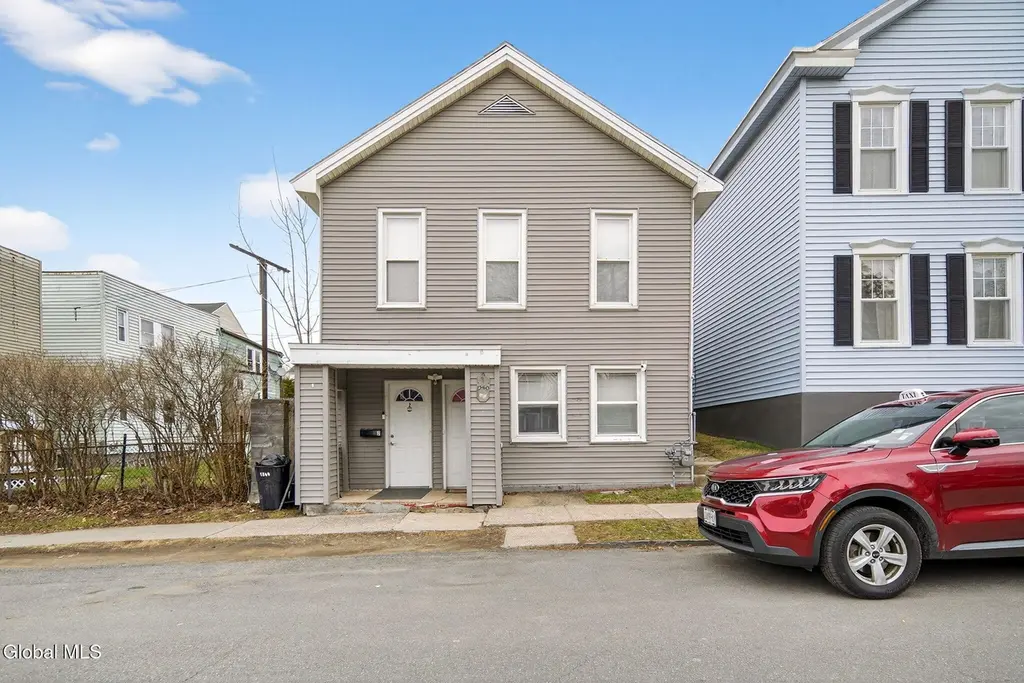
1540 8th Ave · Watervliet, NY
Flood risk 1/10 · Minimal
- FEMA flood zone
- X (unshaded)
- Chance of flooding over 30 yrs
- 0.0%
- Est. flood insurance / yr
- $507 – $1,088
Fire risk 1/10 · Minimal
- Est. fire insurance / yr
- $691 – $1,283
Heat risk 4/10 · Minor
- Hot days now (above 96°F)
- 7 days/yr
- Hot days in 30 yrs
- 17 days/yr
Wind risk 3/10 · Minor
- Chance of severe wind over 30 yrs
- 6.0%
Air-quality risk 2/10 · Minimal
- Unhealthy air days now
- 0 days/yr
- Unhealthy air days in 30 yrs
- 1 days/yr
Risk factors via First Street. Map © Google.
Why this score? — see what drove the B- grade
The composite is a weighted blend of 9 inputs, each scored 0–100. Each bar is that input's sub-score; the figure is the points it added to the 100-point composite (weight × sub-score).
- Cash flow +24.7/30.0
- ARV discount +15.0/15.0
- DSCR +8.0/10.0
- 1% rule +7.6/10.0
- Rent growth +4.2/5.0
- Livability +4.2/5.0
- Schools +3.4/10.0
- Condition / age +2.5/5.0
- Appreciation +0.0/10.0
$275,000
🖨 Deal sheet 📄 Offer letter ✓ Due diligence
Multi-family units
County records classify this as Multi-Family (2-4 Unit). Listing-text estimate: 2 units. confirmed
Listing remarks
Fully renovated two-family property in a convenient Watervliet location! This turnkey investment features a spacious 3-bedroom unit upstairs and a 2-bedroom unit on the first floor, both currently unoccupied. Second floor unit has a private backyard. Whether you're looking to expand your portfolio or owner-occupy in the future, this is a solid opportunity with strong rental history and minimal upkeep needed.
Key facts
- Fully renovated
- Private backyard
- Turnkey investment
Tags
Property features AI
Finance
- Financial info: Multi-family with 2 total units; Tenants pay electricity; Owner pays trash collection, sewer, management, snow removal, and water
Exterior
- Parking: 4 parking spaces
- Utilities: Public water; Public sewer
- Home design: Duplex; Living area approximately 2,231
- Construction: Vinyl siding
- Exterior features: Shingle roof; Back yard with chain link fencing
Interior
- Bedrooms: Unit 1: 2 bedrooms; Unit 2: 3 bedrooms
- Bathrooms: 2 full bathrooms total (one full bath on the 1st level and one full bath on the 2nd level); Unit 1: 1 full bath; Unit 2: 1 full bath
- Heating & cooling: Electric heating; Hot water heating
- Interior features: Partial basement with an apartment-style area
Neighborhood map
What this means for you Summary
Snapshot
- This is a 2 × 2-bed/1.0-bath units multifamily listed at $275k.
Deal economics
- At list price, monthly cash flow is $577 ($7k/yr) — positive. Per door: $289/mo.
- The deal already cash-flows at list — no discount required.
- Meets the 1% rule at list price ($3k rent vs $275k).
- Recommended offer: $267k (3.0% below list) — sets the bar for market timing.
- Cap rate 8.8% vs local median 5.9% in Watervliet — top-decile yield for the area; either an underpriced asset or a hidden risk that comps aren't pricing in. Stress-test before assuming the spread holds.
Location & tenants
- Location reads 84/100 on livability (#51 in NY, #786 nationally) — a professional / high-income tenant draw. Strengths: amenities A+, housing A+, health & safety A+; Watch: crime D+, schools D.
- Watervliet City School District (suburban): math 36% / reading 45% proficiency, ranked #524 of 590 in NY (top 89%) — families likely to look elsewhere, expect single-tenant / working-renter base with shorter leases.
- Market conditions: Rents rising fast (+6.6%/yr); 72 active listings in the ZIP; 11 comparable units currently listed for rent nearby; rentals at typical pace (median 19d on market — plan ~3-4 weeks tenant-placement turnaround); 675 units permitted in Albany County in 2024 (451 in 5+ unit buildings).
- At $3,454/mo this rent would consume 63% of the median local household income ($65k/yr) (locally 1224% of renters already pay >50% of income on rent) — very limited rent-growth headroom before tenants either downsize or default.
Forward outlook
- Local home prices are declining (-3.0%/yr); year-one equity from $2k of loan paydown is wiped out by about $8k of value loss. Plan a longer hold.
- Albany County population projected at +9% by 2050 — modest demand growth; plan on rents tracking national, not racing it.
- At projected returns (-3.0% appreciation + 6.6% rent growth), your $77k cash investment doubles in ~8 years — after that, you're playing with house money.
Negotiation context
- It's been on market 35 days — a 3% lower offer ($267k) is reasonable based on typical stale-listing flexibility.
- 3 sale attempts since 4y ago with the ask held roughly flat each time — persistent listings suggest the price (not the market) is what's stuck; bring a comps-based counter.
- Current owner paid $115k; list at $275k implies a 139% gain — meaningful room to come down on a strong offer.
Risks & watch-outs
- Watch-outs: property tax is 2.6% of price.
Questions for the listing agent
- It's been on market 35 days. Have you received any prior offers? Is the seller open to a 3% concession, seller financing, or rate buy-down credit?
- Can we see the unit-by-unit rent roll, current vacancy, and any below-market leases? What's the average tenancy length?
- What capital expenditures (roof, boiler, parking lot, exteriors) have been made in the last 5 years, and what's planned in the next 2?
- Built in 1970 — when were the roof, HVAC, electrical panel, plumbing, and water heater last replaced?
- Property tax is high relative to price — has the assessment been appealed recently, and will the sale trigger a re-assessment?
- Is there a deadline driving the sale (1031 exchange, divorce, estate, relocation)? That informs how much negotiation room exists.
- Schools are D-rated, which usually means shorter tenancies and higher turnover. Who's the typical renter profile here, and what's been the actual vacancy rate?
- Crime grade is D in this area — have there been break-ins, vandalism, or insurance claims at this property in the last 3 years? What carrier currently insures it and at what premium?
- What's the average days-on-market for RENTAL listings here right now (not sales)? A rising rental-DOM trend means longer vacancies and softer asking-rent achievability than the comps imply.
- What's the recent tenant-quality profile in this submarket — average credit score on applications, eviction rate, late-payment / NSF rate, and stable-employment percentage? A property-management company in the area should have these aggregated.
- How much new apartment / multifamily construction is in the pipeline within 1–3 miles? Heavy new supply (>2% of stock underway) typically softens rents 12–24 months out; light construction supports rent growth.
Investment metrics
- 1% rule
- 1.26% ✓
- Cap rate
- 8.81%
- Cash-on-cash
- 9.00%
- DSCR
- 1.40
- GRM
- 6.6
CMA / ARV
- ARV (median comp)
- $433,645
- List price
- $275,000
- Delta
- -36.58%
- Verdict
- UNDERPRICED
- Comps
- 20 within 1.0 mi
Show comp detail 12 sales within ~0.75 mi
| Address | Dist | Beds/Ba | Sqft | Sold | Price | $/sf | Match |
|---|---|---|---|---|---|---|---|
| 1801 9th Ave | 0.15mi | 6/3.0 (+1) | 2,244 (+1%) | 2mo | $340,000 | $152 | 82 |
| 1525 6th Ave | 0.09mi | 5/2.0 | 2,464 (+10%) | 2mo | $240,000 | $97 | 77 |
| 1316 5th Ave | 0.26mi | 5/2.0 | 2,346 (+5%) | 5mo | $280,000 | $119 | 75 |
| 1506-08 7th Ave | 0.09mi | 4/4.0 (-1) | 2,108 (-6%) | 0mo | $190,000 | $90 | 74 |
| 1551 4th Ave | 0.17mi | 6/2.0 (+1) | 2,058 (-8%) | 5mo | $230,000 | $112 | 70 |
| 25 13th St | 0.46mi | 5/2.0 | 2,106 (-6%) | 1mo | $289,900 | $138 | 69 |
| 2127 2nd Ave | 0.42mi | 5/2.0 | 2,345 (+5%) | 8mo | $188,000 | $80 | 65 |
| 1235 5th Ave | 0.30mi | 4/3.0 (-1) | 2,328 (+4%) | 6mo | $290,000 | $125 | 64 |
| 2315 3rd Ave | 0.45mi | 6/2.0 (+1) | 2,334 (+5%) | 6mo | $221,100 | $95 | 61 |
| 818 24th St | 0.44mi | 4/2.0 (-1) | 2,066 (-7%) | 8mo | $274,000 | $133 | 56 |
| 2327 12th Ave | 0.54mi | 4/2.0 (-1) | 2,068 (-7%) | 5mo | $290,000 | $140 | 54 |
| 902 19th St | 0.29mi | 6/2.5 (+1) | 2,560 (+15%) | 2mo | $250,000 | $98 | 54 |
Match score weights: distance 35% · size 25% · config 20% · recency 20%. Top-matched comps best support the ARV.
Projected returns pro-forma
-3.0% appreciation · 6.61% rent growth · sell at horizon
- IRR
- 1.8%
- Equity multiple
- 1.07×
- Total profit
- $5,416
- Equity at exit
- $41,003
- IRR
- 14.9%
- Equity multiple
- 2.43×
- Total profit
- $110,366
- Equity at exit
- $23,777
Cash invested: $77,000 (down + closing). Projections, not guarantees.
Landlord ↔ Tenant lean methodology
- Overall (STATE)
- 15 Strongly Tenant-Friendly
- State New York
- 15 Strongly Tenant-Friendly · D+10
- County
- — inherits STATE
- City
- — inherits STATE
ZIP-level market 12189
- Home prices YoY
- -28.7%
- Rents YoY
- 6.6%
- Active inventory
- 72
- Price-to-rent
- 13.3×
Monthly cashflow live
- Estimated rent
- $3,454 high interval (Pro) →
- Mortgage (P&I)
- −$1,442
- Tax from tax record
- −$595 /mo · $7,135/yr
- Insurance
- −$115
- HOA
- −$0
- Vacancy / Maint / Mgmt
- −$725
- Net cashflow
- $577
Break-even live
2-unit breakdown (identical units grouped — click to expand)
| Units | Beds | Baths | Est. rent |
|---|---|---|---|
| 2× units | 2 | 1 | $3,454 |
| #1 | 2 | 1 | $1,727 |
| #2 | 2 | 1 | $1,727 |
| Total (2 units) | $3,454 | ||
UW: 25.0% down · 7.5% · 30yr · 1.5% tax · 5.0% vac · 8.0% maint · 8.0% mgmt
Financing live
Cash to close
- Down payment
- $68,750
- Closing costs
- $8,250
- Reserves months
- —
- Total cash needed
- —
Loan-product check · same deal, 3 products live
Conventional
25% down · 7.5% · 30yr
- Down + closing
- —
- Monthly P&I
- —
- Monthly cashflow
- —
- DSCR
- —
- Eligible?
- —
Personal DTI + credit; lowest rate.
DSCR
20% down · 8.5% · 30yr
- Down + closing
- —
- Monthly P&I
- —
- Monthly cashflow
- —
- DSCR
- —
- Eligible?
- —
No personal income docs; deal must DSCR.
Hard money
10% down · 12.0% · 12mo
- Down + closing
- —
- Monthly P&I
- —
- Monthly cashflow
- —
- DSCR
- —
- Eligible?
- —
Short-term bridge; refi at stabilization.
Rent comps 11 comps
| Address | Beds | Baths | Sqft | Rent | $/sqft | DOM | Units | Dist |
|---|---|---|---|---|---|---|---|---|
| 150 2nd St Troy, NY | 4.0 | 1.5 | 2442 | $3,000 | $1.23 | 21d | 1 | 0.80mi |
| 17 State St Troy, NY | 4.0 | 1.0–1.5 | 1810 | $3,635 | $2.01 | 14d | 7 | 0.83mi |
| 1520 6th Ave Troy, NY | 2.0–4.0 | 2.0–4.0 | 1209 | $1,349 | $1.12 | 23d | 8 | 1.07mi |
| 904 Peoples Ave Troy, NY | 4.0 | 1.0 | 1800 | $645 | $0.36 | 18d | 1 | 1.40mi |
| 53 13th St Troy, NY | 4.0 | 1.0 | 1500 | $650 | $0.43 | 18d | 1 | 1.42mi |
| 51 14th St Unit 2 Troy, NY | 4.0 | 2.0 | 2000 | $725 | $0.36 | 18d | 1 | 1.45mi |
| 79 14th St Unit 2 Troy, NY | 4.0 | 1.0 | 1500 | $650 | $0.43 | 18d | 1 | 1.45mi |
| 97 14th St Troy, NY | 4.0 | 2.0 | 1500 | $650 | $0.43 | 18d | 1 | 1.46mi |
| 97 14th St Unit 2 Troy, NY | 5.0 | 2.0 | 1600 | $625 | $0.39 | 18d | 1 | 1.46mi |
| 136 9th St Unit 3 Troy, NY | 4.0 | 1.0 | 1500 | $595 | $0.40 | 18d | 1 | 1.46mi |
| 88 14th St Unit 2 Troy, NY | 4.0 | 1.0 | 1500 | $650 | $0.43 | 18d | 1 | 1.47mi |
Listing history 21 events
-
2026-06-18days on market $275,000 Active 35 DOM
-
2026-06-17days on market $275,000 Active 34 DOM
-
2026-06-16days on market $275,000 Active 33 DOM
-
2026-06-15days on market $275,000 Active 32 DOM
-
2026-06-14days on market $275,000 Active 30 DOM
-
2026-06-10days on market $275,000 Active 27 DOM
-
2026-06-09days on market $275,000 Active 26 DOM
-
2026-06-08days on market $275,000 Active 25 DOM
-
2026-06-07days on market $275,000 Active 24 DOM
-
2026-06-05days on market $275,000 Active 21 DOM
-
2026-06-03days on market $275,000 Active 20 DOM
-
2026-06-02days on market $275,000 Active 19 DOM
-
2026-06-01days on market $275,000 Active 18 DOM
-
2026-05-31days on market $275,000 Active 17 DOM
-
2026-05-31days on market $275,000 Active 16 DOM
-
2026-05-11historical
-
2026-05-11$275,000 Active 411-char remark
-
2026-03-27$275,000 Active
-
2023-02-06soldstatus $115,000
-
2022-11-29historical
-
2022-11-25$139,000 Active
ⓘ Source: listings_history table (triggers on properties + properties_extension) + one-shot
backfill from property_details.listing_events for pre-trigger history.
Tax reassessment forecast NY · Partial reset (capped growth)
- Current annual tax
- $7,135 · $595/mo
- Projected year-2 tax
- $7,135 · $595/mo
- Expected delta
- $0/yr ($0/mo · 0.0%)
ⓘ Screening estimate from a state-policy table — verify with the county assessor before closing.
Climate risk First Street
- Flood 1/10 Low FEMA zone X (unshaded) · 0% chance over 30 yrs
- Wildfire 1/10 Low
- Heat 4/10 Moderate 7 d/yr ≥96°F today · 17 d/yr by 30 yrs out
- Wind 3/10 Moderate 6% chance of damaging wind over 30 yrs
- Air quality 2/10 Low 0 unhealthy d/yr today · 1 by 30 yrs out
Nearby sold comps map
Loading sold comps map…
Walkable amenities ~0.75 mi
Loading nearby amenities…
Taxation est. · year 1
- Rental income
- $41,448
- − Mortgage interest
- −$15,404
- − Property taxes
- −$7,135
- − Insurance
- −$1,375
- − Repairs & maintenance
- −$3,316
- − Management
- −$3,316
- − Depreciation
- −$8,000
- Taxable income
- $2,902
- Est. tax owed @ 24.0%
- −$696
- After-tax cash flow
- $6,232/yr
For passive investors: Depreciation is non-cash, so a rental often shows a tax loss while cash-flowing — sheltering income. Rental losses are passive: they offset passive income freely, and up to $25,000/yr can offset ordinary (W-2) income if you actively participate and your MAGI is under $100k (phasing out to $0 by $150k); unused losses carry forward. On sale, claimed depreciation is recaptured at up to 25%, and gains may owe capital-gains tax (a 1031 exchange can defer both). Figures are a year-1 estimate at your 24.0% rate — not tax advice; consult a CPA.
Schools (NCES district)
- District
- Watervliet City School District
- NCES district ID
- 3630210
- Math proficiency
- 36% ▼ -2.00%
- Reading proficiency
- 45% ▬ 0.00%
- Median HH income
- $43,276
- Composite
- 34.23/100
- National rank
- #5261
- State rank
- #524 of 590 in NY
Livability — Watervliet
- Score
- 84/100
- State rank
- #51
- US rank
- #786
Category grades
Schools grade is shown separately in the Schools card above.
Census & demographics
- Census place
- Watervliet, NY
- County
- Albany County · 196,626 people
- City population
- 18,656
- Metro
- Albany-Schenectady-Troy, NY
- Population (ZIP)
- 18,656
- Household income
- $65,276
- Rent vs Own
- Severe rent burden
- 1224.0
Population outlook (Albany County) Hauer SSP2
- Today (2025)
- 320,794 people
- By 2030
- 327,401 · +2.1%
- By 2040
- 338,218 · +5.4%
- By 2050
- 348,467 · +8.6%
- By 2075
- 381,693 · +19.0%
- By 2100
- 393,809 · +22.8%
Race, ethnicity, and origin ACS 2023
- Neighborhood character
- Predominantly White (72%)
- Race & ethnicity
- White 72% Two or more races 8% Asian 8% Black 8% Hispanic / Latino 6%
- Hispanic origin (detail)
- Mexican 2% Puerto Rican 2% Dominican 1%
- Common ancestry
- Lithuanian 6% Romanian 5% Scotch-Irish 4%
- Foreign-born
- 11% · Canada, China, South Korea
- Languages at home
- 88% English-only · Other Indo-European 4% Spanish 2% Other Asian/Pacific 2%
Political lean MEDSL · Albany
- 2024 margin
- Strong D (+25.8) · D 62.9% · R 37.1%
- 2008→2024 swing
- -3.6pp toward R · 2008: 29.4pp · 2024: 25.8pp
- All cycles
- 2024: D+25.8 2020: D+31.4 2016: D+24.3 2012: D+31.0 2008: D+29.4
Not yet ingested
- Civics
- —
Market trends
- HPI YoY
- ▼ -110.16%
- Current HPI
- 273.8109
- Rent YoY
- ▲ 6.61%
- Metro
- Albany-Schenectady-Troy, NY
- State GDP YoY
- ▲ 2.60%
- F500 in state
- 92
Industry mix (Fortune 500 HQ in NY)
| Industry | F500 HQs | Revenue |
|---|---|---|
| Financial Services | 10 | $950B |
|
||
| Consumer Goods | 9 | $162B |
|
||
| Insurance | 4 | $225B |
|
||
| Telecommunications | 2 | $144B |
|
||
| Pharmaceuticals | 2 | $112B |
|
||
| Media / Entertainment | 2 | $69B |
|
||
Price history
+97.8% since first listed6 events — show timeline
- 2026-05-11 Listed $275,000 Global MLS
- 2026-05-11 Listing Removed — Global MLS
- 2026-03-27 Listed $275,000 Global MLS
- 2023-02-06 Sold (Public Records) $115,000 Public Records
- 2022-11-29 Listing Removed — Global MLS
- 2022-11-25 Listed $139,000 Global MLS
Property tax history
+7.1%/yrLatest (2025): $7,135 · +30.7% YoY. Source: county tax records.
Cash-flow waterfall
monthlySold comps — $/sqft
last 12 mo · ≤1 miLoading sold comps…