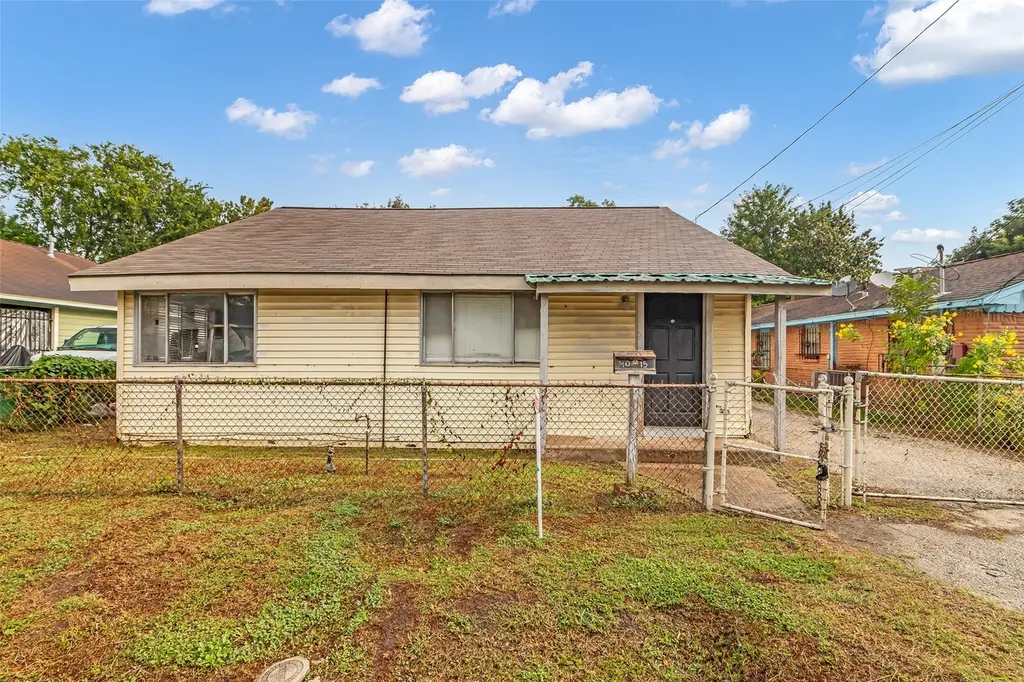
4015 Lila · Houston, TX
Flood risk 1/10 · Minimal
- FEMA flood zone
- X (shaded)
- Chance of flooding over 30 yrs
- 0.0%
- Est. flood insurance / yr
- $507 – $1,088
Fire risk 1/10 · Minimal
- Est. fire insurance / yr
- $1,222 – $2,270
Heat risk 9/10 · Severe
- Hot days now (above 109°F)
- 7 days/yr
- Hot days in 30 yrs
- 24 days/yr
Wind risk 9/10 · Severe
- Chance of severe wind over 30 yrs
- 99.0%
Air-quality risk 3/10 · Minor
- Unhealthy air days now
- 2 days/yr
- Unhealthy air days in 30 yrs
- 3 days/yr
Risk factors via First Street. Map © Google.
Why this score? — see what drove the C grade
The composite is a weighted blend of 9 inputs, each scored 0–100. Each bar is that input's sub-score; the figure is the points it added to the 100-point composite (weight × sub-score).
- Cash flow +15.7/30.0
- ARV discount +15.0/15.0
- Appreciation +6.9/10.0
- 1% rule +5.1/10.0
- DSCR +4.8/10.0
- Livability +3.7/5.0
- Rent growth +3.3/5.0
- Schools +2.7/10.0
- Condition / age +2.5/5.0
$120,000
🖨 Deal sheet (PDF) 📄 Offer letter ✓ Due diligence
Listing remarks MLS
FIXER UPPER! BUYER TO PURCHASE NEW SURVEY IF NEEDED. TWO HOMES ON THE PROPERTY, ONE IN THE FRONT IS THE MAIN HOUSE AND A SMALLER HOUSE IN THE BACK. BUYER TO DO DUE-DILIGENCE. CLOSE TO HWY 59 GOING INTO HOUSTON. CLOSE TO BUSH AIRPORT.
Key facts
- Close to hwy 59
- Main house
- Parking
Tags
Neighborhood map
What this means for you Summary
Snapshot
- This is a 3-bed/1.0-bath single-family listed at $120k.
Deal economics
- At list price, monthly cash flow is $52 ($627/yr) — positive.
- The deal already cash-flows at list — no discount required.
- Meets the 1% rule at list price ($1k rent vs $120k).
- Recommended offer: $113k (6.0% below list) — sets the bar for market timing.
- Cap rate 6.8% vs local median 3.2% in Houston — top-decile yield for the area; either an underpriced asset or a hidden risk that comps aren't pricing in. Stress-test before assuming the spread holds.
Location & tenants
- Location reads 74/100 on livability (#184 in TX, #4,771 nationally) — a middle-class / working-renter tenant base. Strengths: amenities A+, cost of living A+, housing A+; Watch: schools D, crime F.
- Houston ISD (urban): math 27% / reading 35% proficiency, ranked #593 of 826 in TX (top 72%) — families likely to look elsewhere, expect single-tenant / working-renter base with shorter leases; 71% free/reduced lunch — lower-income household profile, screen leases tightly.
- Market conditions: Rents rising (+3.1%/yr); 448 active listings in the ZIP; 33 comparable units currently listed for rent nearby; rentals at typical pace (median 25d on market — plan ~3-4 weeks tenant-placement turnaround); 48% of comp listings sitting > 30 days — soft ceiling on asking rent; lower-income renter base — watch delinquency; 29,883 units permitted in Harris County in 2024 (8,621 in 5+ unit buildings).
- This rent runs 37% of the median local income ($39k/yr) — at the standard rent-burdened threshold; future hikes will face affordability resistance.
Forward outlook
- In year one you build about $6k of equity ($830 loan paydown + $5k appreciation (3.9% local appreciation)).
- Harris County population projected at +47% by 2050 — long-run rental-demand tailwind backs the buy-and-hold thesis.
- At projected returns (3.9% appreciation + 3.1% rent growth), your $34k cash investment doubles in ~5 years — after that, you're playing with house money.
- By year 7, paydown + projected appreciation supports a ~$35k cash-out refi (75% LTV) — recoverable capital for the next deal without selling this one.
Negotiation context
- It's been on market 86 days — a 6% lower offer ($113k) is reasonable based on typical stale-listing flexibility.
- 3 sale attempts with the ask held roughly flat each time — persistent listings suggest the price (not the market) is what's stuck; bring a comps-based counter.
Risks & watch-outs
- Watch-outs: built in 1950 — expect roof / HVAC / electrical / plumbing capex.
- Climate carrying-cost: severe wind risk, 99% chance of damaging wind over 30y; extreme-heat days projected 7→24/yr by 2055 (HVAC capex compounding) — expect insurance premiums to compound above CPI over the hold.
Questions for the listing agent
- It's been on market 86 days. Have you received any prior offers? Is the seller open to a 6% concession, seller financing, or rate buy-down credit?
- Built in 1950 — when were the roof, HVAC, electrical panel, plumbing, and water heater last replaced?
- Why hasn't it sold? Are there any deal-killer items the seller is aware of (foundation, flood, title, zoning, code violations)?
- Is there a deadline driving the sale (1031 exchange, divorce, estate, relocation)? That informs how much negotiation room exists.
- Schools are D-rated, which usually means shorter tenancies and higher turnover. Who's the typical renter profile here, and what's been the actual vacancy rate?
- Crime grade is F in this area — have there been break-ins, vandalism, or insurance claims at this property in the last 3 years? What carrier currently insures it and at what premium?
- What's the average days-on-market for RENTAL listings here right now (not sales)? A rising rental-DOM trend means longer vacancies and softer asking-rent achievability than the comps imply.
- What's the recent tenant-quality profile in this submarket — average credit score on applications, eviction rate, late-payment / NSF rate, and stable-employment percentage? A property-management company in the area should have these aggregated.
- How much new for-sale + rental construction is in the pipeline within 1–3 miles? Heavy new supply typically softens prices + rents 12–24 months out; constrained supply supports both.
Investment metrics
- 1% rule
- 1.01% ✓
- Cap rate
- 6.82%
- Cash-on-cash
- 1.87%
- DSCR
- 1.08
- GRM
- 8.2
CMA / ARV
- ARV (median comp)
- $208,797
- List price
- $120,000
- Delta
- -42.53%
- Verdict
- UNDERPRICED
- Comps
- 20 within 1.0 mi
Show comp detail 12 sales within ~0.75 mi
| Address | Dist | Beds/Ba | Sqft | Sold | Price | $/sf | Match |
|---|---|---|---|---|---|---|---|
| 4214 Quitman St | 0.32mi | 3/2.0 | 1,128 (+4%) | 0mo | $174,999 | $155 | 74 |
| 3714 Christie St | 0.68mi | 2/1.0 (-1) | 1,086 (+1%) | 4mo | $150,000 | $138 | 59 |
| 2405 Pannell St | 0.29mi | 3/1.5 | 1,230 (+14%) | 3mo | $99,500 | $81 | 59 |
| 4314 Rawley St | 0.65mi | 3/1.0 | 1,048 (-3%) | 9mo | $195,900 | $187 | 57 |
| 3706 Lucille St | 0.22mi | 3/2.0 | 1,231 (+14%) | 7mo | $249,900 | $203 | 56 |
| 3920 Sayers | 0.58mi | 2/1.0 (-1) | 1,020 (-6%) | 6mo | $99,000 | $97 | 54 |
| 3117 Solo St | 0.56mi | 2/1.0 (-1) | 1,003 (-7%) | 11mo | $110,000 | $110 | 48 |
| 3053 Noble St | 0.67mi | 2/1.0 (-1) | 1,200 (+11%) | 1mo | $64,497 | $54 | 45 |
| 2114 Des Chaumes St | 0.64mi | 2/2.5 (-1) | 1,000 (-7%) | 10mo | $235,000 | $235 | 39 |
| 2112 Des Chaumes St | 0.64mi | 2/2.5 (-1) | 955 (-12%) | 1mo | $239,900 | $251 | 39 |
| 4010 Wayne St | 0.72mi | 4/2.0 (+1) | 1,193 (+10%) | 4mo | $150,000 | $126 | 37 |
| 2116 Des Chaumes St | 0.64mi | 2/2.5 (-1) | 955 (-12%) | 5mo | $240,000 | $251 | 36 |
Match score weights: distance 35% · size 25% · config 20% · recency 20%. Top-matched comps best support the ARV.
Projected returns pro-forma
3.89% appreciation · 3.08% rent growth · sell at horizon
- IRR
- 11.7%
- Equity multiple
- 1.71×
- Total profit
- $23,712
- Equity at exit
- $60,091
- IRR
- 13.4%
- Equity multiple
- 3.18×
- Total profit
- $73,136
- Equity at exit
- $97,690
Cash invested: $33,600 (down + closing). Projections, not guarantees.
Landlord ↔ Tenant lean methodology
- Overall (STATE)
- 87 Strongly Landlord-Friendly
- State Texas
- 87 Strongly Landlord-Friendly · R+5
- County
- — inherits STATE
- City
- — inherits STATE
ZIP-level market 77026
- Home prices YoY
- 1.5%
- Rents YoY
- 3.1%
- Active inventory
- 448
- Price-to-rent
- 8.2×
Monthly cashflow live
- Estimated rent
- $1,214 high interval (Pro) →
- Mortgage (P&I)
- −$629
- Tax from tax record
- −$227 /mo · $2,729/yr
- Insurance
- −$50
- HOA
- −$0
- Vacancy / Maint / Mgmt
- −$255
- Net cashflow
- $52
Break-even live
Sensitivity live
| Price | -10% $120 | -5% $86 | +0% $52 | +5% $18 | +10% $-16 |
|---|---|---|---|---|---|
| Rent | -10% $-44 | -5% $4 | +0% $52 | +5% $100 | +10% $148 |
| Rate | -1.0pp $113 | -0.5pp $83 | base $52 | +0.5pp $21 | +1.0pp $-10 |
UW: 25.0% down · 7.5% · 30yr · 1.5% tax · 5.0% vac · 8.0% maint · 8.0% mgmt
Financing live
Cash to close
- Down payment
- $30,000
- Closing costs
- $3,600
- Reserves months
- —
- Total cash needed
- —
Loan-product check · same deal, 3 products live
Conventional
25% down · 7.5% · 30yr
- Down + closing
- —
- Monthly P&I
- —
- Monthly cashflow
- —
- DSCR
- —
- Eligible?
- —
Personal DTI + credit; lowest rate.
DSCR
20% down · 8.5% · 30yr
- Down + closing
- —
- Monthly P&I
- —
- Monthly cashflow
- —
- DSCR
- —
- Eligible?
- —
No personal income docs; deal must DSCR.
Hard money
10% down · 12.0% · 12mo
- Down + closing
- —
- Monthly P&I
- —
- Monthly cashflow
- —
- DSCR
- —
- Eligible?
- —
Short-term bridge; refi at stabilization.
Rent comps 33 comps
| Address | Beds | Baths | Sqft | Rent | $/sqft | DOM | Units | Dist |
|---|---|---|---|---|---|---|---|---|
| 4509 Courtney St Houston, TX | 4.0 | 1.0 | 1456 | $1,150 | $0.79 | 23d | 1 | 0.34mi |
| 3502 Campbell St Houston, TX | 2.0 | 1.0 | 725 | $800 | $1.10 | 44d | 1 | 0.47mi |
| 3805 Wipprecht St Houston, TX | 2.0 | 1.0 | 768 | $1,100 | $1.43 | 19d | 1 | 0.63mi |
| 3813 Wipprecht St Houston, TX | 2.0 | 1.0 | 750 | $1,200 | $1.60 | 25d | 1 | 0.64mi |
| 4203 Hirsch Rd Unit 5 Houston, TX | 2.0 | 1.0 | 758 | $950 | $1.25 | 44d | 1 | 0.72mi |
| 4203 Hirsch Rd Unit 13 Houston, TX | 2.0 | 1.0 | 758 | $975 | $1.29 | 0d | 1 | 0.73mi |
| 3031 Sumpter St Unit 50 Houston, TX | 2.0 | 1.0 | 732 | $1,200 | $1.64 | 25d | 1 | 0.77mi |
| 4300 Lyons Ave Unit 304 Houston, TX | 4.0 | 2.0 | 1393 | $1,460 | $1.05 | 44d | 1 | 0.86mi |
| 3730 Lyons Ave Unit 216 Houston, TX | 3.0 | 2.0 | 1107 | $1,300 | $1.17 | 44d | 1 | 0.86mi |
| 4111 Cavalcade St Unit 5 Houston, TX | 2.0 | 1.0 | 757 | $825 | $1.09 | 44d | 1 | 0.88mi |
| 5504 Morwood St Houston, TX | 2.0 | 1.0 | 749 | $850 | $1.13 | 25d | 1 | 0.95mi |
| 2704 Sam Wilson St Unit 1391353P Houston, TX | 2.0 | 2.0 | 1001 | $2,082 | $2.08 | 0d | 1 | 0.96mi |
| 1513 Cage St Houston, TX | 3.0 | 2.0 | 1467 | $1,550 | $1.06 | 44d | 1 | 0.96mi |
| 3300 Lyons Ave Unit 304 Houston, TX | 4.0 | 2.0 | 1393 | $1,460 | $1.05 | 44d | 1 | 0.96mi |
| 5510 Morwood St Houston, TX | 2.0 | 1.0 | 749 | $650 | $0.87 | 25d | 1 | 0.98mi |
| 5514 Morgood St Houston, TX | 2.0 | 1.0 | 749 | $650 | $0.87 | 44d | 1 | 0.99mi |
| 5436 Makeig St Houston, TX | 2.0 | 1.0 | 749 | $650 | $0.87 | 25d | 1 | 0.99mi |
| 5430 Makeig St Houston, TX | 2.0 | 1.0 | 749 | $650 | $0.87 | 25d | 1 | 1.00mi |
| 5462 Makeig St Houston, TX | 2.0 | 1.0 | 749 | $650 | $0.87 | 25d | 1 | 1.02mi |
| 5605 Mulvey St Unit 1019610P Houston, TX | 3.0 | 2.5 | 1410 | $4,376 | $3.10 | 0d | 1 | 1.07mi |
| 4711 Sayers St Unit A Houston, TX | 2.0 | 1.0 | 1200 | $1,650 | $1.38 | 44d | 1 | 1.07mi |
| 2105 Sam Wilson St Houston, TX | 3.0 | 2.5 | 1416 | $6,750 | $4.77 | 44d | 1 | 1.08mi |
| 5506 Crane St Apt 2 Houston, TX | 2.0 | 1.0 | 800 | $750 | $0.94 | 44d | 1 | 1.09mi |
| 1714 Mary St Houston, TX | 2.0 | 2.0 | 1100 | $2,400 | $2.18 | 44d | 1 | 1.24mi |
| 3910 Woolworth St Houston, TX | 3.0 | 2.0 | 1150 | $1,750 | $1.52 | 44d | 1 | 1.25mi |
| 3802 Dabney St Houston, TX | 2.0 | 1.0 | 910 | $875 | $0.96 | 4d | 1 | 1.30mi |
| 3802 Dabney St Houston, TX | 1.0–2.0 | 1.0 | 825 | $990 | $1.20 | 44d | 2 | 1.30mi |
| 3822 Dabney St Unit 2 BEDROOM 3 Houston, TX | 2.0 | 1.0 | 756 | $985 | $1.30 | 44d | 1 | 1.31mi |
| 5408 Market St Unit 5408-1 Houston, TX | 2.0 | 1.0 | 730 | $900 | $1.23 | 6d | 1 | 1.33mi |
| 5117 Lavender St Houston, TX | 2.0 | 1.0 | 740 | $1,065 | $1.44 | 16d | 8 | 1.47mi |
| 5117 Lavender St Houston, TX | 2.0 | 1.0 | 740 | $1,040 | $1.41 | 8d | 4 | 1.47mi |
| 5117 Lavender St Houston, TX | 2.0–3.0 | 1.0 | 780 | $1,090 | $1.40 | 20d | 2 | 1.47mi |
| 5414 Pardee St Houston, TX | 3.0 | 2.0 | 1100 | $1,500 | $1.36 | 44d | 1 | 1.47mi |
Listing history 22 events
-
2026-06-21days on market $120,000 Active 86 DOM
-
2026-06-18days on market $120,000 Active 83 DOM
-
2026-06-17days on market $120,000 Active 82 DOM
-
2026-06-16days on market $120,000 Active 81 DOM
-
2026-06-15days on market $120,000 Active 80 DOM
-
2026-06-13days on market $120,000 Active 78 DOM
-
2026-06-10days on market $120,000 Active 74 DOM
-
2026-06-08days on market $120,000 Active 73 DOM
-
2026-06-07days on market $120,000 Active 72 DOM
-
2026-06-04days on market $120,000 Active 69 DOM
-
2026-06-01days on market $120,000 Active 66 DOM
-
2026-05-31days on market $120,000 Active 65 DOM
-
2026-04-09status Active 233-char remark
Show marketing remark (233 chars)
FIXER UPPER! BUYER TO PURCHASE NEW SURVEY IF NEEDED. TWO HOMES ON THE PROPERTY, ONE IN THE FRONT IS THE MAIN HOUSE AND A SMALLER HOUSE IN THE BACK. BUYER TO DO DUE-DILIGENCE. CLOSE TO HWY 59 GOING INTO HOUSTON. CLOSE TO BUSH AIRPORT.
-
2026-04-03status Pending 233-char remark
Show marketing remark (233 chars)
FIXER UPPER! BUYER TO PURCHASE NEW SURVEY IF NEEDED. TWO HOMES ON THE PROPERTY, ONE IN THE FRONT IS THE MAIN HOUSE AND A SMALLER HOUSE IN THE BACK. BUYER TO DO DUE-DILIGENCE. CLOSE TO HWY 59 GOING INTO HOUSTON. CLOSE TO BUSH AIRPORT.
-
2026-03-27$120,000 Active 233-char remark
Show marketing remark (233 chars)
FIXER UPPER! BUYER TO PURCHASE NEW SURVEY IF NEEDED. TWO HOMES ON THE PROPERTY, ONE IN THE FRONT IS THE MAIN HOUSE AND A SMALLER HOUSE IN THE BACK. BUYER TO DO DUE-DILIGENCE. CLOSE TO HWY 59 GOING INTO HOUSTON. CLOSE TO BUSH AIRPORT.
-
2026-02-15historical
-
2025-11-17price $120,000
-
2025-09-12price $135,000
-
2025-08-14$149,999 Active
-
2009-05-13soldstatus
-
2009-04-17soldstatus
-
1988-01-02soldstatus
ⓘ Source: listings_history table (triggers on properties + properties_extension) + one-shot
backfill from property_details.listing_events for pre-trigger history.
Tax reassessment forecast TX · Resets to sale price
- Current annual tax
- $2,729 · $227/mo
- Projected year-2 tax
- $2,729 · $227/mo
- Expected delta
- $0/yr ($0/mo · 0.0%)
ⓘ Screening estimate from a state-policy table — verify with the county assessor before closing.
Climate risk First Street
- Flood 1/10 Low FEMA zone X (shaded) · 0% chance over 30 yrs
- Wildfire 1/10 Low
- Heat 9/10 Extreme 7 d/yr ≥109°F today · 24 d/yr by 30 yrs out
- Wind 9/10 Extreme 99% chance of damaging wind over 30 yrs
- Air quality 3/10 Moderate 2 unhealthy d/yr today · 3 by 30 yrs out
Nearby sold comps map
Loading sold comps map…
Walkable amenities ~0.75 mi
Loading nearby amenities…
Taxation est. · year 1
- Rental income
- $14,566
- − Mortgage interest
- −$6,722
- − Property taxes
- −$2,729
- − Insurance
- −$600
- − Repairs & maintenance
- −$1,165
- − Management
- −$1,165
- − Depreciation
- −$3,491
- Taxable loss
- −$1,306
- Est. tax savings @ 24.0%
- +$313
- After-tax cash flow
- $940/yr
For passive investors: Depreciation is non-cash, so a rental often shows a tax loss while cash-flowing — sheltering income. Rental losses are passive: they offset passive income freely, and up to $25,000/yr can offset ordinary (W-2) income if you actively participate and your MAGI is under $100k (phasing out to $0 by $150k); unused losses carry forward. On sale, claimed depreciation is recaptured at up to 25%, and gains may owe capital-gains tax (a 1031 exchange can defer both). Figures are a year-1 estimate at your 24.0% rate — not tax advice; consult a CPA.
Schools (NCES district)
- District
- Houston ISD
- NCES district ID
- 4823640
- Math proficiency
- 27% ▼ -18.00%
- Reading proficiency
- 35% ▼ -6.00%
- Median HH income
- $46,054
- Composite
- 26.63/100
- National rank
- #7173
- State rank
- #593 of 826 in TX
Livability — Houston
- Score
- 74/100
- State rank
- #184
- US rank
- #4771
Category grades
Schools grade is shown separately in the Schools card above.
Census & demographics
- Census place
- Houston, TX
- County
- Harris County · 4,702,590 people
- City population
- 3,226,434
- Metro
- Houston-The Woodlands-Sugar Land, TX
- Population (ZIP)
- 21,981
- Household income
- $39,211
- Rent vs Own
- Severe rent burden
- 1531.0
Population outlook (Harris County) Hauer SSP2
- Today (2025)
- 5,571,493 people
- By 2030
- 6,089,821 · +9.3%
- By 2040
- 7,142,806 · +28.2%
- By 2050
- 8,185,864 · +46.9%
- By 2075
- 10,574,329 · +89.8%
- By 2100
- 12,109,958 · +117.4%
Race, ethnicity, and origin ACS 2023
- Neighborhood character
- Diverse neighborhood (Simpson 0.56)
- Race & ethnicity
- Black 49% Hispanic / Latino 44% Two or more races 18% White 5% Native American 1%
- Hispanic origin (detail)
- Mexican 34%
- Common ancestry
- Lithuanian 1%
- Foreign-born
- 15% · Canada
- Languages at home
- 61% English-only · Spanish 39%
Political lean MEDSL · Harris
- 2024 margin
- Lean D (+5.5) · D 52.0% · R 46.4% · Other 1.6%
- 2008→2024 swing
- +3.9pp toward D · 2008: 1.6pp · 2024: 5.5pp
- All cycles
- 2024: D+5.5 2020: D+13.3 2016: D+12.4 2012: D+0.1 2008: D+1.6
Not yet ingested
- Civics
- —
Market trends
- HPI YoY
- ▲ 3.89%
- Current HPI
- 267.5995
- Rent YoY
- ▲ 3.08%
- Metro
- Houston-The Woodlands-Sugar Land, TX
- State GDP YoY
- ▲ 3.95%
- F500 in state
- 110
Industry mix (Fortune 500 HQ in TX)
| Industry | F500 HQs | Revenue |
|---|---|---|
| Energy | 16 | $1,198B |
|
||
| Technology | 5 | $198B |
|
||
| Engineering / Construction | 4 | $72B |
|
||
| Energy Services | 3 | $60B |
|
||
| Utilities | 3 | $41B |
|
||
| Healthcare | 2 | $330B |
|
||
Price history
-20.0% since first listed10 events — show timeline
- 2026-04-09 Relisted — HARMLS
- 2026-04-03 Pending — HARMLS
- 2026-03-27 Listed $120,000 HARMLS
- 2026-02-15 Listing Removed — HARMLS
- 2025-11-17 Price Changed $120,000 HARMLS
- 2025-09-12 Price Changed $135,000 HARMLS
- 2025-08-14 Listed $149,999 HARMLS
- 2009-05-13 Sold (Public Records) — Public Records
- 2009-04-17 Sold (Public Records) — Public Records
- 1988-01-02 Sold (Public Records) — Public Records
Property tax history
+5.8%/yrLatest (2025): $2,729 · +4.5% YoY. Source: county tax records.
Cash-flow waterfall
monthlySold comps — $/sqft
last 12 mo · ≤1 miLoading sold comps…