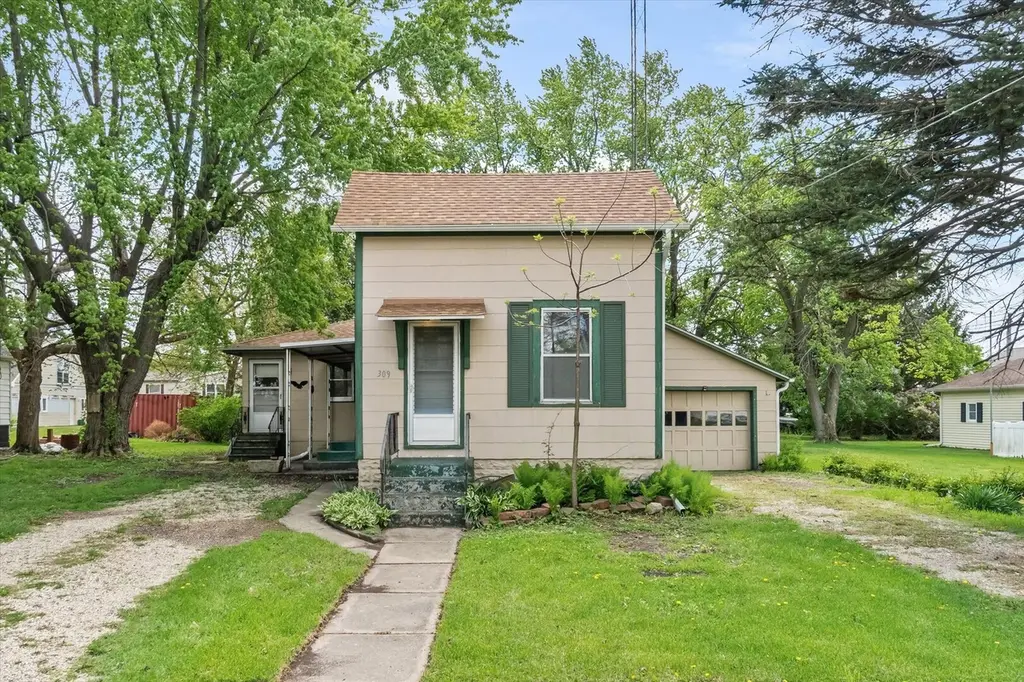
309 North St · Earlville, IL
Flood risk 1/10 · Minimal
- FEMA flood zone
- X (unshaded)
- Chance of flooding over 30 yrs
- 0.0%
- Est. flood insurance / yr
- $473 – $860
Fire risk 1/10 · Minimal
- Est. fire insurance / yr
- $804 – $1,492
Heat risk 3/10 · Minor
- Hot days now (above 102°F)
- 7 days/yr
- Hot days in 30 yrs
- 16 days/yr
Wind risk 2/10 · Minimal
- Chance of severe wind over 30 yrs
- 1.0%
Air-quality risk 3/10 · Minor
- Unhealthy air days now
- 1 days/yr
- Unhealthy air days in 30 yrs
- 3 days/yr
Risk factors via First Street. Map © Google.
Why this score? — see what drove the C+ grade
The composite is a weighted blend of 9 inputs, each scored 0–100. Each bar is that input's sub-score; the figure is the points it added to the 100-point composite (weight × sub-score).
- Cash flow +22.8/30.0
- ARV discount +12.1/15.0
- DSCR +7.3/10.0
- 1% rule +6.6/10.0
- Schools +3.3/10.0
- Livability +3.2/5.0
- Rent growth +2.5/5.0
- Condition / age +2.5/5.0
- Appreciation +0.0/10.0
$120,000
🖨 Deal sheet 📄 Offer letter ✓ Due diligence
Listing remarks
Investment Opportunity with Equity Potential! Charming 1908 ranch offering a great opportunity for first-time buyers, investors, or anyone looking to build equity. Features 1 bedroom with potential for a 2nd bedroom or flex space, 2 full baths, updated kitchen and bath areas, and a functional kitchen/dining layout. Recent improvements include a new roof (2023), garage door opener, refrigerator, washer, dryer, and patio canopy. The oversized 520 sq. ft. garage includes a wood-burning heater, making it ideal for a workshop or year-round use. Enjoy a covered side patio, mature trees for privacy, and additional storage with a Connex box. Bring your ideas and unlock this property's full poten
Key facts
- Wood burning heater
- Recent updates
- Flexible layout
Tags
Property features AI
Finance
- Other: Property not currently leased; Possession at closing
- HOA & community: No master association fee required; Community features include park, sidewalks, street lights, and paved streets
Exterior
- Parking: Attached garage (garage owned) with garage door opener; One garage space; Total of four parking spaces including driveway and off-street parking; Gravel and other parking areas
- Utilities: Public water; Public sewer
- Home design: Detached single-family home; One-story layout; Fee simple ownership; Built more than 100 years ago; Asphalt roof
- Construction: Other construction materials
- Exterior features: Patio; Mature trees; Level lot
Interior
- Kitchen: Eating area / table space; Range; Refrigerator
- Bedrooms: Master bedroom (main level); Additional bedrooms (possible extra bedroom/rooms listed)
- Flooring: Laminate in kitchen, dining area, and laundry; Carpet in living room and master bedroom
- Bathrooms: Two full bathrooms
- Heating & cooling: Steam heating; Baseboard heating; Window air conditioning units
- Interior features: Five total rooms; Whole-house fan; Crawl space basement
- Laundry & utility: Main-level laundry; Laundry closet; Gas dryer hookup; Washer; Dryer
Neighborhood map
What this means for you Summary
Snapshot
- This is a 1-bed/2.0-bath single-family listed at $120k.
Deal economics
- At list price, monthly cash flow is $210 ($3k/yr) — positive.
- The deal already cash-flows at list — no discount required.
- Meets the 1% rule at list price ($1k rent vs $120k).
- Recommended offer: $116k (3.0% below list) — sets the bar for market timing.
Location & tenants
- Location reads 63/100 on livability (#749 in IL) — a middle-class / working-renter tenant base. Strengths: cost of living A+, housing A+, crime A; Watch: health & safety C-, employment D, schools F.
- Earlville CUSD 9 (rural): math 30% / reading 40% proficiency, ranked #406 of 919 in IL (top 44%) — families likely to look elsewhere, expect single-tenant / working-renter base with shorter leases.
- Market conditions: 32 active listings in the ZIP; 82 units permitted in LaSalle County in 2024 (0 in 5+ unit buildings).
Forward outlook
- Local home prices are declining (-3.0%/yr); year-one equity from $830 of loan paydown is wiped out by about $4k of value loss. Plan a longer hold.
- LaSalle County population projected at -16% by 2050 — secular population decline; favor cash flow + early exit over multi-decade hold.
Negotiation context
- It's been on market 49 days — a 3% lower offer ($116k) is reasonable based on typical stale-listing flexibility.
- Current owner paid $52k; list at $120k implies a 131% gain — meaningful room to come down on a strong offer.
Risks & watch-outs
- Watch-outs: built in 1908 — expect roof / HVAC / electrical / plumbing capex.
Questions for the listing agent
- It's been on market 49 days. Have you received any prior offers? Is the seller open to a 3% concession, seller financing, or rate buy-down credit?
- Built in 1908 — when were the roof, HVAC, electrical panel, plumbing, and water heater last replaced?
- Is there a deadline driving the sale (1031 exchange, divorce, estate, relocation)? That informs how much negotiation room exists.
- Schools are F-rated, which usually means shorter tenancies and higher turnover. Who's the typical renter profile here, and what's been the actual vacancy rate?
- What's the average days-on-market for RENTAL listings here right now (not sales)? A rising rental-DOM trend means longer vacancies and softer asking-rent achievability than the comps imply.
- What's the recent tenant-quality profile in this submarket — average credit score on applications, eviction rate, late-payment / NSF rate, and stable-employment percentage? A property-management company in the area should have these aggregated.
- How much new for-sale + rental construction is in the pipeline within 1–3 miles? Heavy new supply typically softens prices + rents 12–24 months out; constrained supply supports both.
Investment metrics
- 1% rule
- 1.16% ✓
- Cap rate
- 8.39%
- Cash-on-cash
- 7.48%
- DSCR
- 1.33
- GRM
- 7.2
CMA / ARV
- ARV (median comp)
- $133,685
- List price
- $120,000
- Delta
- -10.24%
- Verdict
- UNDERPRICED
- Comps
- 13 within 1.0 mi
Show comp detail 1 sale within ~0.75 mi
| Address | Dist | Beds/Ba | Sqft | Sold | Price | $/sf | Match |
|---|---|---|---|---|---|---|---|
| 209 Oak St | 0.34mi | 2/1.5 (+1) | 1,100 (+7%) | 22mo | $141,000 | $128 | 46 |
Match score weights: distance 35% · size 25% · config 20% · recency 20%. Top-matched comps best support the ARV.
Projected returns pro-forma
-3.0% appreciation · 3.0% rent growth · sell at horizon
- IRR
- -4.8%
- Equity multiple
- 0.82×
- Total profit
- $-6,039
- Equity at exit
- $17,892
- IRR
- 4.9%
- Equity multiple
- 1.36×
- Total profit
- $12,171
- Equity at exit
- $10,375
Cash invested: $33,600 (down + closing). Projections, not guarantees.
Landlord ↔ Tenant lean methodology
- Overall (STATE)
- 43 Moderately Tenant-Leaning
- State Illinois
- 43 Moderately Tenant-Leaning · D+7
- County
- — inherits STATE
- City
- — inherits STATE
ZIP-level market 60518
- Home prices YoY
- -17.5%
- Active inventory
- 32
- Price-to-rent
- 7.2×
Monthly cashflow live
- Estimated rent
- $1,395 medium interval (Pro) →
- Mortgage (P&I)
- −$629
- Tax from tax record
- −$213 /mo · $2,556/yr
- Insurance
- −$50
- HOA
- −$0
- Vacancy / Maint / Mgmt
- −$293
- Net cashflow
- $210
Break-even live
UW: 25.0% down · 7.5% · 30yr · 1.5% tax · 5.0% vac · 8.0% maint · 8.0% mgmt
Financing live
Cash to close
- Down payment
- $30,000
- Closing costs
- $3,600
- Reserves months
- —
- Total cash needed
- —
Loan-product check · same deal, 3 products live
Conventional
25% down · 7.5% · 30yr
- Down + closing
- —
- Monthly P&I
- —
- Monthly cashflow
- —
- DSCR
- —
- Eligible?
- —
Personal DTI + credit; lowest rate.
DSCR
20% down · 8.5% · 30yr
- Down + closing
- —
- Monthly P&I
- —
- Monthly cashflow
- —
- DSCR
- —
- Eligible?
- —
No personal income docs; deal must DSCR.
Hard money
10% down · 12.0% · 12mo
- Down + closing
- —
- Monthly P&I
- —
- Monthly cashflow
- —
- DSCR
- —
- Eligible?
- —
Short-term bridge; refi at stabilization.
Listing history 18 events
-
2026-06-18days on market $120,000 Active 49 DOM
-
2026-06-17days on market $120,000 Active 48 DOM
-
2026-06-16days on market $120,000 Active 47 DOM
-
2026-06-15days on market $120,000 Active 46 DOM
-
2026-06-13days on market $120,000 Active 44 DOM
-
2026-06-12days on market $120,000 Active 43 DOM
-
2026-06-09days on market $120,000 Active 40 DOM
-
2026-06-09price $120,000 Active 39 DOM
-
2026-06-08days on market $135,000 Active 39 DOM
-
2026-06-07days on market $135,000 Active 38 DOM
-
2026-06-05days on market $135,000 Active 36 DOM
-
2026-06-04days on market $135,000 Active 34 DOM
-
2026-06-02days on market $135,000 Active 33 DOM
-
2026-06-01days on market $135,000 Active 32 DOM
-
2026-05-31days on market $135,000 Active 31 DOM
-
2026-05-31days on market $135,000 Active 30 DOM
-
2026-04-29$135,000 Active 1050-char remark
-
2008-10-24soldstatus $52,000
ⓘ Source: listings_history table (triggers on properties + properties_extension) + one-shot
backfill from property_details.listing_events for pre-trigger history.
Tax reassessment forecast IL · Partial reset (capped growth)
- Current annual tax
- $2,556 · $213/mo
- Projected year-2 tax
- $2,640 · $220/mo
- Expected delta
- +$84/yr (+$7/mo · 3.3%)
ⓘ Screening estimate from a state-policy table — verify with the county assessor before closing.
Climate risk First Street
- Flood 1/10 Low FEMA zone X (unshaded) · 0% chance over 30 yrs
- Wildfire 1/10 Low
- Heat 3/10 Moderate 7 d/yr ≥102°F today · 16 d/yr by 30 yrs out
- Wind 2/10 Low 100% chance of damaging wind over 30 yrs
- Air quality 3/10 Moderate 1 unhealthy d/yr today · 3 by 30 yrs out
Nearby sold comps map
Loading sold comps map…
Walkable amenities ~0.75 mi
Loading nearby amenities…
Taxation est. · year 1
- Rental income
- $16,737
- − Mortgage interest
- −$6,722
- − Property taxes
- −$2,556
- − Insurance
- −$600
- − Repairs & maintenance
- −$1,339
- − Management
- −$1,339
- − Depreciation
- −$3,491
- Taxable income
- $690
- Est. tax owed @ 24.0%
- −$166
- After-tax cash flow
- $2,349/yr
For passive investors: Depreciation is non-cash, so a rental often shows a tax loss while cash-flowing — sheltering income. Rental losses are passive: they offset passive income freely, and up to $25,000/yr can offset ordinary (W-2) income if you actively participate and your MAGI is under $100k (phasing out to $0 by $150k); unused losses carry forward. On sale, claimed depreciation is recaptured at up to 25%, and gains may owe capital-gains tax (a 1031 exchange can defer both). Figures are a year-1 estimate at your 24.0% rate — not tax advice; consult a CPA.
Schools (NCES district)
- District
- Earlville CUSD 9
- NCES district ID
- 1712930
- Math proficiency
- 30% ▼ -5.00%
- Reading proficiency
- 40% ▲ 16.00%
- Median HH income
- $49,735
- Composite
- 32.94/100
- National rank
- #10692
- State rank
- #406 of 919 in IL
Livability — Earlville
- Score
- 63/100
- State rank
- #749
- US rank
- #15219
Category grades
Schools grade is shown separately in the Schools card above.
Census & demographics
- Census place
- Earlville, IL
- Population (ZIP)
- 3,576
Population outlook (LaSalle County) Hauer SSP2
- Today (2025)
- 107,080 people
- By 2030
- 104,196 · -2.7%
- By 2040
- 97,413 · -9.0%
- By 2050
- 90,294 · -15.7%
- By 2075
- 76,252 · -28.8%
- By 2100
- 61,339 · -42.7%
Race, ethnicity, and origin ACS 2023
- Neighborhood character
- Predominantly White (83%)
- Race & ethnicity
- White 83% Hispanic / Latino 11% Two or more races 6%
- Hispanic origin (detail)
- Mexican 8% Puerto Rican 2%
- Common ancestry
- Portuguese 9% Lithuanian 5% Romanian 4%
- Foreign-born
- 4% · Canada
- Languages at home
- 92% English-only · Spanish 7% Russian/Polish/Slavic 1%
Political lean MEDSL · LaSalle
- 2024 margin
- R (+18.5) · D 40.1% · R 58.6% · Other 1.3%
- 2008→2024 swing
- -29.6pp toward R · 2008: 11.1pp · 2024: -18.5pp
- All cycles
- 2024: R+18.5 2020: R+14.3 2016: R+14.4 2012: R+0.4 2008: D+11.1
Not yet ingested
- Civics
- —
Market trends
- HPI YoY
- ▼ -40.43%
- Current HPI
- 190.6594
- Rent YoY
- —
- Metro
- —
- State GDP YoY
- ▲ 1.59%
- F500 in state
- 60
Industry mix (Fortune 500 HQ in IL)
| Industry | F500 HQs | Revenue |
|---|---|---|
| Insurance | 4 | $201B |
|
||
| Consumer Goods | 4 | $87B |
|
||
| Industrial Machinery | 3 | $64B |
|
||
| Healthcare | 2 | $55B |
|
||
| Retail / Pharmacy | 1 | $148B |
|
||
| Agriculture / Food | 1 | $86B |
|
||
Price history
+130.8% since first listed3 events — show timeline
- 2026-06-08 Price Changed $120,000 MRED as Distributed by MLS Grid
- 2026-04-29 Listed $135,000 MRED as Distributed by MLS Grid
- 2008-10-24 Sold (Public Records) $52,000 Public Records
Property tax history
+6.4%/yrLatest (2024): $2,556 · +9.2% YoY. Source: county tax records.
Cash-flow waterfall
monthlySold comps — $/sqft
last 12 mo · ≤1 miLoading sold comps…