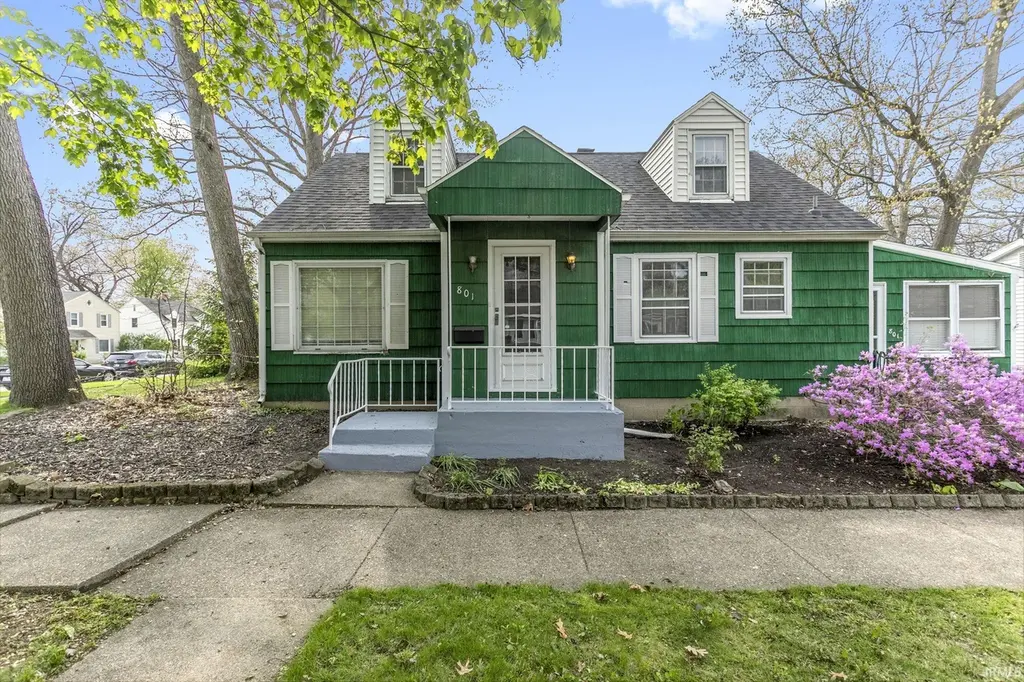
801 Webster St · Mishawaka, IN
Flood risk 1/10 · Minimal
- FEMA flood zone
- X (unshaded)
- Chance of flooding over 30 yrs
- 0.0%
- Est. flood insurance / yr
- $473 – $860
Fire risk 1/10 · Minimal
- Est. fire insurance / yr
- $717 – $1,331
Heat risk 2/10 · Minimal
- Hot days now (above 99°F)
- 7 days/yr
- Hot days in 30 yrs
- 15 days/yr
Wind risk 2/10 · Minimal
- Chance of severe wind over 30 yrs
- —
Air-quality risk 3/10 · Minor
- Unhealthy air days now
- 2 days/yr
- Unhealthy air days in 30 yrs
- 3 days/yr
Risk factors via First Street. Map © Google.
Why this score? — see what drove the D+ grade
The composite is a weighted blend of 9 inputs, each scored 0–100. Each bar is that input's sub-score; the figure is the points it added to the 100-point composite (weight × sub-score).
- Cash flow +16.9/30.0
- ARV discount +11.4/15.0
- DSCR +5.3/10.0
- 1% rule +3.8/10.0
- Rent growth +3.8/5.0
- Livability +3.8/5.0
- Condition / age +2.5/5.0
- Schools +2.2/10.0
- Appreciation +0.0/10.0
$199,000
🖨 Deal sheet (PDF) 📄 Offer letter ✓ Due diligence
Listing remarks
Charming 3 bedroom, 1 bathroom home in The Oaks with a newer roof , water heater and updated bathroom. Wonderful location within walking distance to the Mishawaka Riverwalk. This property features hardwood floors, tiled bathroom floor and shower, partially finished basement and a big two car garage. Don’t miss your chance to see this one!
Key facts
- 4,872 sq ft lot
- 2 garage spots
- Built 1949
Property features AI
Exterior
- Parking: Detached 2-car garage
- Utilities: Public water; Public sewer
- Home design: Single-family residence (site-built); One story
- Construction: Wood siding; Block foundation
- Exterior features: Corner lot; Lot dimensions approximately 42 x 116
Interior
- Bedrooms: Total of 6 rooms (bedroom count not specified)
- Flooring: Hardwood; Vinyl
- Bathrooms: 1 full bathroom (main level)
- Heating & cooling: Central air conditioning; Forced air heating
- Interior features: Hardwood and vinyl flooring; Full basement
- Laundry & utility: Laundry on lower level
Neighborhood map
What this means for you Summary
Snapshot
- This is a 3-bed/1.0-bath single-family listed at $199k.
Deal economics
- At list price, monthly cash flow is $133 ($2k/yr) — positive.
- The deal already cash-flows at list — no discount required.
- To meet the 1% rule (rent ≥ 1% of price), the offer needs to be $176k (11.8% below list).
- Recommended offer: $176k (11.8% below list) — sets the bar for 1% rule.
- Cap rate 7.1% vs local median 5.2% in Mishawaka — top-decile yield for the area; either an underpriced asset or a hidden risk that comps aren't pricing in. Stress-test before assuming the spread holds.
Location & tenants
- Location reads 76/100 on livability (#53 in IN, #3,586 nationally) — a middle-class / working-renter tenant base. Strengths: cost of living A+, housing A+, health & safety B; Watch: amenities F, employment F.
- School City Of Mishawaka (urban): math 23% / reading 30% proficiency, ranked #260 of 301 in IN (top 86%) — low school quality limits family demand, transient renter base, plan for 1-2y turnover.
- Zoned schools: Liberty Elementary School (math 23% / reading 22%, grade F, #788 of 994 statewide, top 79%, 417 students, 80% FRL); John J Young Middle School (math 17% / reading 30%, grade F, #257 of 330 statewide, top 79%, 735 students, 74% FRL); Mishawaka High School (math 24% / reading 60%, grade F, #197 of 369 statewide, top 57%, 1,488 students, 65% FRL) — zoned schools average 73% FRL vs 54% district-wide (19 pts higher); higher-poverty schools than district average — tighter screening recommended.
- Market conditions: Rents rising fast (+5.2%/yr); 77 active listings in the ZIP; 11 comparable units currently listed for rent nearby; rentals at typical pace (median 15d on market — plan ~3-4 weeks tenant-placement turnaround); 754 units permitted in St. Joseph County in 2024 (460 in 5+ unit buildings).
- This rent runs 37% of the median local income ($57k/yr) — at the standard rent-burdened threshold; future hikes will face affordability resistance.
Forward outlook
- Local home prices are declining (-3.0%/yr); year-one equity from $1k of loan paydown is wiped out by about $6k of value loss. Plan a longer hold.
Negotiation context
- It's been on market 27 days — a 2% lower offer ($196k) is reasonable based on typical stale-listing flexibility.
- 4 sale attempts since 9y ago; this cycle's ask has dropped $14k (7%) from the opening price — seller is motivated, your offer sets the floor, not the list.
- Current owner paid $112k; list at $199k implies a 78% gain — meaningful room to come down on a strong offer.
Risks & watch-outs
- Watch-outs: built in 1949 — expect roof / HVAC / electrical / plumbing capex.
Questions for the listing agent
- Built in 1949 — when were the roof, HVAC, electrical panel, plumbing, and water heater last replaced?
- Is there a deadline driving the sale (1031 exchange, divorce, estate, relocation)? That informs how much negotiation room exists.
- The area grade is low — what's the realistic commute time and amenity access for the typical tenant pool here? Any planned neighborhood developments (good or bad) we should know about?
- What's the average days-on-market for RENTAL listings here right now (not sales)? A rising rental-DOM trend means longer vacancies and softer asking-rent achievability than the comps imply.
- What's the recent tenant-quality profile in this submarket — average credit score on applications, eviction rate, late-payment / NSF rate, and stable-employment percentage? A property-management company in the area should have these aggregated.
- How much new for-sale + rental construction is in the pipeline within 1–3 miles? Heavy new supply typically softens prices + rents 12–24 months out; constrained supply supports both.
Investment metrics
- 1% rule
- 0.88% ✗
- Cap rate
- 7.09%
- Cash-on-cash
- 2.86%
- DSCR
- 1.13
- GRM
- 9.4
CMA / ARV
- ARV (on-the-fly)
- $217,728
- Comps found
- 12
Show comp detail 12 sales within ~0.75 mi
| Address | Dist | Beds/Ba | Sqft | Sold | Price | $/sf | Match |
|---|---|---|---|---|---|---|---|
| 801 Webster St | 0.00mi | 3/1.0 | 1,830 (+6%) | 1mo | $210,000 | $115 | 90 |
| 910 W Lawrence St | 0.01mi | 3/1.5 | 1,652 (-4%) | 4mo | $225,000 | $136 | 87 |
| 517 Forest Ave | 0.27mi | 3/1.5 | 1,537 (-11%) | 1mo | $215,000 | $140 | 66 |
| 522 Benton St | 0.24mi | 3/1.0 | 1,501 (-13%) | 2mo | $224,900 | $150 | 65 |
| 112 W Grove St | 0.63mi | 4/2.0 (+1) | 1,799 (+4%) | 2mo | $258,000 | $143 | 53 |
| 3401 Northside Blvd | 0.57mi | 3/2.0 | 1,860 (+8%) | 5mo | $233,950 | $126 | 52 |
| 946 S 28th St | 0.72mi | 4/2.0 (+1) | 1,680 (-3%) | 1mo | $220,000 | $131 | 52 |
| 134 W Battell St | 0.58mi | 3/1.0 | 1,496 (-13%) | 0mo | $172,500 | $115 | 50 |
| 701 W 3 St | 0.62mi | 3/2.0 | 1,870 (+8%) | 5mo | $185,000 | $99 | 50 |
| 806 32nd St | 0.43mi | 4/2.0 (+1) | 1,984 (+15%) | 4mo | $213,500 | $108 | 42 |
| 420 S 32nd St | 0.52mi | 2/2.0 (-1) | 1,964 (+14%) | 2mo | $200,500 | $102 | 42 |
| 109 E Battell St | 0.69mi | 3/1.5 | 1,476 (-15%) | 5mo | $175,000 | $119 | 38 |
Match score weights: distance 35% · size 25% · config 20% · recency 20%. Top-matched comps best support the ARV.
Projected returns pro-forma
-3.0% appreciation · 5.2% rent growth · sell at horizon
- IRR
- -9.6%
- Equity multiple
- 0.64×
- Total profit
- $-19,857
- Equity at exit
- $29,672
- IRR
- 2.4%
- Equity multiple
- 1.19×
- Total profit
- $10,462
- Equity at exit
- $17,206
Cash invested: $55,720 (down + closing). Projections, not guarantees.
Landlord ↔ Tenant lean methodology
- Overall (STATE)
- 90 Strongly Landlord-Friendly
- State Indiana
- 90 Strongly Landlord-Friendly · R+11
- County
- — inherits STATE
- City
- — inherits STATE
ZIP-level market 46545
- Rents YoY
- 5.2%
- Active inventory
- 77
- Price-to-rent
- 9.4×
Monthly cashflow live
- Estimated rent
- $1,755 high interval (Pro) →
- Mortgage (P&I)
- −$1,044
- Tax from tax record
- −$127 /mo · $1,529/yr
- Insurance
- −$83
- HOA
- −$0
- Vacancy / Maint / Mgmt
- −$369
- Net cashflow
- $133
Break-even live
Sensitivity live
| Price | -10% $246 | -5% $189 | +0% $133 | +5% $77 | +10% $20 |
|---|---|---|---|---|---|
| Rent | -10% $-6 | -5% $64 | +0% $133 | +5% $202 | +10% $272 |
| Rate | -1.0pp $233 | -0.5pp $184 | base $133 | +0.5pp $81 | +1.0pp $29 |
UW: 25.0% down · 7.5% · 30yr · 1.5% tax · 5.0% vac · 8.0% maint · 8.0% mgmt
Financing live
Cash to close
- Down payment
- $49,750
- Closing costs
- $5,970
- Reserves months
- —
- Total cash needed
- —
Loan-product check · same deal, 3 products live
Conventional
25% down · 7.5% · 30yr
- Down + closing
- —
- Monthly P&I
- —
- Monthly cashflow
- —
- DSCR
- —
- Eligible?
- —
Personal DTI + credit; lowest rate.
DSCR
20% down · 8.5% · 30yr
- Down + closing
- —
- Monthly P&I
- —
- Monthly cashflow
- —
- DSCR
- —
- Eligible?
- —
No personal income docs; deal must DSCR.
Hard money
10% down · 12.0% · 12mo
- Down + closing
- —
- Monthly P&I
- —
- Monthly cashflow
- —
- DSCR
- —
- Eligible?
- —
Short-term bridge; refi at stabilization.
Rent comps 11 comps
| Address | Beds | Baths | Sqft | Rent | $/sqft | DOM | Units | Dist |
|---|---|---|---|---|---|---|---|---|
| 931 S 34th St South Bend, IN | 3.0 | 1.5 | 1656 | $1,550 | $0.94 | 45d | 1 | 0.41mi |
| 116 W Mishawaka Ave Mishawaka, IN | 3.0 | 1.0–2.0 | 948 | $2,321 | $2.45 | 14d | 31 | 0.61mi |
| 365 W Front St Mishawaka, IN | 2.0 | 1.0–2.0 | 825 | $3,050 | $3.70 | 14d | 1 | 0.62mi |
| 211 Columbia St Mishawaka, IN | 4.0 | 2.5 | 1500 | $1,795 | $1.20 | 22d | 1 | 0.63mi |
| 3001 E Jefferson Blvd South Bend, IN | 1.0–2.0 | 1.0–2.0 | 848 | $1,329 | $1.57 | 14d | 21 | 0.64mi |
| 232 E Grove St Mishawaka, IN | 3.0 | 1.0 | 1188 | $1,500 | $1.26 | 14d | 1 | 0.82mi |
| 209 E Edgar Ave Mishawaka, IN | 3.0 | 1.0 | 1400 | $1,400 | $1.00 | 14d | 1 | 0.92mi |
| 819 S 24th St South Bend, IN | 3.0 | 2.0 | 1480 | $1,795 | $1.21 | 45d | 1 | 0.99mi |
| 507 Lincolnway E Unit 507 Mishawaka, IN | 2.0 | 1.0 | 1961 | $950 | $0.48 | 22d | 1 | 1.11mi |
| 1106 S 20th St South Bend, IN | 1.0–3.0 | 1.0–2.0 | 885 | $1,200 | $1.36 | 14d | 1 | 1.25mi |
| 117 Palau Ave Mishawaka, IN | 3.0 | 1.0 | 1100 | $1,650 | $1.50 | 14d | 1 | 1.43mi |
Listing history 9 events
-
2026-05-04historical Active Under Contract
-
2026-05-02price $199,000
-
2026-05-02$213,000 Active
-
2026-04-29historical $213,000
-
2025-01-20historical $1,295
-
2025-01-19$1,295
-
2021-10-01$152,000
-
2017-09-15soldstatus $112,000
-
2017-08-01$109,900
ⓘ Source: listings_history table (triggers on properties + properties_extension) + one-shot
backfill from property_details.listing_events for pre-trigger history.
Tax reassessment forecast IN · Partial reset (capped growth)
- Current annual tax
- $1,529 · $127/mo
- Projected year-2 tax
- $1,610 · $134/mo
- Expected delta
- +$81/yr (+$7/mo · 5.3%)
ⓘ Screening estimate from a state-policy table — verify with the county assessor before closing.
Climate risk First Street
- Flood 1/10 Low FEMA zone X (unshaded) · 0% chance over 30 yrs
- Wildfire 1/10 Low
- Heat 2/10 Low 7 d/yr ≥99°F today · 15 d/yr by 30 yrs out
- Wind 2/10 Low
- Air quality 3/10 Moderate 2 unhealthy d/yr today · 3 by 30 yrs out
Nearby sold comps map
Loading sold comps map…
Walkable amenities ~0.75 mi
Loading nearby amenities…
Taxation est. · year 1
- Rental income
- $21,066
- − Mortgage interest
- −$11,147
- − Property taxes
- −$1,529
- − Insurance
- −$995
- − Repairs & maintenance
- −$1,685
- − Management
- −$1,685
- − Depreciation
- −$5,789
- Taxable loss
- −$1,765
- Est. tax savings @ 24.0%
- +$424
- After-tax cash flow
- $2,019/yr
For passive investors: Depreciation is non-cash, so a rental often shows a tax loss while cash-flowing — sheltering income. Rental losses are passive: they offset passive income freely, and up to $25,000/yr can offset ordinary (W-2) income if you actively participate and your MAGI is under $100k (phasing out to $0 by $150k); unused losses carry forward. On sale, claimed depreciation is recaptured at up to 25%, and gains may owe capital-gains tax (a 1031 exchange can defer both). Figures are a year-1 estimate at your 24.0% rate — not tax advice; consult a CPA.
Schools (NCES district)
- District
- School City Of Mishawaka
- NCES district ID
- 1806840
- Math proficiency
- 23% ▼ -9.00%
- Reading proficiency
- 30% ▼ -7.00%
- Median HH income
- $39,290
- Composite
- 22.26/100
- National rank
- #8143
- State rank
- #260 of 301 in IN
Livability — Mishawaka
- Score
- 76/100
- State rank
- #53
- US rank
- #3586
Category grades
Schools grade is shown separately in the Schools card above.
Census & demographics
- Census place
- Mishawaka, IN
- County
- Saint Joseph County · 189,048 people
- City population
- 57,683
- Metro
- South Bend-Mishawaka, IN-MI
- Population (ZIP)
- 26,606
- Household income
- $56,865
- Rent vs Own
- Severe rent burden
- 1243.0
Population outlook (St. Joseph County) Hauer SSP2
- Today (2025)
- 273,186 people
- By 2030
- 273,594 · +0.1%
- By 2040
- 271,641 · -0.6%
- By 2050
- 269,187 · -1.5%
- By 2075
- 263,136 · -3.7%
- By 2100
- 245,659 · -10.1%
Race, ethnicity, and origin ACS 2023
- Neighborhood character
- Predominantly White (78%)
- Race & ethnicity
- White 78% Two or more races 8% Black 7% Hispanic / Latino 6% Asian 3%
- Hispanic origin (detail)
- Mexican 2%
- Common ancestry
- Romanian 6% Lithuanian 2% English 2%
- Foreign-born
- 8% · Canada, China, South Korea
- Languages at home
- 90% English-only · Spanish 4% Chinese 1% Other Indo-European 1%
Political lean MEDSL · St. Joseph
- 2024 margin
- Toss-up / Even · D 50.0% · R 48.5% · Other 1.5%
- 2008→2024 swing
- -15.6pp toward R · 2008: 17.1pp · 2024: 1.5pp
- All cycles
- 2024: D+1.5 2020: D+5.8 2016: D+0.2 2012: D+3.5 2008: D+17.1
Not yet ingested
- Civics
- —
Market trends
- HPI YoY
- ▼ -114.83%
- Current HPI
- 188.2811
- Rent YoY
- ▲ 5.20%
- Metro
- South Bend-Mishawaka, IN-MI
- State GDP YoY
- ▲ 2.90%
- F500 in state
- 18
Industry mix (Fortune 500 HQ in IN)
| Industry | F500 HQs | Revenue |
|---|---|---|
| Industrial Machinery | 2 | $37B |
|
||
| Healthcare | 1 | $177B |
|
||
| Pharmaceuticals | 1 | $45B |
|
||
| Metals / Steel | 1 | $18B |
|
||
| Agriculture | 1 | $17B |
|
||
| Packaging | 1 | $12B |
|
||
Price history
+81.1% since first listed9 events — show timeline
- 2026-05-04 Contingent — IRMLS
- 2026-05-02 Price Changed $199,000 IRMLS
- 2026-05-02 Listed $213,000 IRMLS
- 2026-04-29 Coming Soon $213,000 IRMLS
- 2025-01-20 Rental Removed $1,295 CONNECTLINX
- 2025-01-19 Listed for Rent $1,295 CONNECTLINX
- 2021-10-01 Listed $152,000 IRMLS
- 2017-09-15 Sold (MLS) $112,000 IRMLS
- 2017-08-01 Listed $109,900 IRMLS
Property tax history
+1.3%/yrLatest (2023): $1,529 · -0.8% YoY. Source: county tax records.
Cash-flow waterfall
monthlySold comps — $/sqft
last 12 mo · ≤1 miLoading sold comps…