3193 Timberwild · West Tawakoni, TX
Flood risk 1/10 · Minimal
- FEMA flood zone
- X (unshaded)
- Chance of flooding over 30 yrs
- 0.0%
- Est. flood insurance / yr
- $507 – $1,088
Fire risk 2/10 · Minimal
- Est. fire insurance / yr
- $1,222 – $2,270
Heat risk 7/10 · Major
- Hot days now (above 111°F)
- 7 days/yr
- Hot days in 30 yrs
- 23 days/yr
Wind risk 6/10 · Moderate
- Chance of severe wind over 30 yrs
- 27.0%
Air-quality risk 2/10 · Minimal
- Unhealthy air days now
- 0 days/yr
- Unhealthy air days in 30 yrs
- 1 days/yr
Risk factors via First Street. Map © Google.
Why this score? — see what drove the C- grade
The composite is a weighted blend of 9 inputs, each scored 0–100. Each bar is that input's sub-score; the figure is the points it added to the 100-point composite (weight × sub-score).
- Cash flow +21.9/30.0
- ARV discount +8.0/15.0
- DSCR +7.0/10.0
- 1% rule +5.1/10.0
- Condition / age +4.0/5.0
- Livability +2.8/5.0
- Schools +2.6/10.0
- Rent growth +2.5/5.0
- Appreciation +0.0/10.0
$149,000
🖨 Deal sheet 📄 Offer letter ✓ Due diligence
Listing remarks MLS
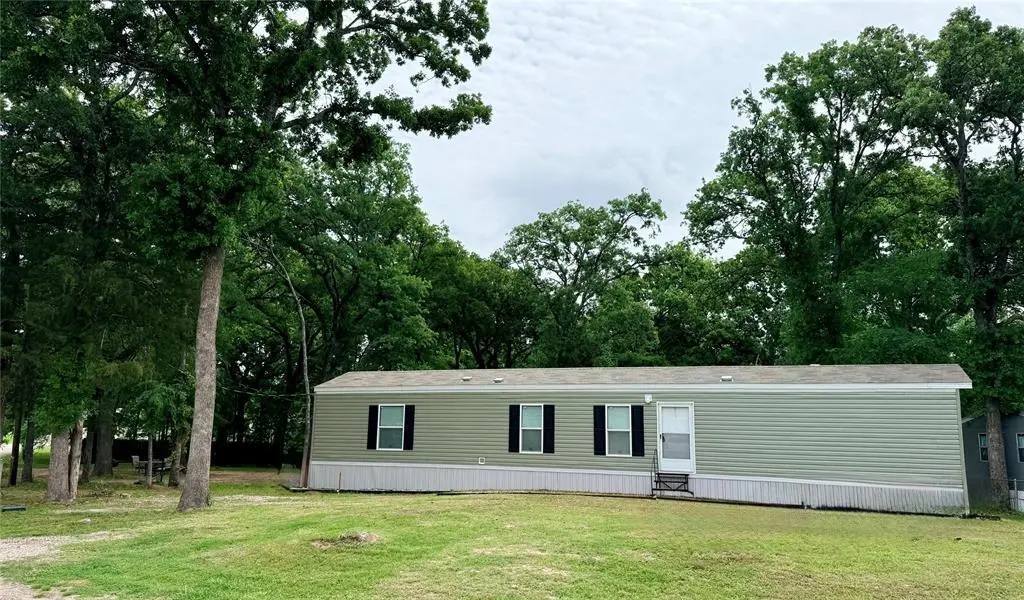
2024 Singlewide manufactured home. Come see this 3 bed 2 bath home on a third of an acre. This home is located in a quiet lakeside community with a private park and boat launch. Access to beautiful Lake Tawakoni is at your disposal. The home has never been lived in and awaits your creativity to make it your own. Brinwood Shores is one of the best well-kept subdivisions on Lake Tawakoni. Super low HOA and quiet neighbors make it a great place for all residents. Mature trees create a bird sanctuary for so many birds that fill the air with sounds of nature. Information provided in this listing to be verified by buyer and buyer's agent. No written or expressed guarantees made herein.
Key facts
- Boat launch
- Lakeside community
- Private park
Tags
Neighborhood map
What this means for you Summary
Snapshot
- This is a 3-bed/2.0-bath manufactured listed at $149k. Condition is rated good.
Deal economics
- At list price, monthly cash flow is $235 ($3k/yr) — positive.
- The deal already cash-flows at list — no discount required.
- Meets the 1% rule at list price ($2k rent vs $149k).
- Recommended offer: $140k (6.0% below list) — sets the bar for market timing.
- Cap rate 8.2% vs local median 4.6% in West Tawakoni — top-decile yield for the area; either an underpriced asset or a hidden risk that comps aren't pricing in. Stress-test before assuming the spread holds.
Location & tenants
- Location reads 56/100 on livability (#1,337 in TX) — a working-class tenant base; expect higher turnover. Strengths: cost of living A+, housing A+, crime A-; Watch: schools F, amenities F, commute F.
- Quinlan ISD (rural): math 27% / reading 34% proficiency, ranked #610 of 826 in TX (top 74%) — families likely to look elsewhere, expect single-tenant / working-renter base with shorter leases.
- Market conditions: 284 active listings in the ZIP; 1 comparable units currently listed for rent nearby; 1,289 units permitted in Hunt County in 2024 (527 in 5+ unit buildings).
Forward outlook
- Local home prices are declining (-3.0%/yr); year-one equity from $1k of loan paydown is wiped out by about $4k of value loss. Plan a longer hold.
- Hunt County population projected at +15% by 2050 — modest demand growth; plan on rents tracking national, not racing it.
Negotiation context
- It's been on market 63 days — a 6% lower offer ($140k) is reasonable based on typical stale-listing flexibility.
Risks & watch-outs
- Climate carrying-cost: major wind risk, 27% chance of damaging wind over 30y; extreme-heat days projected 7→23/yr by 2055 (HVAC capex compounding) — expect insurance premiums to compound above CPI over the hold.
Questions for the listing agent
- It's been on market 63 days. Have you received any prior offers? Is the seller open to a 6% concession, seller financing, or rate buy-down credit?
- What does the HOA fee cover, when was the last increase, and are there any pending special assessments or reserve-fund shortfalls?
- Why hasn't it sold? Are there any deal-killer items the seller is aware of (foundation, flood, title, zoning, code violations)?
- Is there a deadline driving the sale (1031 exchange, divorce, estate, relocation)? That informs how much negotiation room exists.
- Schools are F-rated, which usually means shorter tenancies and higher turnover. Who's the typical renter profile here, and what's been the actual vacancy rate?
- What's the average days-on-market for RENTAL listings here right now (not sales)? A rising rental-DOM trend means longer vacancies and softer asking-rent achievability than the comps imply.
- What's the recent tenant-quality profile in this submarket — average credit score on applications, eviction rate, late-payment / NSF rate, and stable-employment percentage? A property-management company in the area should have these aggregated.
- How much new for-sale + rental construction is in the pipeline within 1–3 miles? Heavy new supply typically softens prices + rents 12–24 months out; constrained supply supports both.
Investment metrics
- 1% rule
- 1.01% ✓
- Cap rate
- 8.18%
- Cash-on-cash
- 6.75%
- DSCR
- 1.30
- GRM
- 8.3
CMA / ARV
- ARV (median comp)
- $150,772
- List price
- $149,000
- Delta
- -1.18%
- Verdict
- FAIR
- Comps
- 10 within 1.0 mi
Show comp detail 2 sales within ~0.75 mi
| Address | Dist | Beds/Ba | Sqft | Sold | Price | $/sf | Match |
|---|---|---|---|---|---|---|---|
| 3136 Post Oak Trl | 0.07mi | 3/2.0 | 924 (0%) | 19mo | $115,000 | $124 | 81 |
| 3183 Timberwild | 0.05mi | 3/2.0 | 896 (-3%) | 21mo | $150,000 | $167 | 75 |
Match score weights: distance 35% · size 25% · config 20% · recency 20%. Top-matched comps best support the ARV.
Projected returns pro-forma
-3.0% appreciation · 3.0% rent growth · sell at horizon
- IRR
- -6.0%
- Equity multiple
- 0.78×
- Total profit
- $-9,226
- Equity at exit
- $22,216
- IRR
- 3.7%
- Equity multiple
- 1.27×
- Total profit
- $11,103
- Equity at exit
- $12,883
Cash invested: $41,720 (down + closing). Projections, not guarantees.
Landlord ↔ Tenant lean methodology
- Overall (STATE)
- 87 Strongly Landlord-Friendly
- State Texas
- 87 Strongly Landlord-Friendly · R+5
- County
- — inherits STATE
- City
- — inherits STATE
ZIP-level market 75169
- Home prices YoY
- -15.4%
- Active inventory
- 284
- Price-to-rent
- 8.3×
Monthly cashflow live
- Estimated rent
- $1,500 medium interval (Pro) →
- Mortgage (P&I)
- −$781
- Tax from tax record
- −$99 /mo · $1,187/yr
- Insurance
- −$62
- HOA
- −$8
- Vacancy / Maint / Mgmt
- −$315
- Net cashflow
- $235
Break-even live
UW: 25.0% down · 7.5% · 30yr · 1.5% tax · 5.0% vac · 8.0% maint · 8.0% mgmt
Financing live
Cash to close
- Down payment
- $37,250
- Closing costs
- $4,470
- Reserves months
- —
- Total cash needed
- —
Loan-product check · same deal, 3 products live
Conventional
25% down · 7.5% · 30yr
- Down + closing
- —
- Monthly P&I
- —
- Monthly cashflow
- —
- DSCR
- —
- Eligible?
- —
Personal DTI + credit; lowest rate.
DSCR
20% down · 8.5% · 30yr
- Down + closing
- —
- Monthly P&I
- —
- Monthly cashflow
- —
- DSCR
- —
- Eligible?
- —
No personal income docs; deal must DSCR.
Hard money
10% down · 12.0% · 12mo
- Down + closing
- —
- Monthly P&I
- —
- Monthly cashflow
- —
- DSCR
- —
- Eligible?
- —
Short-term bridge; refi at stabilization.
Rent comps 1 comps
| Address | Beds | Baths | Sqft | Rent | $/sqft | DOM | Units | Dist |
|---|---|---|---|---|---|---|---|---|
| 10481 Private Road 3709 #11 Wills Point, TX | 2.0 | 2.0 | 930 | $1,500 | $1.61 | 1d | 1 | 0.79mi |
HOA detail
- Monthly dues
- $8 · $96/yr
Listing history 15 events
-
2026-06-18days on market $149,000 Active 63 DOM
-
2026-06-17days on market $149,000 Active 62 DOM
-
2026-06-16days on market $149,000 Active 61 DOM
-
2026-06-15days on market $149,000 Active 60 DOM
-
2026-06-13days on market $149,000 Active 58 DOM
-
2026-06-09days on market $149,000 Active 54 DOM
-
2026-06-08days on market $149,000 Active 53 DOM
-
2026-06-07days on market $149,000 Active 52 DOM
-
2026-06-04days on market $149,000 Active 49 DOM
-
2026-06-03days on market $149,000 Active 48 DOM
-
2026-06-02days on market $149,000 Active 47 DOM
-
2026-06-01days on market $149,000 Active 46 DOM
-
2026-05-31days on market $149,000 Active 45 DOM
-
2026-04-29price $149,000 691-char remark
Show marketing remark (691 chars)
2024 Singlewide manufactured home. Come see this 3 bed 2 bath home on a third of an acre. This home is located in a quiet lakeside community with a private park and boat launch. Access to beautiful Lake Tawakoni is at your disposal. The home has never been lived in and awaits your creativity to make it your own. Brinwood Shores is one of the best well-kept subdivisions on Lake Tawakoni. Super low HOA and quiet neighbors make it a great place for all residents. Mature trees create a bird sanctuary for so many birds that fill the air with sounds of nature. Information provided in this listing to be verified by buyer and buyer's agent. No written or expressed guarantees made herein.
-
2026-04-16$155,000 Active 691-char remark
Show marketing remark (691 chars)
2024 Singlewide manufactured home. Come see this 3 bed 2 bath home on a third of an acre. This home is located in a quiet lakeside community with a private park and boat launch. Access to beautiful Lake Tawakoni is at your disposal. The home has never been lived in and awaits your creativity to make it your own. Brinwood Shores is one of the best well-kept subdivisions on Lake Tawakoni. Super low HOA and quiet neighbors make it a great place for all residents. Mature trees create a bird sanctuary for so many birds that fill the air with sounds of nature. Information provided in this listing to be verified by buyer and buyer's agent. No written or expressed guarantees made herein.
ⓘ Source: listings_history table (triggers on properties + properties_extension) + one-shot
backfill from property_details.listing_events for pre-trigger history.
Tax reassessment forecast TX · Resets to sale price
- Current annual tax
- $1,187 · $99/mo
- Projected year-2 tax
- $2,727 · $227/mo
- Expected delta
- +$1,540/yr (+$128/mo · 129.7%)
ⓘ Screening estimate from a state-policy table — verify with the county assessor before closing.
Climate risk First Street
- Flood 1/10 Low FEMA zone X (unshaded) · 0% chance over 30 yrs
- Wildfire 2/10 Low
- Heat 7/10 Severe 7 d/yr ≥111°F today · 23 d/yr by 30 yrs out
- Wind 6/10 Major 27% chance of damaging wind over 30 yrs
- Air quality 2/10 Low 0 unhealthy d/yr today · 1 by 30 yrs out
Nearby sold comps map
Loading sold comps map…
Walkable amenities ~0.75 mi
Loading nearby amenities…
Taxation est. · year 1
- Rental income
- $18,000
- − Mortgage interest
- −$8,346
- − Property taxes
- −$1,187
- − Insurance
- −$745
- − Repairs & maintenance
- −$1,440
- − Management
- −$1,440
- − HOA
- −$96
- − Depreciation
- −$4,335
- Taxable income
- $411
- Est. tax owed @ 24.0%
- −$99
- After-tax cash flow
- $2,717/yr
For passive investors: Depreciation is non-cash, so a rental often shows a tax loss while cash-flowing — sheltering income. Rental losses are passive: they offset passive income freely, and up to $25,000/yr can offset ordinary (W-2) income if you actively participate and your MAGI is under $100k (phasing out to $0 by $150k); unused losses carry forward. On sale, claimed depreciation is recaptured at up to 25%, and gains may owe capital-gains tax (a 1031 exchange can defer both). Figures are a year-1 estimate at your 24.0% rate — not tax advice; consult a CPA.
Condition & rehab AI · 12 photos
This 2024 singlewide manufactured home is in excellent condition with modern finishes and a quiet lakeside location. It is move-in ready and offers a great opportunity for investment.
Value-add opportunities
- Both Painting the exterior siding — Enhances curb appeal and can increase both resale and rental value.
- Both Landscaping improvements — Enhances curb appeal and can increase both resale and rental value.
- Both Adding a front porch or patio — Can increase both resale and rental value by providing outdoor living space and enhancing curb appeal.
Renovation cost estimate screening
Value-add ROI direction
- Both Painting the exterior siding — Enhances curb appeal and can increase both resale and rental value. ↑
- Both Landscaping improvements — Enhances curb appeal and can increase both resale and rental value. ↑
- Both Adding a front porch or patio — Can increase both resale and rental value by providing outdoor living space and enhancing curb appeal. ↑
ⓘ Cost ranges are severity-bucket heuristics (US national rule-of-thumb). Get contractor quotes + a written scope before underwriting a rehab budget.
Schools (NCES district)
- District
- Quinlan ISD
- NCES district ID
- 4836240
- Math proficiency
- 27% ▼ -10.00%
- Reading proficiency
- 34% ▼ -2.00%
- Median HH income
- $45,461
- Composite
- 26.16/100
- National rank
- #7271
- State rank
- #610 of 826 in TX
Livability — West Tawakoni
- Score
- 56/100
- State rank
- #1337
- US rank
- #23022
Category grades
Schools grade is shown separately in the Schools card above.
Census & demographics
- Population (ZIP)
- 15,744
Population outlook (Hunt County) Hauer SSP2
- Today (2025)
- 97,090 people
- By 2030
- 100,452 · +3.5%
- By 2040
- 106,544 · +9.7%
- By 2050
- 111,218 · +14.6%
- By 2075
- 121,695 · +25.3%
- By 2100
- 123,683 · +27.4%
Race, ethnicity, and origin ACS 2023
- Neighborhood character
- Predominantly White (78%)
- Race & ethnicity
- White 78% Hispanic / Latino 15% Two or more races 7% Black 4%
- Hispanic origin (detail)
- Mexican 15%
- Common ancestry
- Slovak 2% Italian 1% Lithuanian 1%
- Foreign-born
- 4% · Canada
- Languages at home
- 92% English-only · Spanish 8%
Political lean MEDSL · Hunt
- 2024 margin
- Solid R (+55.5) · D 21.9% · R 77.4%
- 2008→2024 swing
- -14.9pp toward R · 2008: -40.6pp · 2024: -55.5pp
- All cycles
- 2024: R+55.5 2020: R+52.5 2016: R+56.3 2012: R+51.2 2008: R+40.6
Not yet ingested
- Civics
- —
Market trends
- HPI YoY
- ▼ -45.68%
- Current HPI
- 250.2271
- Rent YoY
- —
- Metro
- —
- State GDP YoY
- ▲ 3.95%
- F500 in state
- 110
Industry mix (Fortune 500 HQ in TX)
| Industry | F500 HQs | Revenue |
|---|---|---|
| Energy | 16 | $1,198B |
|
||
| Technology | 5 | $198B |
|
||
| Engineering / Construction | 4 | $72B |
|
||
| Energy Services | 3 | $60B |
|
||
| Utilities | 3 | $41B |
|
||
| Healthcare | 2 | $330B |
|
||
Price history
-3.9% since first listed2 events — show timeline
- 2026-04-29 Price Changed $149,000 NTREIS
- 2026-04-16 Listed $155,000 NTREIS
Cash-flow waterfall
monthlySold comps — $/sqft
last 12 mo · ≤1 miLoading sold comps…