 Multi-family
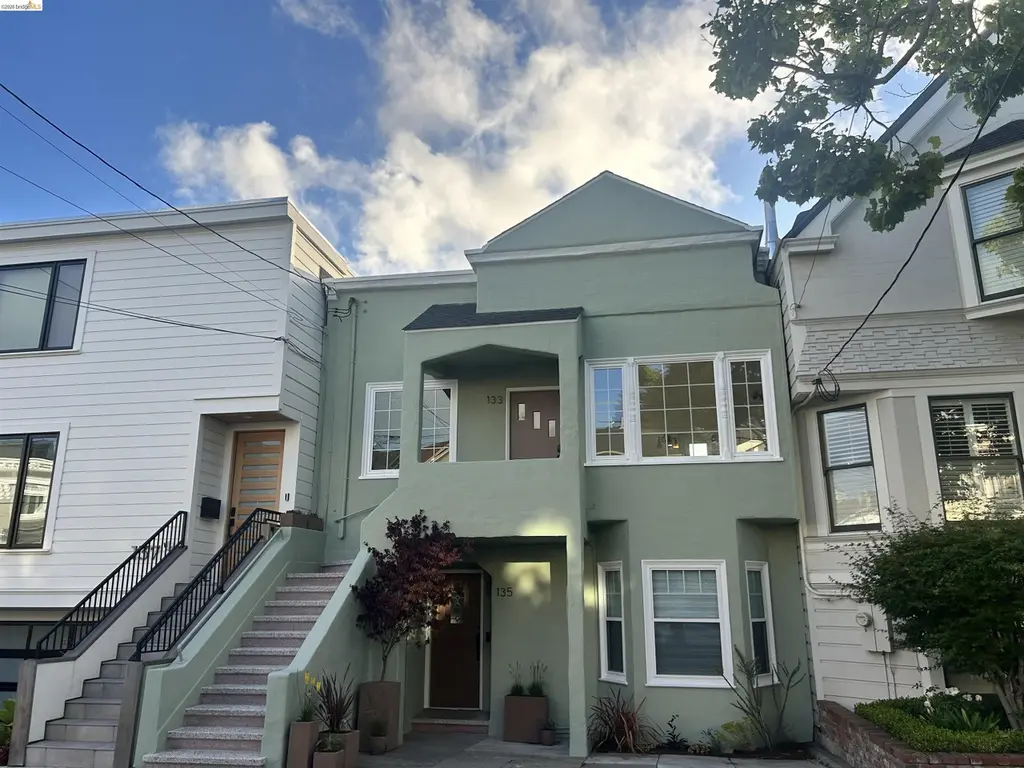
133-135 11th Ave · San Francisco, CA
Flood risk 1/10 · Minimal
- FEMA flood zone
- X (unshaded)
- Chance of flooding over 30 yrs
- 0.0%
- Est. flood insurance / yr
- $507 – $1,088
Fire risk 2/10 · Minimal
- Est. fire insurance / yr
- $659 – $1,223
Heat risk 2/10 · Minimal
- Hot days now (above 78°F)
- 7 days/yr
- Hot days in 30 yrs
- 17 days/yr
Wind risk 1/10 · Minimal
- Chance of severe wind over 30 yrs
- —
Air-quality risk 7/10 · Major
- Unhealthy air days now
- 13 days/yr
- Unhealthy air days in 30 yrs
- 13 days/yr
Risk factors via First Street. Map © Google.
Why this score? — see what drove the C grade
The composite is a weighted blend of 9 inputs, each scored 0–100. Each bar is that input's sub-score; the figure is the points it added to the 100-point composite (weight × sub-score).
- ARV discount +14.7/15.0
- Cash flow +12.1/30.0
- Appreciation +9.0/10.0
- Rent growth +5.0/5.0
- Schools +5.0/10.0
- Livability +3.8/5.0
- DSCR +3.6/10.0
- Condition / age +2.5/5.0
- 1% rule +2.3/10.0
$1,245,000
🖨 Deal sheet 📄 Offer letter ✓ Due diligence
Multi-family units
County records classify this as Multi-Family (2-4 Unit). Listing-text estimate: 1 unit. estimate disagrees with records
Listing remarks
First time on the market in generations, 133–135 11th Avenue offers a rare opportunity to step into a vacant two-unit property tucked between Lake Street and California Street in one of San Francisco’s most beloved residential neighborhoods. Filled with natural light, warmth, and possibility, the property has been thoughtfully prepared to create a clear and welcoming experience for buyers. Extensive cleaning, inspections, and targeted improvements have already been completed, allowing the next owner to walk through the home with a strong sense of openness, transparency, and opportunity. The interiors offer generous scale, classic character, and an inviting atmosphere that feels
Key facts
- 3,000 sq ft lot
- Built 1902
- Listed 9 days
Property features AI
Finance
- Financial info: Two-unit property (2 total units)
Exterior
- Parking: No garage
- Utilities: Public water; Public sewer; Separate electric and gas meters
- Home design: Duplex (residential income); Built in 1902
- Construction: Stucco and other siding
- Exterior features: Back yard; Front yard; Outdoor storage
Interior
- Flooring: Hardwood flooring; Laminate flooring; Tile flooring
- Bathrooms: Unit 1: 1 bathroom; Unit 2: 1 bathroom
- Heating & cooling: Heating present (multi-unit system); No air conditioning
- Interior features: Shower stall(s)
- Laundry & utility: Washer and dryer available; Washer/dryer hookups; Gas dryer hookup
Neighborhood map
What this means for you Summary
Snapshot
- This is a 3-bed/2.0-bath multifamily listed at $1.25M.
Deal economics
- At list price, monthly cash flow is $-282 ($-3k/yr) — negative.
- To cash-flow at today's rent, offer at most $1.20M (4.0% below list).
- To meet the 1% rule (rent ≥ 1% of price), the offer needs to be $914k (26.6% below list).
- Recommended offer: $914k (26.6% below list) — sets the bar for 1% rule.
- Cap rate 6.0% vs local median 2.1% in San Francisco — top-decile yield for the area; either an underpriced asset or a hidden risk that comps aren't pricing in. Stress-test before assuming the spread holds.
Location & tenants
- Location reads 76/100 on livability (#90 in CA, #3,143 nationally) — a middle-class / working-renter tenant base. Strengths: amenities A+, commute A+, employment A+; Watch: crime F, cost of living F.
- San Francisco Unified (urban): math 50% / reading 56% proficiency, ranked #322 of 1,400 in CA (top 23%) — acceptable for families but not a draw, mixed tenant base, ~2y average lease.
- Market conditions: Rents rising fast (+17.1%/yr); 50 active listings in the ZIP; 18 comparable units currently listed for rent nearby; rentals at typical pace (median 24d on market — plan ~3-4 weeks tenant-placement turnaround); 44% of comp listings sitting > 30 days — soft ceiling on asking rent; high-income renter base; 750 units permitted in San Francisco County in 2024 (688 in 5+ unit buildings).
- At $9,144/mo this rent would consume 67% of the median local household income ($164k/yr) (locally 1780% of renters already pay >50% of income on rent) — very limited rent-growth headroom before tenants either downsize or default.
Forward outlook
- In year one you build about $107k of equity ($9k loan paydown + $99k appreciation (7.9% local appreciation)).
- San Francisco County population projected at +39% by 2050 — long-run rental-demand tailwind backs the buy-and-hold thesis.
- By year 2, paydown + projected appreciation supports a ~$172k cash-out refi (75% LTV) — recoverable capital for the next deal without selling this one.
Negotiation context
- Only 9 days on market — expect competitive offers; lowballing is unlikely to land.
Risks & watch-outs
- Watch-outs: built in 1902 — expect roof / HVAC / electrical / plumbing capex.
Questions for the listing agent
- What do current leases actually rent for vs. the listed asking? Can we see a recent rent roll and the last 12 months of T-12 income?
- Built in 1902 — when were the roof, HVAC, electrical panel, plumbing, and water heater last replaced?
- Is there a deadline driving the sale (1031 exchange, divorce, estate, relocation)? That informs how much negotiation room exists.
- Schools are B-rated — typically a magnet for longer-tenancy family renters. What's the average tenant stay here, and is there a school-zone premium baked into asking?
- Crime grade is F in this area — have there been break-ins, vandalism, or insurance claims at this property in the last 3 years? What carrier currently insures it and at what premium?
- What's the average days-on-market for RENTAL listings here right now (not sales)? A rising rental-DOM trend means longer vacancies and softer asking-rent achievability than the comps imply.
- What's the recent tenant-quality profile in this submarket — average credit score on applications, eviction rate, late-payment / NSF rate, and stable-employment percentage? A property-management company in the area should have these aggregated.
- How much new apartment / multifamily construction is in the pipeline within 1–3 miles? Heavy new supply (>2% of stock underway) typically softens rents 12–24 months out; light construction supports rent growth.
Investment metrics
- 1% rule
- 0.73% ✗
- Cap rate
- 6.02%
- Cash-on-cash
- -0.97%
- DSCR
- 0.96
- GRM
- 11.3
CMA / ARV
- ARV (on-the-fly)
- $1,481,108
- Comps found
- 5
Show comp detail 5 sales within ~0.75 mi
| Address | Dist | Beds/Ba | Sqft | Sold | Price | $/sf | Match |
|---|---|---|---|---|---|---|---|
| 133-135 11th Ave | 0.00mi | 3/2.0 | 1,894 (0%) | 1mo | $2,300,000 | $1,214 | 100 |
| 334-336 4th Ave | 0.51mi | 4/2.0 (+1) | 1,940 (+2%) | 3mo | $1,500,000 | $773 | 65 |
| 129-131 2nd Ave | 0.53mi | 3/2.0 | 2,046 (+8%) | 4mo | $1,600,000 | $782 | 59 |
| 474 2nd Ave | 0.71mi | 4/3.0 (+1) | 1,850 (-2%) | 6mo | $1,700,000 | $919 | 49 |
| 607-609 15th Ave | 0.67mi | 4/2.0 (+1) | 1,780 (-6%) | 7mo | $1,050,000 | $590 | 48 |
Match score weights: distance 35% · size 25% · config 20% · recency 20%. Top-matched comps best support the ARV.
Projected returns pro-forma
7.92% appreciation · 8.0% rent growth · sell at horizon
- IRR
- 20.7%
- Equity multiple
- 2.54×
- Total profit
- $536,171
- Equity at exit
- $938,923
- IRR
- 20.5%
- Equity multiple
- 5.85×
- Total profit
- $1,689,480
- Equity at exit
- $1,857,174
Cash invested: $348,600 (down + closing). Projections, not guarantees.
Landlord ↔ Tenant lean methodology
- Overall (CITY)
- 0 Strongly Tenant-Friendly
- State California
- 18 Strongly Tenant-Friendly · D+13
- County
- — inherits STATE
- City San Francisco
- 0 Strongly Tenant-Friendly · D+57
ZIP-level market 94118
- Home prices YoY
- 3.3%
- Rents YoY
- 17.1%
- Active inventory
- 50
- Price-to-rent
- 22.7×
Monthly cashflow live
- Estimated rent
- $9,144 high interval (Pro) →
- Mortgage (P&I)
- −$6,529
- Tax from tax record
- −$458 /mo · $5,498/yr
- Insurance
- −$519
- HOA
- −$0
- Vacancy / Maint / Mgmt
- −$1,920
- Net cashflow
- $-282
Break-even live
2-unit breakdown (identical units grouped — click to expand)
| Units | Beds | Baths | Est. rent |
|---|---|---|---|
| 2× units | 2 | 1 | $9,144 |
| #1 | 2 | 1 | $4,572 |
| #2 | 2 | 1 | $4,572 |
| Total (2 units) | $9,144 | ||
UW: 25.0% down · 7.5% · 30yr · 1.5% tax · 5.0% vac · 8.0% maint · 8.0% mgmt
Financing live
Cash to close
- Down payment
- $311,250
- Closing costs
- $37,350
- Reserves months
- —
- Total cash needed
- —
Loan-product check · same deal, 3 products live
Conventional
25% down · 7.5% · 30yr
- Down + closing
- —
- Monthly P&I
- —
- Monthly cashflow
- —
- DSCR
- —
- Eligible?
- —
Personal DTI + credit; lowest rate.
DSCR
20% down · 8.5% · 30yr
- Down + closing
- —
- Monthly P&I
- —
- Monthly cashflow
- —
- DSCR
- —
- Eligible?
- —
No personal income docs; deal must DSCR.
Hard money
10% down · 12.0% · 12mo
- Down + closing
- —
- Monthly P&I
- —
- Monthly cashflow
- —
- DSCR
- —
- Eligible?
- —
Short-term bridge; refi at stabilization.
Rent comps 18 comps
| Address | Beds | Baths | Sqft | Rent | $/sqft | DOM | Units | Dist |
|---|---|---|---|---|---|---|---|---|
| 255 14th Ave San Francisco, CA | 4.0 | 2.0 | 1400 | $6,500 | $4.64 | 43d | 1 | 0.26mi |
| 232 15th Ave San Francisco, CA | 2.0 | 1.5 | 1732 | $6,195 | $3.58 | 24d | 1 | 0.27mi |
| 143 4th Ave San Francisco, CA | 3.0 | 2.5 | 1668 | $10,500 | $6.29 | 43d | 1 | 0.40mi |
| 1514 Pershing Dr Unit A San Francisco, CA | 4.0 | 2.0 | 1475 | $6,100 | $4.14 | 24d | 1 | 0.65mi |
| 623 8th Ave Unit 623 San Francisco, CA | 3.0 | 1.5 | 1660 | $6,295 | $3.79 | 5d | 1 | 0.67mi |
| 1608 Balboa St San Francisco, CA | 3.0 | 2.0 | 1323 | $7,500 | $5.67 | 5d | 1 | 0.72mi |
| 1608 Balboa St San Francisco, CA | 3.0 | 2.0 | 1323 | $7,500 | $5.67 | 1d | 1 | 0.72mi |
| 16 Balboa St San Francisco, CA | 3.0 | 2.5 | 1500 | $7,800 | $5.20 | 24d | 1 | 0.83mi |
| 53 Stanyan St San Francisco, CA | 2.0 | 1.5 | 1400 | $6,400 | $4.57 | 24d | 1 | 0.83mi |
| 53 Stanyan St San Francisco, CA | 2.0 | 1.5 | 1400 | $6,400 | $4.57 | 43d | 1 | 0.83mi |
| 447 Spruce St San Francisco, CA | 3.0 | 1.0 | 1640 | $8,595 | $5.24 | 43d | 1 | 0.89mi |
| 74 Cook St San Francisco, CA | 3.0 | 2.0 | 1340 | $6,295 | $4.70 | 17d | 1 | 1.01mi |
| 853 MacArthur Ave Unit D San Francisco, CA | 4.0 | 2.0 | 1380 | $6,650 | $4.82 | 43d | 1 | 1.04mi |
| 833 24th Ave #831 San Francisco, CA | 3.0 | 1.5 | 1500 | $6,295 | $4.20 | 43d | 1 | 1.11mi |
| 726 Liggett Ave Unit B San Francisco, CA | 3.0 | 1.5 | 1250 | $9,800 | $7.84 | 43d | 1 | 1.20mi |
| 1818 Lyon St Unit A San Francisco, CA | 3.0 | 2.0 | 1557 | $8,500 | $5.46 | 21d | 1 | 1.36mi |
| 959 Lincoln Blvd San Francisco, CA | 4.0 | 2.0 | 1450 | $9,200 | $6.34 | 43d | 1 | 1.44mi |
| 479 35th Ave San Francisco, CA | 3.0 | 2.5 | 1750 | $6,200 | $3.54 | 12d | 1 | 1.46mi |
Listing history 2 events
-
2026-05-17$1,245,000 Active
-
2026-05-16historical $1,245,000
ⓘ Source: listings_history table (triggers on properties + properties_extension) + one-shot
backfill from property_details.listing_events for pre-trigger history.
Tax reassessment forecast CA · Resets to sale price
- Current annual tax
- $5,498 · $458/mo
- Projected year-2 tax
- $9,462 · $788/mo
- Expected delta
- +$3,964/yr (+$330/mo · 72.1%)
ⓘ Screening estimate from a state-policy table — verify with the county assessor before closing.
Climate risk First Street
- Flood 1/10 Low FEMA zone X (unshaded) · 0% chance over 30 yrs
- Wildfire 2/10 Low
- Heat 2/10 Low 7 d/yr ≥78°F today · 17 d/yr by 30 yrs out
- Wind 1/10 Low
- Air quality 7/10 Severe 13 unhealthy d/yr today · 13 by 30 yrs out
Nearby sold comps map
Loading sold comps map…
Walkable amenities ~0.75 mi
Loading nearby amenities…
Taxation est. · year 1
- Rental income
- $109,728
- − Mortgage interest
- −$69,739
- − Property taxes
- −$5,498
- − Insurance
- −$6,225
- − Repairs & maintenance
- −$8,778
- − Management
- −$8,778
- − Depreciation
- −$36,218
- Taxable loss
- −$25,509
- Est. tax savings @ 24.0%
- +$6,122
- After-tax cash flow
- $2,737/yr
For passive investors: Depreciation is non-cash, so a rental often shows a tax loss while cash-flowing — sheltering income. Rental losses are passive: they offset passive income freely, and up to $25,000/yr can offset ordinary (W-2) income if you actively participate and your MAGI is under $100k (phasing out to $0 by $150k); unused losses carry forward. On sale, claimed depreciation is recaptured at up to 25%, and gains may owe capital-gains tax (a 1031 exchange can defer both). Figures are a year-1 estimate at your 24.0% rate — not tax advice; consult a CPA.
Schools (NCES district)
- District
- San Francisco Unified
- NCES district ID
- 0634410
- Math proficiency
- 50% ▬ 0.00%
- Reading proficiency
- 56% ▲ 1.00%
- Median HH income
- $81,249
- Composite
- 50.14/100
- National rank
- #4088
- State rank
- #322 of 1400 in CA
Livability — San Francisco
- Score
- 76/100
- State rank
- #90
- US rank
- #3143
Category grades
Schools grade is shown separately in the Schools card above.
Census & demographics
- Census place
- San Francisco, CA
- County
- San Francisco County · 827,552 people
- City population
- 827,552
- Metro
- San Francisco-Oakland-Berkeley, CA
- Population (ZIP)
- 39,130
- Household income
- $163,995
- Rent vs Own
- Severe rent burden
- 1780.0
Population outlook (San Francisco County) Hauer SSP2
- Today (2025)
- 1,030,936 people
- By 2030
- 1,110,409 · +7.7%
- By 2040
- 1,270,010 · +23.2%
- By 2050
- 1,435,001 · +39.2%
- By 2075
- 1,779,074 · +72.6%
- By 2100
- 1,966,767 · +90.8%
Race, ethnicity, and origin ACS 2023
- Neighborhood character
- Diverse neighborhood (Simpson 0.64)
- Race & ethnicity
- White 49% Asian 32% Two or more races 10% Hispanic / Latino 10% Black 1%
- Hispanic origin (detail)
- Mexican 6%
- Common ancestry
- Romanian 3% Italian 3% Scotch-Irish 2%
- Foreign-born
- 25% · China, Canada, South Korea
- Languages at home
- 65% English-only · Chinese 15% Spanish 6% Other Indo-European 3%
Political lean MEDSL · San Francisco
- 2024 margin
- Solid D (+64.8) · D 80.3% · R 15.5% · Other 4.1%
- 2008→2024 swing
- -5.7pp toward R · 2008: 70.5pp · 2024: 64.8pp
- All cycles
- 2024: D+64.8 2020: D+72.5 2016: D+76.1 2012: D+70.2 2008: D+70.5
Not yet ingested
- Civics
- —
Market trends
- HPI YoY
- ▲ 7.92%
- Current HPI
- 250.5205
- Rent YoY
- ▲ 17.14%
- Metro
- San Francisco-Oakland-Berkeley, CA
- State GDP YoY
- ▲ 3.21%
- F500 in state
- 116
Industry mix (Fortune 500 HQ in CA)
| Industry | F500 HQs | Revenue |
|---|---|---|
| Technology | 27 | $1,492B |
|
||
| Financial Services | 3 | $174B |
|
||
| Retail | 3 | $44B |
|
||
| Insurance | 3 | $26B |
|
||
| Media / Entertainment | 2 | $115B |
|
||
| Pharmaceuticals / Biotech | 2 | $62B |
|
||
Price history
+0.0% since first listed2 events — show timeline
- 2026-05-17 Listed $1,245,000 bridgeMLS, Bay East AOR, or Contra Costa AOR
- 2026-05-16 Coming Soon $1,245,000 bridgeMLS, Bay East AOR, or Contra Costa AOR
Property tax history
+2.5%/yrLatest (2025): $5,498 · +4.0% YoY. Source: county tax records.
Cash-flow waterfall
monthlySold comps — $/sqft
last 12 mo · ≤1 miLoading sold comps…