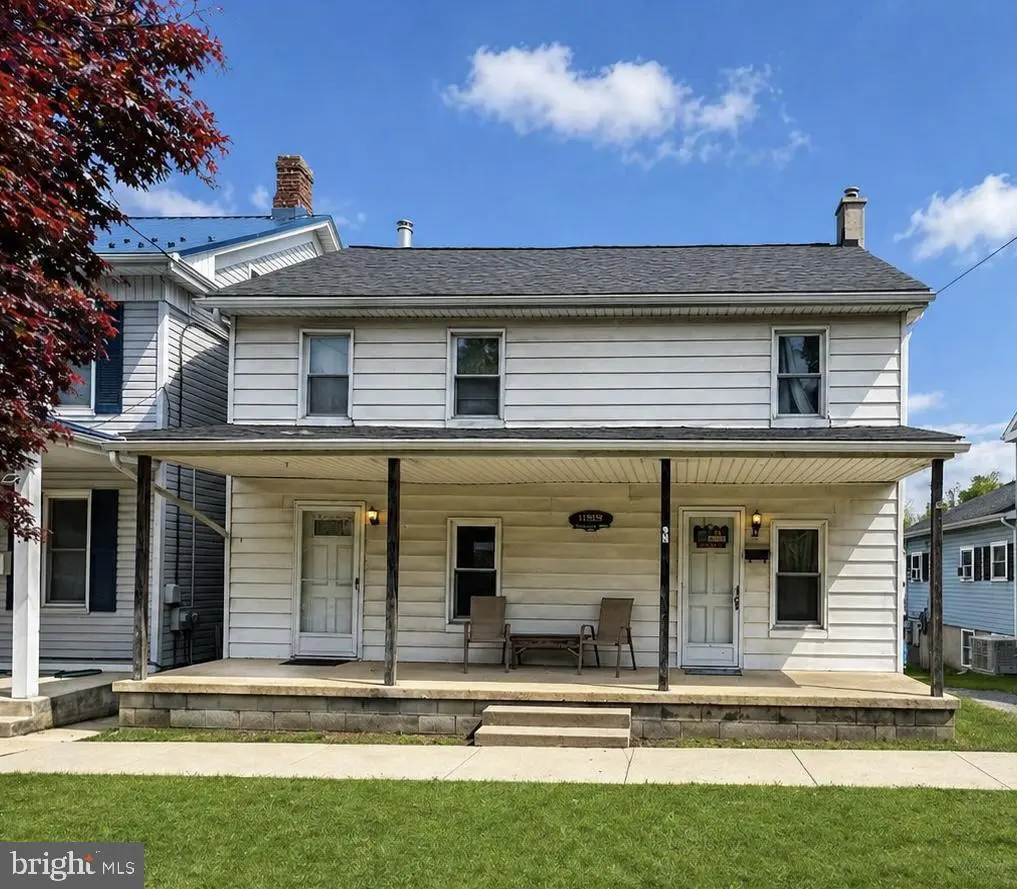
13 E Pennsylvania Ave · Yoe, PA
Flood risk 8/10 · Major
- FEMA flood zone
- X (unshaded)
- Chance of flooding over 30 yrs
- 0.99%
- Est. flood insurance / yr
- $473 – $860
Fire risk 1/10 · Minimal
- Est. fire insurance / yr
- $511 – $949
Heat risk 5/10 · Moderate
- Hot days now (above 100°F)
- 7 days/yr
- Hot days in 30 yrs
- 15 days/yr
Wind risk 4/10 · Minor
- Chance of severe wind over 30 yrs
- 13.0%
Air-quality risk 3/10 · Minor
- Unhealthy air days now
- 2 days/yr
- Unhealthy air days in 30 yrs
- 5 days/yr
Risk factors via First Street. Map © Google.
Why this score? — see what drove the B+ grade
The composite is a weighted blend of 9 inputs, each scored 0–100. Each bar is that input's sub-score; the figure is the points it added to the 100-point composite (weight × sub-score).
- Cash flow +29.9/30.0
- ARV discount +15.0/15.0
- DSCR +10.0/10.0
- 1% rule +9.4/10.0
- Schools +4.8/10.0
- Livability +3.5/5.0
- Rent growth +2.5/5.0
- Condition / age +2.5/5.0
- Appreciation +0.0/10.0
$129,900
🖨 Deal sheet 📄 Offer letter ✓ Due diligence
Listing remarks MLS
Great chance to buy an affordable 4BR, detached home. Huge LR. Ask about USDA 100% financing!
Key facts
- 1,999 sq ft lot
- Built 1900
- Listed 3 days
Property features AI
Finance
- Other: Fee simple ownership; Pets allowed with no pet restrictions; Above-grade finished area reported as 1,500 (assessor); Basement: full
Exterior
- Parking: Off-street parking; On-street parking
- Utilities: Public water; Public sewer; Sewer available; Water available; Electric available
- Home design: Detached property; Above-grade finished living area recorded by assessor
- Construction: Vinyl siding; Aluminum siding; Block foundation
- Exterior features: Chain link fencing; Not in a federal flood zone; Tidal water not present
Interior
- Bedrooms: 3 bedrooms on main level
- Bathrooms: 1 full bathroom on main level; 1 full bathroom total
- Heating & cooling: Central heating; Natural gas heating; Window unit(s) for cooling; Electric hot water
- Interior features: Attic; Dining area; Ceiling fan(s)
Neighborhood map
What this means for you Summary
Snapshot
- This is a 3-bed/1.0-bath single-family listed at $130k.
Deal economics
- At list price, monthly cash flow is $425 ($5k/yr) — positive.
- The deal already cash-flows at list — no discount required.
- Meets the 1% rule at list price ($2k rent vs $130k).
Location & tenants
- Location reads 69/100 on livability (#835 in PA) — a middle-class / working-renter tenant base. Strengths: cost of living A+, housing A+, health & safety A+; Watch: employment D, schools F, amenities F.
- Dallastown Area SD (suburban): math 47% / reading 63% proficiency, ranked #102 of 539 in PA (top 19%) — acceptable for families but not a draw, mixed tenant base, ~2y average lease.
- Market conditions: 42 active listings in the ZIP; 13 comparable units currently listed for rent nearby; rentals at typical pace (median 21d on market — plan ~3-4 weeks tenant-placement turnaround); 1,328 units permitted in York County in 2024 (338 in 5+ unit buildings).
Forward outlook
- Local home prices are declining (-3.0%/yr); year-one equity from $898 of loan paydown is wiped out by about $4k of value loss. Plan a longer hold.
- At projected returns (-3.0% appreciation + 3.0% rent growth), your $36k cash investment doubles in ~9 years — after that, you're playing with house money.
Negotiation context
- Only 3 days on market — expect competitive offers; lowballing is unlikely to land.
- 2 sale attempts since 10y ago with the ask held roughly flat each time — persistent listings suggest the price (not the market) is what's stuck; bring a comps-based counter.
Risks & watch-outs
- Watch-outs: flood insurance adds $56/mo; built in 1900 — expect roof / HVAC / electrical / plumbing capex.
- Climate carrying-cost: severe flood risk; extreme-heat days projected 7→15/yr by 2055 (HVAC capex compounding) — expect insurance premiums to compound above CPI over the hold.
Questions for the listing agent
- Built in 1900 — when were the roof, HVAC, electrical panel, plumbing, and water heater last replaced?
- What's the actual annual flood-insurance premium (NFIP or private), and is the property in a SFHA with mandatory coverage?
- Is there a deadline driving the sale (1031 exchange, divorce, estate, relocation)? That informs how much negotiation room exists.
- Schools are F-rated, which usually means shorter tenancies and higher turnover. Who's the typical renter profile here, and what's been the actual vacancy rate?
- What's the average days-on-market for RENTAL listings here right now (not sales)? A rising rental-DOM trend means longer vacancies and softer asking-rent achievability than the comps imply.
- What's the recent tenant-quality profile in this submarket — average credit score on applications, eviction rate, late-payment / NSF rate, and stable-employment percentage? A property-management company in the area should have these aggregated.
- How much new for-sale + rental construction is in the pipeline within 1–3 miles? Heavy new supply typically softens prices + rents 12–24 months out; constrained supply supports both.
Investment metrics
- 1% rule
- 1.44% ✓
- Cap rate
- 10.74%
- Cash-on-cash
- 15.87%
- DSCR
- 1.71
- GRM
- 5.8
CMA / ARV
- ARV (median comp)
- $192,132
- List price
- $129,900
- Delta
- -32.39%
- Verdict
- UNDERPRICED
- Comps
- 20 within 1.0 mi
Show comp detail 12 sales within ~0.75 mi
| Address | Dist | Beds/Ba | Sqft | Sold | Price | $/sf | Match |
|---|---|---|---|---|---|---|---|
| 13 E Pennsylvania Ave | 0.00mi | 3/1.0 | 1,500 (0%) | 1mo | $129,900 | $87 | 99 |
| 39 W George St | 0.12mi | 3/2.0 | 1,560 (+4%) | 1mo | $245,000 | $157 | 83 |
| 18 E High St | 0.11mi | 3/2.5 | 1,332 (-11%) | 0mo | $307,500 | $231 | 70 |
| 137 S Main St | 0.12mi | 3/2.0 | 1,664 (+11%) | 11mo | $220,000 | $132 | 64 |
| 190 S Elm St | 0.23mi | 3/2.0 | 1,456 (-3%) | 20mo | $173,000 | $119 | 64 |
| 439 N Lombard St | 0.33mi | 4/2.0 (+1) | 1,636 (+9%) | 1mo | $309,900 | $189 | 60 |
| 120 Susan Dr | 0.50mi | 3/2.0 | 1,625 (+8%) | 9mo | $329,900 | $203 | 51 |
| 92 W Broad St | 0.18mi | 4/1.0 (+1) | 1,277 (-15%) | 14mo | $217,400 | $170 | 51 |
| 345 N Walnut St | 0.54mi | 3/1.5 | 1,576 (+5%) | 20mo | $304,900 | $193 | 48 |
| 235 W Broad St | 0.73mi | 3/1.0 | 1,383 (-8%) | 16mo | $222,000 | $161 | 39 |
| 774 Blossom Hill Ln | 0.74mi | 3/1.5 | 1,296 (-14%) | 8mo | $300,000 | $231 | 34 |
| 69 W Maple St | 0.74mi | 3/1.5 | 1,296 (-14%) | 13mo | $210,000 | $162 | 30 |
Match score weights: distance 35% · size 25% · config 20% · recency 20%. Top-matched comps best support the ARV.
Projected returns pro-forma
-3.0% appreciation · 3.0% rent growth · sell at horizon
- IRR
- 4.4%
- Equity multiple
- 1.17×
- Total profit
- $6,170
- Equity at exit
- $19,369
- IRR
- 13.9%
- Equity multiple
- 2.12×
- Total profit
- $40,772
- Equity at exit
- $11,231
Cash invested: $36,372 (down + closing). Projections, not guarantees.
Landlord ↔ Tenant lean methodology
- Overall (STATE)
- 62 Landlord-Friendly
- State Pennsylvania
- 62 Landlord-Friendly · EVEN
- County
- — inherits STATE
- City
- — inherits STATE
ZIP-level market 17313
- Home prices YoY
- -26.5%
- Active inventory
- 42
- Price-to-rent
- 5.8×
Monthly cashflow live
- Estimated rent
- $1,876 high interval (Pro) →
- Mortgage (P&I)
- −$681
- Tax from tax record
- −$266 /mo · $3,194/yr
- Insurance
- −$54
- Flood insurance flood zone
- −$56 /mo · $666/yr
- HOA
- −$0
- Vacancy / Maint / Mgmt
- −$394
- Net cashflow
- $425
Break-even live
UW: 25.0% down · 7.5% · 30yr · 1.5% tax · 5.0% vac · 8.0% maint · 8.0% mgmt
Financing live
Cash to close
- Down payment
- $32,475
- Closing costs
- $3,897
- Reserves months
- —
- Total cash needed
- —
Loan-product check · same deal, 3 products live
Conventional
25% down · 7.5% · 30yr
- Down + closing
- —
- Monthly P&I
- —
- Monthly cashflow
- —
- DSCR
- —
- Eligible?
- —
Personal DTI + credit; lowest rate.
DSCR
20% down · 8.5% · 30yr
- Down + closing
- —
- Monthly P&I
- —
- Monthly cashflow
- —
- DSCR
- —
- Eligible?
- —
No personal income docs; deal must DSCR.
Hard money
10% down · 12.0% · 12mo
- Down + closing
- —
- Monthly P&I
- —
- Monthly cashflow
- —
- DSCR
- —
- Eligible?
- —
Short-term bridge; refi at stabilization.
Rent comps 13 comps
| Address | Beds | Baths | Sqft | Rent | $/sqft | DOM | Units | Dist |
|---|---|---|---|---|---|---|---|---|
| 306 Orchard Ct Red Lion, PA | 2.0 | 1.5 | 1300 | $1,495 | $1.15 | 21d | 1 | 0.25mi |
| 198 Cadbury Dr Red Lion, PA | 4.0 | 2.5 | 1625 | $2,250 | $1.38 | 13d | 1 | 0.65mi |
| 66 Cadbury Dr Red Lion, PA | 4.0 | 2.5 | 1625 | $2,250 | $1.38 | 13d | 1 | 0.65mi |
| 259 Stratford Dr Red Lion, PA | 4.0 | 2.5 | 1625 | $2,250 | $1.38 | 43d | 1 | 0.75mi |
| 224 Sienna Ln Yoe, PA | 3.0 | 2.5 | 1252 | $1,979 | $1.58 | 21d | 1 | 0.79mi |
| 321 Avon Dr Red Lion, PA | 3.0 | 2.5 | 1720 | $2,050 | $1.19 | 43d | 1 | 0.80mi |
| 406 Valor Way Red Lion, PA | 3.0 | 2.5 | 1252 | $1,875 | $1.50 | 21d | 1 | 0.85mi |
| 21 Windsor Way Red Lion, PA | 3.0 | 2.0–2.5 | 1385 | $2,150 | $1.55 | 13d | 8 | 0.94mi |
| 2992 Herrlyn Ct Dallastown, PA | 2.0 | 1.0 | 2100 | $1,475 | $0.70 | 21d | 1 | 1.26mi |
| 705 Country Club Rd Red Lion, PA | 3.0 | 2.5 | 1660 | $1,695 | $1.02 | 43d | 1 | 1.33mi |
| 201 Burrows Rd Red Lion, PA | 3.0 | 2.5 | 1485 | $1,924 | $1.30 | 13d | 1 | 1.34mi |
| 703 Country Club Rd Red Lion, PA | 3.0 | 2.5 | 1540 | $1,795 | $1.17 | 43d | 1 | 1.34mi |
| 16 W High St Red Lion, PA | 3.0 | 1.0 | 1075 | $1,075 | $1.00 | 21d | 1 | 1.45mi |
Listing history 7 events
-
2026-05-03status Pending 458-char remark
-
2026-05-01$129,900 Active 458-char remark
-
2026-04-29historical $129,900 458-char remark
-
2017-06-06soldstatus $92,000
-
2017-05-26soldstatus $92,000 93-char remark
Show marketing remark (93 chars)
Great chance to buy an affordable 4BR, detached home. Huge LR. Ask about USDA 100% financing!
-
2017-04-09historical 93-char remark
Show marketing remark (93 chars)
Great chance to buy an affordable 4BR, detached home. Huge LR. Ask about USDA 100% financing!
-
2016-09-02$92,000 93-char remark
Show marketing remark (93 chars)
Great chance to buy an affordable 4BR, detached home. Huge LR. Ask about USDA 100% financing!
ⓘ Source: listings_history table (triggers on properties + properties_extension) + one-shot
backfill from property_details.listing_events for pre-trigger history.
Tax reassessment forecast PA · Partial reset (capped growth)
- Current annual tax
- $3,194 · $266/mo
- Projected year-2 tax
- $3,194 · $266/mo
- Expected delta
- $0/yr ($0/mo · 0.0%)
ⓘ Screening estimate from a state-policy table — verify with the county assessor before closing.
Climate risk First Street
- Flood 8/10 Severe FEMA zone X (unshaded) · 99% chance over 30 yrs
- Wildfire 1/10 Low
- Heat 5/10 Major 7 d/yr ≥100°F today · 15 d/yr by 30 yrs out
- Wind 4/10 Moderate 13% chance of damaging wind over 30 yrs
- Air quality 3/10 Moderate 2 unhealthy d/yr today · 5 by 30 yrs out
Nearby sold comps map
Loading sold comps map…
Walkable amenities ~0.75 mi
Loading nearby amenities…
Taxation est. · year 1
- Rental income
- $22,518
- − Mortgage interest
- −$7,276
- − Property taxes
- −$3,194
- − Insurance
- −$1,316
- − Repairs & maintenance
- −$1,801
- − Management
- −$1,801
- − Depreciation
- −$3,779
- Taxable income
- $3,350
- Est. tax owed @ 24.0%
- −$804
- After-tax cash flow
- $4,301/yr
For passive investors: Depreciation is non-cash, so a rental often shows a tax loss while cash-flowing — sheltering income. Rental losses are passive: they offset passive income freely, and up to $25,000/yr can offset ordinary (W-2) income if you actively participate and your MAGI is under $100k (phasing out to $0 by $150k); unused losses carry forward. On sale, claimed depreciation is recaptured at up to 25%, and gains may owe capital-gains tax (a 1031 exchange can defer both). Figures are a year-1 estimate at your 24.0% rate — not tax advice; consult a CPA.
Schools (NCES district)
- District
- Dallastown Area SD
- NCES district ID
- 4207230
- Math proficiency
- 47% ▼ -5.00%
- Reading proficiency
- 63% ▼ -9.00%
- Median HH income
- $61,805
- Composite
- 48.0/100
- National rank
- #2199
- State rank
- #102 of 539 in PA
Livability — Yoe
- Score
- 69/100
- State rank
- #835
- US rank
- #8743
Category grades
Schools grade is shown separately in the Schools card above.
Census & demographics
- Census place
- Yoe, PA
- Population (ZIP)
- 11,263
Population outlook (York County) Hauer SSP2
- Today (2025)
- 454,205 people
- By 2030
- 457,407 · +0.7%
- By 2040
- 457,529 · +0.7%
- By 2050
- 448,261 · -1.3%
- By 2075
- 427,388 · -5.9%
- By 2100
- 384,218 · -15.4%
Race, ethnicity, and origin ACS 2023
- Neighborhood character
- Predominantly White (81%)
- Race & ethnicity
- White 81% Two or more races 9% Hispanic / Latino 5% Black 5%
- Common ancestry
- Romanian 5% Serbian 2% Iranian 2%
- Foreign-born
- 3% · China, Canada
- Languages at home
- 96% English-only · Spanish 2% Other Indo-European 1%
Political lean MEDSL · York
- 2024 margin
- Strong R (+25.3) · D 36.9% · R 62.1%
- 2008→2024 swing
- -11.7pp toward R · 2008: -13.6pp · 2024: -25.3pp
- All cycles
- 2024: R+25.3 2020: R+24.6 2016: R+29.3 2012: R+21.2 2008: R+13.6
Not yet ingested
- Civics
- —
Market trends
- HPI YoY
- ▼ -93.45%
- Current HPI
- 258.6397
- Rent YoY
- —
- Metro
- —
- State GDP YoY
- ▲ 1.68%
- F500 in state
- 34
Industry mix (Fortune 500 HQ in PA)
| Industry | F500 HQs | Revenue |
|---|---|---|
| Healthcare | 2 | $309B |
|
||
| Insurance | 2 | $27B |
|
||
| Telecommunications / Media | 1 | $124B |
|
||
| Industrial Distribution | 1 | $22B |
|
||
| Financial Services | 1 | $20B |
|
||
| Chemicals / Materials | 1 | $18B |
|
||
Price history
+41.2% since first listed8 events — show timeline
- 2026-05-29 Sold (MLS) $129,900 BRIGHT MLS
- 2026-05-03 Pending — BRIGHT MLS
- 2026-05-01 Listed $129,900 BRIGHT MLS
- 2026-04-29 Coming Soon $129,900 BRIGHT MLS
- 2017-06-06 Sold (Public Records) $92,000 Public Records
- 2017-05-26 Sold (MLS) $92,000 BRIGHT MLS
- 2017-04-09 Listing Removed — BRIGHT MLS
- 2016-09-02 Listed $92,000 BRIGHT MLS
Property tax history
+2.0%/yrLatest (2026): $3,194 · +4.4% YoY. Source: county tax records.
Cash-flow waterfall
monthlySold comps — $/sqft
last 12 mo · ≤1 miLoading sold comps…