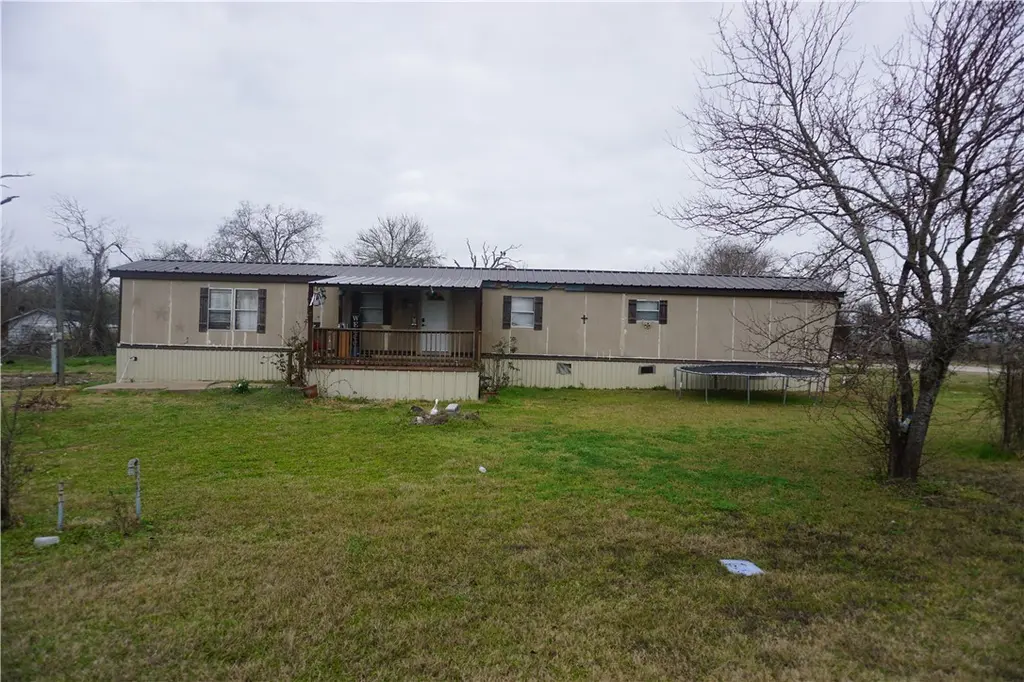
5765 Post Oak Loop · Midway, TX
Flood risk 1/10 · Minimal
- FEMA flood zone
- —
- Chance of flooding over 30 yrs
- 0.0%
- Est. flood insurance / yr
- —
Fire risk 3/10 · Minor
- Est. fire insurance / yr
- $1,222 – $2,270
Heat risk 8/10 · Major
- Hot days now (above 112°F)
- 7 days/yr
- Hot days in 30 yrs
- 25 days/yr
Wind risk 8/10 · Major
- Chance of severe wind over 30 yrs
- 80.0%
Air-quality risk 1/10 · Minimal
- Unhealthy air days now
- 0 days/yr
- Unhealthy air days in 30 yrs
- 0 days/yr
Risk factors via First Street. Map © Google.
Why this score? — see what drove the D grade
The composite is a weighted blend of 9 inputs, each scored 0–100. Each bar is that input's sub-score; the figure is the points it added to the 100-point composite (weight × sub-score).
- Cash flow +12.7/30.0
- ARV discount +7.5/15.0
- Appreciation +6.0/10.0
- Schools +4.3/10.0
- DSCR +3.8/10.0
- Rent growth +2.5/5.0
- Condition / age +2.5/5.0
- 1% rule +2.4/10.0
- Livability +2.3/5.0
$150,000
🖨 Deal sheet 📄 Offer letter ✓ Due diligence
Listing remarks MLS
This mobile home is located in a quiet area known as Midway. It is just a minute fron 21 HWY and 12 minutes from Madisonville. Utilities are already in place with both electricity and a water source available.
Key facts
- 0.46 acre lot
- Built 1982
- Listed 114 days
Neighborhood map
What this means for you Summary
Snapshot
- This is a 3-bed/2.0-bath manufactured listed at $150k.
Deal economics
- At list price, monthly cash flow is $-16 ($-195/yr) — negative.
- To cash-flow at today's rent, offer at most $147k (1.9% below list).
- To meet the 1% rule (rent ≥ 1% of price), the offer needs to be $111k (25.8% below list).
- Recommended offer: $111k (25.8% below list) — sets the bar for 1% rule.
Location & tenants
- Location reads 46/100 on livability (#1,549 in TX) — a working-class tenant base; expect higher turnover. Strengths: cost of living A+, crime A; Watch: housing C-, schools F, amenities F.
- Madisonville CISD (town): math 53% / reading 50% proficiency, ranked #177 of 826 in TX (top 21%) — acceptable for families but not a draw, mixed tenant base, ~2y average lease; 63% free/reduced lunch — lower-income household profile, screen leases tightly.
- Market conditions: 51 active listings in the ZIP; 1 units permitted in Madison County in 2024 (0 in 5+ unit buildings).
Forward outlook
- In year one you build about $4k of equity ($1k loan paydown + $3k appreciation (2.0% local appreciation)).
- Madison County population projected at +16% by 2050 — long-run rental-demand tailwind backs the buy-and-hold thesis.
- At projected returns (2.0% appreciation + 3.0% rent growth), your $42k cash investment doubles in ~8 years — after that, you're playing with house money.
- By year 8, paydown + projected appreciation supports a ~$31k cash-out refi (75% LTV) — recoverable capital for the next deal without selling this one.
Negotiation context
- It's been on market 115 days — a 9% lower offer ($136k) is reasonable based on typical stale-listing flexibility.
Risks & watch-outs
- Climate carrying-cost: severe wind risk, 80% chance of damaging wind over 30y; extreme-heat days projected 7→25/yr by 2055 (HVAC capex compounding) — expect insurance premiums to compound above CPI over the hold.
Questions for the listing agent
- What do current leases actually rent for vs. the listed asking? Can we see a recent rent roll and the last 12 months of T-12 income?
- It's been on market 115 days. Have you received any prior offers? Is the seller open to a 26% concession, seller financing, or rate buy-down credit?
- Why hasn't it sold? Are there any deal-killer items the seller is aware of (foundation, flood, title, zoning, code violations)?
- Is there a deadline driving the sale (1031 exchange, divorce, estate, relocation)? That informs how much negotiation room exists.
- Schools are F-rated, which usually means shorter tenancies and higher turnover. Who's the typical renter profile here, and what's been the actual vacancy rate?
- The area grade is low — what's the realistic commute time and amenity access for the typical tenant pool here? Any planned neighborhood developments (good or bad) we should know about?
- What's the average days-on-market for RENTAL listings here right now (not sales)? A rising rental-DOM trend means longer vacancies and softer asking-rent achievability than the comps imply.
- What's the recent tenant-quality profile in this submarket — average credit score on applications, eviction rate, late-payment / NSF rate, and stable-employment percentage? A property-management company in the area should have these aggregated.
- How much new for-sale + rental construction is in the pipeline within 1–3 miles? Heavy new supply typically softens prices + rents 12–24 months out; constrained supply supports both.
Investment metrics
- 1% rule
- 0.74% ✗
- Cap rate
- 6.16%
- Cash-on-cash
- -0.46%
- DSCR
- 0.98
- GRM
- 11.2
CMA / ARV
- ARV (median comp)
- $325,000
- List price
- $150,000
- Delta
- -53.85%
- Verdict
- UNDERPRICED
- Comps
- 1 within 2.0 mi
Projected returns pro-forma
2.03% appreciation · 3.0% rent growth · sell at horizon
- IRR
- 4.1%
- Equity multiple
- 1.22×
- Total profit
- $9,418
- Equity at exit
- $59,418
- IRR
- 7.8%
- Equity multiple
- 2.06×
- Total profit
- $44,676
- Equity at exit
- $85,758
Cash invested: $42,000 (down + closing). Projections, not guarantees.
Landlord ↔ Tenant lean methodology
- Overall (STATE)
- 87 Strongly Landlord-Friendly
- State Texas
- 87 Strongly Landlord-Friendly · R+5
- County
- — inherits STATE
- City
- — inherits STATE
ZIP-level market 75852
- Home prices YoY
- 0.9%
- Active inventory
- 51
- Price-to-rent
- 11.2×
Monthly cashflow live
- Estimated rent
- $1,112 medium interval (Pro) →
- Mortgage (P&I)
- −$787
- Tax from tax record
- −$46 /mo · $550/yr
- Insurance
- −$62
- HOA
- −$0
- Vacancy / Maint / Mgmt
- −$234
- Net cashflow
- $-16
Break-even live
UW: 25.0% down · 7.5% · 30yr · 1.5% tax · 5.0% vac · 8.0% maint · 8.0% mgmt
Financing live
Cash to close
- Down payment
- $37,500
- Closing costs
- $4,500
- Reserves months
- —
- Total cash needed
- —
Loan-product check · same deal, 3 products live
Conventional
25% down · 7.5% · 30yr
- Down + closing
- —
- Monthly P&I
- —
- Monthly cashflow
- —
- DSCR
- —
- Eligible?
- —
Personal DTI + credit; lowest rate.
DSCR
20% down · 8.5% · 30yr
- Down + closing
- —
- Monthly P&I
- —
- Monthly cashflow
- —
- DSCR
- —
- Eligible?
- —
No personal income docs; deal must DSCR.
Hard money
10% down · 12.0% · 12mo
- Down + closing
- —
- Monthly P&I
- —
- Monthly cashflow
- —
- DSCR
- —
- Eligible?
- —
Short-term bridge; refi at stabilization.
Listing history 17 events
-
2026-06-19days on market $150,000 Active 115 DOM
-
2026-06-18days on market $150,000 Active 114 DOM
-
2026-06-17days on market $150,000 Active 113 DOM
-
2026-06-16days on market $150,000 Active 112 DOM
-
2026-06-15days on market $150,000 Active 111 DOM
-
2026-06-14days on market $150,000 Active 109 DOM
-
2026-06-13days on market $150,000 Active 108 DOM
-
2026-06-10days on market $150,000 Active 106 DOM
-
2026-06-09days on market $150,000 Active 105 DOM
-
2026-06-08days on market $150,000 Active 104 DOM
-
2026-06-07days on market $150,000 Active 103 DOM
-
2026-06-02days on market $150,000 Active 98 DOM
-
2026-06-01days on market $150,000 Active 97 DOM
-
2026-05-31days on market $150,000 Active 96 DOM
-
2026-05-30days on market $150,000 Active 95 DOM
-
2026-02-24$150,000 Active 209-char remark
Show marketing remark (209 chars)
This mobile home is located in a quiet area known as Midway. It is just a minute fron 21 HWY and 12 minutes from Madisonville. Utilities are already in place with both electricity and a water source available.
-
2020-03-18soldstatus
ⓘ Source: listings_history table (triggers on properties + properties_extension) + one-shot
backfill from property_details.listing_events for pre-trigger history.
Tax reassessment forecast TX · Resets to sale price
- Current annual tax
- $550 · $46/mo
- Projected year-2 tax
- $2,745 · $229/mo
- Expected delta
- +$2,195/yr (+$183/mo · 399.0%)
ⓘ Screening estimate from a state-policy table — verify with the county assessor before closing.
Climate risk First Street
- Flood 1/10 Low 0% chance over 30 yrs
- Wildfire 3/10 Moderate
- Heat 8/10 Severe 7 d/yr ≥112°F today · 25 d/yr by 30 yrs out
- Wind 8/10 Severe 80% chance of damaging wind over 30 yrs
- Air quality 1/10 Low 0 unhealthy d/yr today · 0 by 30 yrs out
Nearby sold comps map
Loading sold comps map…
Walkable amenities ~0.75 mi
Loading nearby amenities…
Taxation est. · year 1
- Rental income
- $13,348
- − Mortgage interest
- −$8,402
- − Property taxes
- −$550
- − Insurance
- −$750
- − Repairs & maintenance
- −$1,068
- − Management
- −$1,068
- − Depreciation
- −$4,364
- Taxable loss
- −$2,854
- Est. tax savings @ 24.0%
- +$685
- After-tax cash flow
- $490/yr
For passive investors: Depreciation is non-cash, so a rental often shows a tax loss while cash-flowing — sheltering income. Rental losses are passive: they offset passive income freely, and up to $25,000/yr can offset ordinary (W-2) income if you actively participate and your MAGI is under $100k (phasing out to $0 by $150k); unused losses carry forward. On sale, claimed depreciation is recaptured at up to 25%, and gains may owe capital-gains tax (a 1031 exchange can defer both). Figures are a year-1 estimate at your 24.0% rate — not tax advice; consult a CPA.
Schools (NCES district)
- District
- Madisonville CISD
- NCES district ID
- 4828710
- Math proficiency
- 53% ▼ -1.00%
- Reading proficiency
- 50% ▲ 7.00%
- Median HH income
- $39,234
- Composite
- 43.02/100
- National rank
- #3102
- State rank
- #177 of 826 in TX
Livability — Midway
- Score
- 46/100
- State rank
- #1549
- US rank
- #26411
Category grades
Schools grade is shown separately in the Schools card above.
Census & demographics
- Census place
- Midway, TX
- Population (ZIP)
- 3,166
Population outlook (Madison County) Hauer SSP2
- Today (2025)
- 14,350 people
- By 2030
- 14,854 · +3.5%
- By 2040
- 15,876 · +10.6%
- By 2050
- 16,631 · +15.9%
- By 2075
- 18,375 · +28.0%
- By 2100
- 18,600 · +29.6%
Race, ethnicity, and origin ACS 2023
- Neighborhood character
- Highly diverse neighborhood (Simpson 0.70)
- Race & ethnicity
- White 36% Hispanic / Latino 29% Black 29% Two or more races 10%
- Hispanic origin (detail)
- Mexican 18%
- Common ancestry
- Lithuanian 3% Italian 1% Hispanic 1%
- Foreign-born
- 8% · Canada, Vietnam, Jamaica
- Languages at home
- 80% English-only · Spanish 19%
Political lean MEDSL · Madison
- 2024 margin
- Solid R (+64.4) · D 17.6% · R 82.0%
- 2008→2024 swing
- -21.6pp toward R · 2008: -42.8pp · 2024: -64.4pp
- All cycles
- 2024: R+64.4 2020: R+58.2 2016: R+57.6 2012: R+51.3 2008: R+42.8
Not yet ingested
- Civics
- —
Market trends
- HPI YoY
- ▲ 2.03%
- Current HPI
- 229.4053
- Rent YoY
- —
- Metro
- —
- State GDP YoY
- ▲ 3.95%
- F500 in state
- 110
Industry mix (Fortune 500 HQ in TX)
| Industry | F500 HQs | Revenue |
|---|---|---|
| Energy | 16 | $1,198B |
|
||
| Technology | 5 | $198B |
|
||
| Engineering / Construction | 4 | $72B |
|
||
| Energy Services | 3 | $60B |
|
||
| Utilities | 3 | $41B |
|
||
| Healthcare | 2 | $330B |
|
||
Price history
2 events — show timeline
- 2026-02-24 Listed $150,000 BCSRMLS
- 2020-03-18 Sold (Public Records) — Public Records
Property tax history
+4.3%/yrLatest (2025): $550 · -1.8% YoY. Source: county tax records.
Cash-flow waterfall
monthlySold comps — $/sqft
last 12 mo · ≤1 miLoading sold comps…