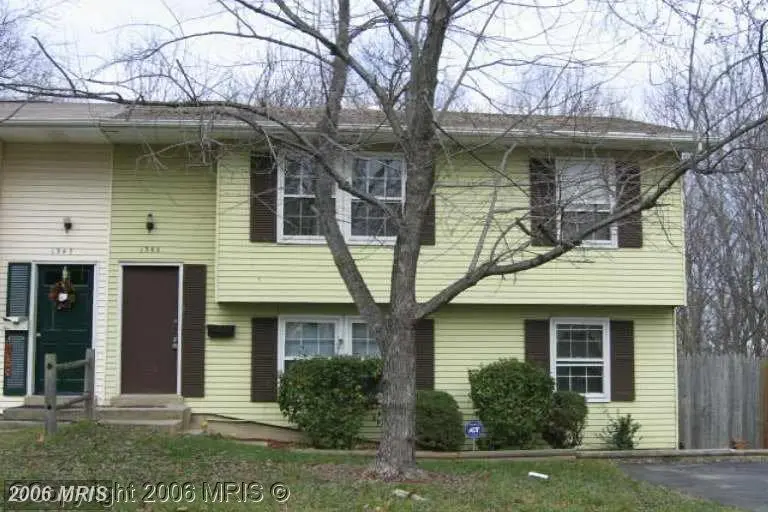
1345 Chapelview Dr · Odenton, MD
Flood risk 1/10 · Minimal
- FEMA flood zone
- X (unshaded)
- Chance of flooding over 30 yrs
- 0.0%
- Est. flood insurance / yr
- $473 – $860
Fire risk 3/10 · Minor
- Est. fire insurance / yr
- $755 – $1,403
Heat risk 8/10 · Major
- Hot days now (above 102°F)
- 7 days/yr
- Hot days in 30 yrs
- 15 days/yr
Wind risk 6/10 · Moderate
- Chance of severe wind over 30 yrs
- 27.0%
Air-quality risk 4/10 · Minor
- Unhealthy air days now
- 4 days/yr
- Unhealthy air days in 30 yrs
- 7 days/yr
Risk factors via First Street. Map © Google.
Why this score? — see what drove the D grade
The composite is a weighted blend of 9 inputs, each scored 0–100. Each bar is that input's sub-score; the figure is the points it added to the 100-point composite (weight × sub-score).
- Cash flow +13.9/30.0
- ARV discount +7.5/15.0
- DSCR +4.2/10.0
- Livability +3.5/5.0
- 1% rule +3.2/10.0
- Rent growth +3.0/5.0
- Schools +2.9/10.0
- Condition / age +2.5/5.0
- Appreciation +0.0/10.0
$355,000
🖨 Deal sheet 📄 Offer letter ✓ Due diligence
Listing remarks MLS
Hurry and get this under contract before repairs are completed and choose your own colors. Seller is offering $5000 closing help with full price offer, and will reduce price by $10000 and offer $10000 repair allowance if you buy it as-is. Contact your agent or email the listing agent with any questions.
Key facts
- Built 1972
- Listed 30 days
Neighborhood map
What this means for you Summary
Snapshot
- This is a 4-bed/1.5-bath townhouse listed at $355k.
Deal economics
- At list price, monthly cash flow is $38 ($451/yr) — positive.
- The deal already cash-flows at list — no discount required.
- To meet the 1% rule (rent ≥ 1% of price), the offer needs to be $290k (18.4% below list).
- Recommended offer: $290k (18.4% below list) — sets the bar for 1% rule.
- Cap rate 6.4% vs local median 3.9% in Odenton — top-decile yield for the area; either an underpriced asset or a hidden risk that comps aren't pricing in. Stress-test before assuming the spread holds.
Location & tenants
- Location reads 70/100 on livability (#161 in MD) — a middle-class / working-renter tenant base. Strengths: employment A+, housing A+; Watch: crime C-, amenities F, commute F.
- Anne Arundel County Public Schools (suburban): math 20% / reading 37% proficiency, ranked #10 of 24 in MD (top 42%) — low school quality limits family demand, transient renter base, plan for 1-2y turnover.
- Market conditions: Rents rising (+2.0%/yr); 153 active listings in the ZIP; 11 comparable units currently listed for rent nearby; rentals at typical pace (median 24d on market — plan ~3-4 weeks tenant-placement turnaround); high-income renter base; 1,303 units permitted in Anne Arundel County in 2024 (299 in 5+ unit buildings).
Forward outlook
- Local home prices are declining (-3.0%/yr); year-one equity from $2k of loan paydown is wiped out by about $11k of value loss. Plan a longer hold.
- Anne Arundel County population projected at +17% by 2050 — long-run rental-demand tailwind backs the buy-and-hold thesis.
Negotiation context
- It's been on market 30 days — a 2% lower offer ($350k) is reasonable based on typical stale-listing flexibility.
- 4 sale attempts since 28y ago; this cycle's ask is 32% above the opening price — seller raised mid-cycle; expect resistance to lowballs.
- Current owner paid $260k; 37% above their basis — modest negotiation headroom, anchor on the comps not their cost.
Risks & watch-outs
- Climate carrying-cost: major wind risk, 27% chance of damaging wind over 30y; extreme-heat days projected 7→15/yr by 2055 (HVAC capex compounding) — expect insurance premiums to compound above CPI over the hold.
Questions for the listing agent
- Built in 1972 — when were the roof, HVAC, electrical panel, plumbing, and water heater last replaced?
- Is there a deadline driving the sale (1031 exchange, divorce, estate, relocation)? That informs how much negotiation room exists.
- Schools are B-rated — typically a magnet for longer-tenancy family renters. What's the average tenant stay here, and is there a school-zone premium baked into asking?
- The area grade is low — what's the realistic commute time and amenity access for the typical tenant pool here? Any planned neighborhood developments (good or bad) we should know about?
- What's the average days-on-market for RENTAL listings here right now (not sales)? A rising rental-DOM trend means longer vacancies and softer asking-rent achievability than the comps imply.
- What's the recent tenant-quality profile in this submarket — average credit score on applications, eviction rate, late-payment / NSF rate, and stable-employment percentage? A property-management company in the area should have these aggregated.
- How much new for-sale + rental construction is in the pipeline within 1–3 miles? Heavy new supply typically softens prices + rents 12–24 months out; constrained supply supports both.
Investment metrics
- 1% rule
- 0.82% ✗
- Cap rate
- 6.42%
- Cash-on-cash
- 0.45%
- DSCR
- 1.02
- GRM
- 10.2
CMA / ARV
- ARV (median comp)
- $354,986
- List price
- $355,000
- Delta
- —
- Verdict
- FAIR
- Comps
- 20 within 1.0 mi
Show comp detail 12 sales within ~0.75 mi
| Address | Dist | Beds/Ba | Sqft | Sold | Price | $/sf | Match |
|---|---|---|---|---|---|---|---|
| 1336 Passage Dr | 0.18mi | 4/2.0 | 1,300 (0%) | 1mo | $375,000 | $288 | 89 |
| 1318 Wickell Rd | 0.42mi | 4/1.5 | 1,300 (0%) | 4mo | $388,850 | $299 | 77 |
| 724 Chapelgate Dr | 0.43mi | 4/2.0 | 1,300 (0%) | 4mo | $375,000 | $288 | 75 |
| 1327 Passage Dr | 0.16mi | 4/1.5 | 1,440 (+11%) | 0mo | $355,000 | $247 | 74 |
| 1311 Tenbrook Rd | 0.12mi | 3/2.0 (-1) | 1,354 (+4%) | 8mo | $350,000 | $258 | 74 |
| 1344 Huntover Dr | 0.28mi | 3/2.5 (-1) | 1,300 (0%) | 6mo | $390,000 | $300 | 73 |
| 704 Chapelview Dr | 0.25mi | 4/2.0 | 1,484 (+14%) | 3mo | $415,000 | $280 | 60 |
| 729 Chapelgate Dr | 0.43mi | 4/2.0 | 1,456 (+12%) | 2mo | $380,000 | $261 | 56 |
| 506 Imperial Sq | 0.67mi | 3/2.5 (-1) | 1,331 (+2%) | 4mo | $315,000 | $237 | 53 |
| 8737 Autumn Ridge Ct | 0.62mi | 3/2.0 (-1) | 1,430 (+10%) | 2mo | $435,000 | $304 | 45 |
| 2275 Lea Ct | 0.50mi | 3/2.5 (-1) | 1,486 (+14%) | 1mo | $485,000 | $326 | 43 |
| 8739 Bright Meadow Ct | 0.62mi | 3/2.5 (-1) | 1,430 (+10%) | 8mo | $395,000 | $276 | 39 |
Match score weights: distance 35% · size 25% · config 20% · recency 20%. Top-matched comps best support the ARV.
Projected returns pro-forma
-3.0% appreciation · 1.98% rent growth · sell at horizon
- IRR
- -16.7%
- Equity multiple
- 0.41×
- Total profit
- $-58,156
- Equity at exit
- $52,932
- IRR
- -10.3%
- Equity multiple
- 0.40×
- Total profit
- $-59,718
- Equity at exit
- $30,694
Cash invested: $99,400 (down + closing). Projections, not guarantees.
Landlord ↔ Tenant lean methodology
- Overall (STATE)
- 27 Tenant-Leaning
- State Maryland
- 27 Tenant-Leaning · D+14
- County
- — inherits STATE
- City
- — inherits STATE
ZIP-level market 21113
- Home prices YoY
- -24.3%
- Rents YoY
- 2.0%
- Active inventory
- 153
- Price-to-rent
- 10.2×
Monthly cashflow live
- Estimated rent
- $2,896 high interval (Pro) →
- Mortgage (P&I)
- −$1,862
- Tax from tax record
- −$241 /mo · $2,890/yr
- Insurance
- −$148
- HOA
- −$0
- Vacancy / Maint / Mgmt
- −$608
- Net cashflow
- $38
Break-even live
UW: 25.0% down · 7.5% · 30yr · 1.5% tax · 5.0% vac · 8.0% maint · 8.0% mgmt
Financing live
Cash to close
- Down payment
- $88,750
- Closing costs
- $10,650
- Reserves months
- —
- Total cash needed
- —
Loan-product check · same deal, 3 products live
Conventional
25% down · 7.5% · 30yr
- Down + closing
- —
- Monthly P&I
- —
- Monthly cashflow
- —
- DSCR
- —
- Eligible?
- —
Personal DTI + credit; lowest rate.
DSCR
20% down · 8.5% · 30yr
- Down + closing
- —
- Monthly P&I
- —
- Monthly cashflow
- —
- DSCR
- —
- Eligible?
- —
No personal income docs; deal must DSCR.
Hard money
10% down · 12.0% · 12mo
- Down + closing
- —
- Monthly P&I
- —
- Monthly cashflow
- —
- DSCR
- —
- Eligible?
- —
Short-term bridge; refi at stabilization.
Rent comps 11 comps
| Address | Beds | Baths | Sqft | Rent | $/sqft | DOM | Units | Dist |
|---|---|---|---|---|---|---|---|---|
| 511 Kingdom Ct Odenton, MD | 3.0 | 2.5 | 1610 | $2,399 | $1.49 | 5d | 1 | 0.53mi |
| 2419 Warm Spring Way Odenton, MD | 3.0 | 2.5 | 1613 | $2,650 | $1.64 | 21d | 1 | 0.55mi |
| 812 Vacation Dr Odenton, MD | 4.0 | 2.0 | 1760 | $3,500 | $1.99 | 43d | 1 | 0.56mi |
| 659 Realm Ct W Odenton, MD | 3.0 | 1.5 | 1600 | $2,400 | $1.50 | 24d | 1 | 0.59mi |
| 8745 Bright Meadow Ct Odenton, MD | 3.0 | 2.5 | 1430 | $2,650 | $1.85 | 24d | 1 | 0.64mi |
| 2406 Forest Edge Ct #102 Odenton, MD | 3.0 | 2.0 | 1263 | $2,500 | $1.98 | 24d | 1 | 0.79mi |
| 703 Horse Chestnut Ct Odenton, MD | 3.0 | 2.5 | 1720 | $2,800 | $1.63 | 43d | 1 | 0.81mi |
| 2263 Misthaven Ln Gambrills, MD | 3.0 | 2.0 | 1200 | $2,595 | $2.16 | 43d | 1 | 1.04mi |
| 537 Tranquil Ct Odenton, MD | 1.0–3.0 | 1.0–2.0 | 892 | $2,415 | $2.71 | 1d | 18 | 1.12mi |
| 2600 Midway Branch Dr Odenton, MD | 1.0–3.0 | 1.0–3.0 | 1178 | $3,250 | $2.76 | 1d | 16 | 1.43mi |
| 800 Hydric Ct Odenton, MD | 1.0–3.0 | 1.0–2.0 | 1026 | $2,945 | $2.87 | 5d | 17 | 1.49mi |
Listing history 27 events
-
2026-06-18days on market $355,000 Active 30 DOM
-
2026-06-17days on market $355,000 Active 29 DOM
-
2026-06-16days on market $355,000 Active 28 DOM
-
2026-06-15price $355,000 Active 27 DOM
-
2026-06-15days on market $365,000 Active 27 DOM
-
2026-06-13days on market $365,000 Active 25 DOM
-
2026-06-09days on market $365,000 Active 21 DOM
-
2026-06-08days on market $365,000 Active 20 DOM
-
2026-06-07days on market $365,000 Active 19 DOM
-
2026-06-04days on market $365,000 Active 16 DOM
-
2026-06-03days on market $365,000 Active 15 DOM
-
2026-06-02days on market $365,000 Active 14 DOM
-
2026-06-01days on market $365,000 Active 13 DOM
-
2026-05-31days on market $365,000 Active 12 DOM
-
2026-04-22historical $365,000
-
2007-03-19soldstatus $259,900 304-char remark
Show marketing remark (304 chars)
Hurry and get this under contract before repairs are completed and choose your own colors. Seller is offering $5000 closing help with full price offer, and will reduce price by $10000 and offer $10000 repair allowance if you buy it as-is. Contact your agent or email the listing agent with any questions.
-
2007-02-20soldstatus $182,000
-
2007-01-29historical 304-char remark
Show marketing remark (304 chars)
Hurry and get this under contract before repairs are completed and choose your own colors. Seller is offering $5000 closing help with full price offer, and will reduce price by $10000 and offer $10000 repair allowance if you buy it as-is. Contact your agent or email the listing agent with any questions.
-
2006-12-23$269,900 304-char remark
Show marketing remark (304 chars)
Hurry and get this under contract before repairs are completed and choose your own colors. Seller is offering $5000 closing help with full price offer, and will reduce price by $10000 and offer $10000 repair allowance if you buy it as-is. Contact your agent or email the listing agent with any questions.
-
2006-09-30historical
-
2006-08-16
-
2000-10-31soldstatus $84,000
-
2000-08-10historical
-
2000-07-28$84,000
-
1999-11-29historical
-
1998-11-30
-
1986-12-31soldstatus $76,000
ⓘ Source: listings_history table (triggers on properties + properties_extension) + one-shot
backfill from property_details.listing_events for pre-trigger history.
Tax reassessment forecast MD · Partial reset (capped growth)
- Current annual tax
- $2,890 · $241/mo
- Projected year-2 tax
- $3,380 · $282/mo
- Expected delta
- +$490/yr (+$41/mo · 17.0%)
ⓘ Screening estimate from a state-policy table — verify with the county assessor before closing.
Climate risk First Street
- Flood 1/10 Low FEMA zone X (unshaded) · 0% chance over 30 yrs
- Wildfire 3/10 Moderate
- Heat 8/10 Severe 7 d/yr ≥102°F today · 15 d/yr by 30 yrs out
- Wind 6/10 Major 27% chance of damaging wind over 30 yrs
- Air quality 4/10 Moderate 4 unhealthy d/yr today · 7 by 30 yrs out
Nearby sold comps map
Loading sold comps map…
Walkable amenities ~0.75 mi
Loading nearby amenities…
Taxation est. · year 1
- Rental income
- $34,754
- − Mortgage interest
- −$19,886
- − Property taxes
- −$2,890
- − Insurance
- −$1,775
- − Repairs & maintenance
- −$2,780
- − Management
- −$2,780
- − Depreciation
- −$10,327
- Taxable loss
- −$5,684
- Est. tax savings @ 24.0%
- +$1,364
- After-tax cash flow
- $1,815/yr
For passive investors: Depreciation is non-cash, so a rental often shows a tax loss while cash-flowing — sheltering income. Rental losses are passive: they offset passive income freely, and up to $25,000/yr can offset ordinary (W-2) income if you actively participate and your MAGI is under $100k (phasing out to $0 by $150k); unused losses carry forward. On sale, claimed depreciation is recaptured at up to 25%, and gains may owe capital-gains tax (a 1031 exchange can defer both). Figures are a year-1 estimate at your 24.0% rate — not tax advice; consult a CPA.
Schools (NCES district)
- District
- Anne Arundel County Public Schools
- NCES district ID
- 2400060
- Math proficiency
- 20% ▼ -21.00%
- Reading proficiency
- 37% ▼ -13.00%
- Median HH income
- $87,880
- Composite
- 28.52/100
- National rank
- #6733
- State rank
- #10 of 24 in MD
Livability — Odenton
- Score
- 70/100
- State rank
- #161
- US rank
- #7349
Category grades
Schools grade is shown separately in the Schools card above.
Census & demographics
- Census place
- Odenton, MD
- County
- Anne Arundel County · 535,653 people
- City population
- 36,705
- Metro
- Baltimore-Columbia-Towson, MD
- Population (ZIP)
- 36,705
- Household income
- $125,639
- Rent vs Own
- Severe rent burden
- 1190.0
Population outlook (Anne Arundel County) Hauer SSP2
- Today (2025)
- 617,384 people
- By 2030
- 642,094 · +4.0%
- By 2040
- 686,621 · +11.2%
- By 2050
- 723,031 · +17.1%
- By 2075
- 809,346 · +31.1%
- By 2100
- 837,658 · +35.7%
Race, ethnicity, and origin ACS 2023
- Neighborhood character
- Diverse neighborhood (Simpson 0.68)
- Race & ethnicity
- White 46% Black 29% Two or more races 11% Hispanic / Latino 11% Asian 5%
- Hispanic origin (detail)
- Mexican 2% Puerto Rican 4%
- Common ancestry
- Romanian 3% Lithuanian 2% Slovak 1%
- Foreign-born
- 11% · Canada, South Korea, China
- Languages at home
- 83% English-only · Spanish 7% Other Indo-European 2% Chinese 1%
Political lean MEDSL · Anne Arundel
- 2024 margin
- D (+13.9) · D 55.7% · R 41.7% · Other 2.6%
- 2008→2024 swing
- +15.7pp toward D · 2008: -1.8pp · 2024: 13.9pp
- All cycles
- 2024: D+13.9 2020: D+14.5 2016: D+0.7 2012: R+0.9 2008: R+1.8
Not yet ingested
- Civics
- —
Market trends
- HPI YoY
- ▼ -87.76%
- Current HPI
- 273.3267
- Rent YoY
- ▲ 1.98%
- Metro
- Baltimore-Columbia-Towson, MD
- State GDP YoY
- ▲ 2.97%
- F500 in state
- 12
Industry mix (Fortune 500 HQ in MD)
| Industry | F500 HQs | Revenue |
|---|---|---|
| Aerospace / Defense | 1 | $71B |
|
||
| Utilities | 1 | $25B |
|
||
| Hotels | 1 | $24B |
|
||
| Consumer Goods | 1 | $7B |
|
||
| Real Estate | 1 | $6B |
|
||
| Chemicals | 1 | $2B |
|
||
Price history
+380.3% since first listed13 events — show timeline
- 2026-04-22 Coming Soon $365,000 BRIGHT MLS
- 2007-03-19 Sold (MLS) $259,900 MRIS
- 2007-02-20 Sold (Public Records) $182,000 Public Records
- 2007-01-29 Delisted — MRIS
- 2006-12-23 Listed $269,900 MRIS
- 2006-09-30 Delisted — MRIS
- 2006-08-16 Listed — MRIS
- 2000-10-31 Sold (MLS) $84,000 MRIS
- 2000-08-10 Delisted — MRIS
- 2000-07-28 Listed $84,000 MRIS
- 1999-11-29 Delisted — MRIS
- 1998-11-30 Listed — MRIS
- 1986-12-31 Sold (Public Records) $76,000 Public Records
Property tax history
+3.1%/yrLatest (2025): $2,890 · +2.4% YoY. Source: county tax records.
Cash-flow waterfall
monthlySold comps — $/sqft
last 12 mo · ≤1 miLoading sold comps…