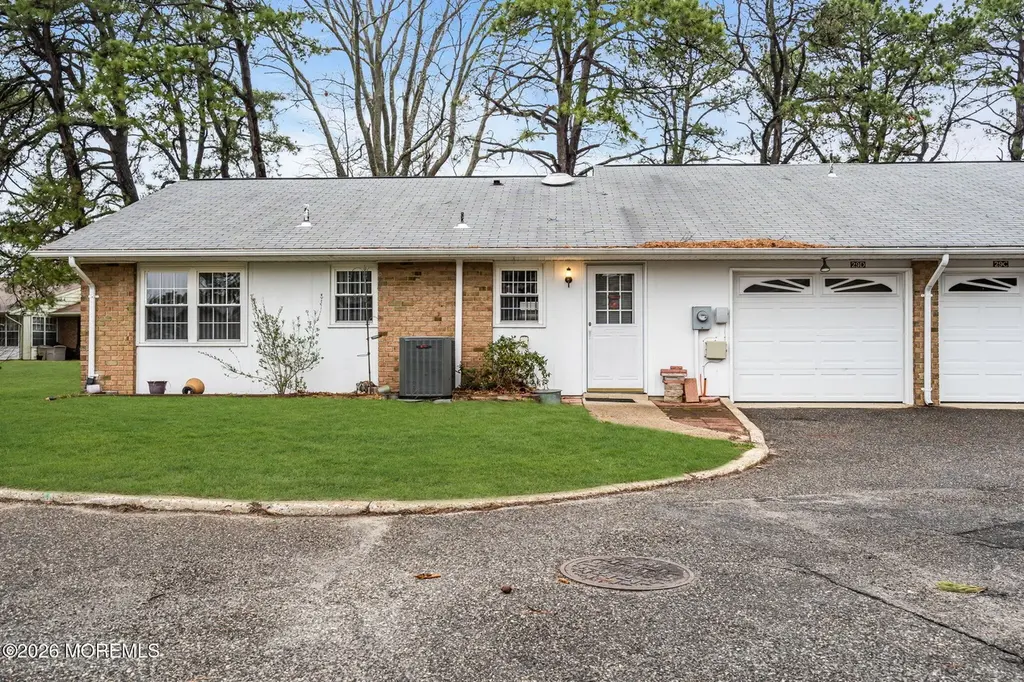
29 Edinburgh Ln Unit D · Leisure Village West, NJ
Flood risk 1/10 · Minimal
- FEMA flood zone
- X (unshaded)
- Chance of flooding over 30 yrs
- 0.0%
- Est. flood insurance / yr
- $507 – $1,088
Fire risk 4/10 · Minor
- Est. fire insurance / yr
- $526 – $976
Heat risk 7/10 · Major
- Hot days now (above 102°F)
- 7 days/yr
- Hot days in 30 yrs
- 16 days/yr
Wind risk 6/10 · Moderate
- Chance of severe wind over 30 yrs
- 64.0%
Air-quality risk 3/10 · Minor
- Unhealthy air days now
- 3 days/yr
- Unhealthy air days in 30 yrs
- 4 days/yr
Risk factors via First Street. Map © Google.
Why this score? — see what drove the D+ grade
The composite is a weighted blend of 9 inputs, each scored 0–100. Each bar is that input's sub-score; the figure is the points it added to the 100-point composite (weight × sub-score).
- Cash flow +14.5/30.0
- ARV discount +8.0/15.0
- 1% rule +6.4/10.0
- DSCR +4.4/10.0
- Condition / age +3.8/5.0
- Livability +3.5/5.0
- Schools +2.9/10.0
- Rent growth +2.5/5.0
- Appreciation +0.0/10.0
$218,900
🖨 Deal sheet (PDF) 📄 Offer letter ✓ Due diligence
Listing remarks
Welcome to this beautifully updated Baronet model in the sought-after 55+ community of Leisure Village West. This 2-bedroom, 1.5-bath home features newer vinyl flooring throughout. The kitchen offers beveled-edge counters, a countertop range, wall oven and tile backsplash. The main bath is fully renovated with an oversized stall shower. Additional highlights include a half bath, pull down attic and attached direct entry garage. There are newer windows, 6-panel doors, water heater and C/A. Enjoy year-round comfort in the four-season sunroom with heat and A/C perfect for entertaining or just relaxing. Leisure Village West offers a wealth of clubs and activities for your enjoyment.
Key facts
- Newer vinyl flooring
- Tile backsplash
- 6,098 sq ft lot
Tags
Neighborhood map
What this means for you Summary
Snapshot
- This is a 2-bed/1.5-bath single-family listed at $219k. Condition is rated good.
Deal economics
- At list price, monthly cash flow is $50 ($598/yr) — positive.
- The deal already cash-flows at list — no discount required.
- Meets the 1% rule at list price ($2k rent vs $219k).
- Recommended offer: $216k (1.5% below list) — sets the bar for market timing.
Location & tenants
- Location reads 70/100 on livability (#261 in NJ) — a middle-class / working-renter tenant base. Strengths: crime A+, housing A+, employment B+; Watch: amenities F, commute F.
- Manchester Township School District (suburban): math 25% / reading 44% proficiency, ranked #320 of 472 in NJ (top 68%) — families likely to look elsewhere, expect single-tenant / working-renter base with shorter leases.
- Zoned schools: Manchester Township Elementary School (math 22% / reading 46%, grade F, #642 of 1,303 statewide, top 50%, 514 students, 45% FRL); Manchester Township Middle School (math 28% / reading 45%, grade F, #226 of 431 statewide, top 55%, 582 students, 41% FRL); Manchester Township High School (math 21% / reading 38%, grade F, #290 of 399 statewide, top 74%, 959 students, 38% FRL) — zoned schools average 42% FRL vs 23% district-wide (19 pts higher); higher-poverty schools than district average — tighter screening recommended.
- Market conditions: 658 active listings in the ZIP; 9 comparable units currently listed for rent nearby; rentals lingering (median 46d on market — plan ~5-8 weeks vacancy on turnover, expect pricing pressure); 56% of comp listings sitting > 30 days — soft ceiling on asking rent; 4,434 units permitted in Ocean County in 2024 (868 in 5+ unit buildings).
Forward outlook
- Local home prices are declining (-3.0%/yr); year-one equity from $2k of loan paydown is wiped out by about $7k of value loss. Plan a longer hold.
- Ocean County population projected to shrink 8% by 2050 — rents likely to lag national; underwrite the cash flow, not the appreciation.
Negotiation context
- It's been on market 19 days — a 2% lower offer ($216k) is reasonable based on typical stale-listing flexibility.
Risks & watch-outs
- Climate carrying-cost: major wind risk, 64% chance of damaging wind over 30y; extreme-heat days projected 7→16/yr by 2055 (HVAC capex compounding) — expect insurance premiums to compound above CPI over the hold.
Questions for the listing agent
- Built in 1970 — when were the roof, HVAC, electrical panel, plumbing, and water heater last replaced?
- What does the HOA fee cover, when was the last increase, and are there any pending special assessments or reserve-fund shortfalls?
- Is there a deadline driving the sale (1031 exchange, divorce, estate, relocation)? That informs how much negotiation room exists.
- Schools are F-rated, which usually means shorter tenancies and higher turnover. Who's the typical renter profile here, and what's been the actual vacancy rate?
- The area grade is low — what's the realistic commute time and amenity access for the typical tenant pool here? Any planned neighborhood developments (good or bad) we should know about?
- What's the average days-on-market for RENTAL listings here right now (not sales)? A rising rental-DOM trend means longer vacancies and softer asking-rent achievability than the comps imply.
- What's the recent tenant-quality profile in this submarket — average credit score on applications, eviction rate, late-payment / NSF rate, and stable-employment percentage? A property-management company in the area should have these aggregated.
- How much new for-sale + rental construction is in the pipeline within 1–3 miles? Heavy new supply typically softens prices + rents 12–24 months out; constrained supply supports both.
Investment metrics
- 1% rule
- 1.14% ✓
- Cap rate
- 6.57%
- Cash-on-cash
- 0.98%
- DSCR
- 1.04
- GRM
- 7.3
CMA / ARV
- ARV (on-the-fly)
- $221,376
- Comps found
- 12
Show comp detail 12 sales within ~0.75 mi
| Address | Dist | Beds/Ba | Sqft | Sold | Price | $/sf | Match |
|---|---|---|---|---|---|---|---|
| 22 Edinburgh Ln Unit D | 0.08mi | 2/1.5 | 1,050 (-9%) | 4mo | $255,000 | $243 | 78 |
| 32B Edinburgh Ln | 0.08mi | 2/2.5 | 1,050 (-9%) | 1mo | $172,500 | $164 | 76 |
| 78D Buckingham Dr N | 0.15mi | 2/2.0 | 1,238 (+7%) | 5mo | $282,000 | $228 | 75 |
| 110 Buckingham Dr Unit B | 0.08mi | 2/2.0 | 1,267 (+10%) | 4mo | $190,000 | $150 | 74 |
| 32C Yorkshire Ct | 0.23mi | 2/1.5 | 1,050 (-9%) | 1mo | $190,000 | $181 | 74 |
| 56B Buckingham Dr | 0.23mi | 2/2.0 | 1,238 (+7%) | 3mo | $212,900 | $172 | 72 |
| 4b Cambridge Cir | 0.24mi | 2/2.0 | 1,238 (+7%) | 3mo | $210,000 | $170 | 72 |
| 478A Buckingham Dr | 0.49mi | 2/2.0 | 1,164 (+1%) | 3mo | $259,000 | $223 | 71 |
| 22B Buckingham Dr | 0.33mi | 2/2.0 | 1,065 (-8%) | 5mo | $205,000 | $192 | 66 |
| 6D Gramercy Ln | 0.47mi | 2/1.5 | 1,050 (-9%) | 2mo | $275,000 | $262 | 61 |
| 61 Cambridge Cir Unit B | 0.43mi | 2/1.5 | 1,050 (-9%) | 5mo | $249,000 | $237 | 61 |
| 655-A Pulham Ct | 0.60mi | 2/2.0 | 1,243 (+8%) | 2mo | $225,000 | $181 | 56 |
Match score weights: distance 35% · size 25% · config 20% · recency 20%. Top-matched comps best support the ARV.
Projected returns pro-forma
-3.0% appreciation · 3.0% rent growth · sell at horizon
- IRR
- -14.6%
- Equity multiple
- 0.48×
- Total profit
- $-32,010
- Equity at exit
- $32,639
- IRR
- -5.7%
- Equity multiple
- 0.63×
- Total profit
- $-22,625
- Equity at exit
- $18,926
Cash invested: $61,292 (down + closing). Projections, not guarantees.
Landlord ↔ Tenant lean methodology
- Overall (STATE)
- 21 Tenant-Leaning
- State New Jersey
- 21 Tenant-Leaning · D+6
- County
- — inherits STATE
- City
- — inherits STATE
ZIP-level market 08759
- Active inventory
- 658
- Price-to-rent
- 7.3×
Monthly cashflow live
- Estimated rent
- $2,489 high interval (Pro) →
- Mortgage (P&I)
- −$1,148
- Tax est. 1.5%
- −$274 /mo · $3,284/yr
- Insurance
- −$91
- HOA
- −$404
- Vacancy / Maint / Mgmt
- −$523
- Net cashflow
- $50
Break-even live
Sensitivity live
| Price | -10% $201 | -5% $125 | +0% $50 | +5% $-26 | +10% $-101 |
|---|---|---|---|---|---|
| Rent | -10% $-147 | -5% $-48 | +0% $50 | +5% $148 | +10% $247 |
| Rate | -1.0pp $160 | -0.5pp $106 | base $50 | +0.5pp $-7 | +1.0pp $-65 |
UW: 25.0% down · 7.5% · 30yr · 1.5% tax · 5.0% vac · 8.0% maint · 8.0% mgmt
Financing live
Cash to close
- Down payment
- $54,725
- Closing costs
- $6,567
- Reserves months
- —
- Total cash needed
- —
Loan-product check · same deal, 3 products live
Conventional
25% down · 7.5% · 30yr
- Down + closing
- —
- Monthly P&I
- —
- Monthly cashflow
- —
- DSCR
- —
- Eligible?
- —
Personal DTI + credit; lowest rate.
DSCR
20% down · 8.5% · 30yr
- Down + closing
- —
- Monthly P&I
- —
- Monthly cashflow
- —
- DSCR
- —
- Eligible?
- —
No personal income docs; deal must DSCR.
Hard money
10% down · 12.0% · 12mo
- Down + closing
- —
- Monthly P&I
- —
- Monthly cashflow
- —
- DSCR
- —
- Eligible?
- —
Short-term bridge; refi at stabilization.
Rent comps 9 comps
| Address | Beds | Baths | Sqft | Rent | $/sqft | DOM | Units | Dist |
|---|---|---|---|---|---|---|---|---|
| 43C Edinburgh Ln Manchester, NJ | 2.0 | 1.0 | 836 | $2,200 | $2.63 | 45d | 1 | 0.07mi |
| 1033 Birmingham Ave Toms River, NJ | 3.0 | 1.5 | 1250 | $2,700 | $2.16 | 0d | 1 | 0.74mi |
| 1425 Amsterdam Ave Toms River, NJ | 3.0 | 2.0 | 1376 | $3,500 | $2.54 | 45d | 1 | 0.77mi |
| 1540 Birmingham Ave Toms River, NJ | 3.0 | 2.0 | 1350 | $2,900 | $2.15 | 45d | 1 | 1.02mi |
| 73 Buckingham Dr N Manchester, NJ | 2.0 | 2.0 | 967 | $2,200 | $2.28 | 45d | 1 | 1.02mi |
| 150 Farm Rd Manchester, NJ | 3.0 | 2.0 | 1280 | $3,000 | $2.34 | 24d | 1 | 1.19mi |
| 501 Bismarck St Toms River, NJ | 3.0 | 1.0 | 1300 | $2,775 | $2.13 | 45d | 1 | 1.22mi |
| 1700 New Jersey 37 Unit 112-11 Toms River, NJ | 2.0 | 2.0 | 1224 | $2,299 | $1.88 | 0d | 1 | 1.44mi |
| 2035 Route 37 Manchester, NJ | 2.0 | 2.0 | 1375 | $2,775 | $2.02 | 0d | 3 | 1.49mi |
HOA detail
- Monthly dues
- $404 · $4,848/yr
- Likely covers
- water
Listing history 2 events
-
2026-04-25status Pending
-
2026-04-06$218,900 Active
ⓘ Source: listings_history table (triggers on properties + properties_extension) + one-shot
backfill from property_details.listing_events for pre-trigger history.
Climate risk First Street
- Flood 1/10 Low FEMA zone X (unshaded) · 0% chance over 30 yrs
- Wildfire 4/10 Moderate
- Heat 7/10 Severe 7 d/yr ≥102°F today · 16 d/yr by 30 yrs out
- Wind 6/10 Major 64% chance of damaging wind over 30 yrs
- Air quality 3/10 Moderate 3 unhealthy d/yr today · 4 by 30 yrs out
Nearby sold comps map
Loading sold comps map…
Walkable amenities ~0.75 mi
Loading nearby amenities…
Taxation est. · year 1
- Rental income
- $29,873
- − Mortgage interest
- −$12,262
- − Property taxes
- −$3,284
- − Insurance
- −$1,094
- − Repairs & maintenance
- −$2,390
- − Management
- −$2,390
- − HOA
- −$4,848
- − Depreciation
- −$6,368
- Taxable loss
- −$2,763
- Est. tax savings @ 24.0%
- +$663
- After-tax cash flow
- $1,261/yr
For passive investors: Depreciation is non-cash, so a rental often shows a tax loss while cash-flowing — sheltering income. Rental losses are passive: they offset passive income freely, and up to $25,000/yr can offset ordinary (W-2) income if you actively participate and your MAGI is under $100k (phasing out to $0 by $150k); unused losses carry forward. On sale, claimed depreciation is recaptured at up to 25%, and gains may owe capital-gains tax (a 1031 exchange can defer both). Figures are a year-1 estimate at your 24.0% rate — not tax advice; consult a CPA.
Condition & rehab AI · 12 photos
This 2-bedroom, 1.5-bath home in Leisure Village West is in good condition with recent updates and improvements, making it a solid investment opportunity.
Value-add opportunities
- Both Painting exterior and interior walls — Enhances curb appeal and interior aesthetics.
- Both Landscaping improvements — Enhances curb appeal and adds value.
- Both Newer windows and doors — Improves energy efficiency and enhances curb appeal.
- Resale Kitchen backsplash and countertop — Modernizes the kitchen and adds value for potential buyers.
Renovation cost estimate screening
Value-add ROI direction
- Both Painting exterior and interior walls — Enhances curb appeal and interior aesthetics. ↑
- Both Landscaping improvements — Enhances curb appeal and adds value. ↑
- Both Newer windows and doors — Improves energy efficiency and enhances curb appeal. ↑
- Resale Kitchen backsplash and countertop — Modernizes the kitchen and adds value for potential buyers. ↑
ⓘ Cost ranges are severity-bucket heuristics (US national rule-of-thumb). Get contractor quotes + a written scope before underwriting a rehab budget.
Schools (NCES district)
- District
- Manchester Township School District
- NCES district ID
- 3409450
- Math proficiency
- 25% ▼ -17.00%
- Reading proficiency
- 44% ▼ -5.00%
- Median HH income
- $38,905
- Composite
- 28.8/100
- National rank
- #6662
- State rank
- #320 of 472 in NJ
Livability — Leisure Village West
- Score
- 70/100
- State rank
- #261
- US rank
- #7714
Category grades
Schools grade is shown separately in the Schools card above.
Census & demographics
- Census place
- Leisure Village West, NJ
- Population (ZIP)
- 34,290
Population outlook (Ocean County) Hauer SSP2
- Today (2025)
- 586,991 people
- By 2030
- 581,403 · -1.0%
- By 2040
- 564,913 · -3.8%
- By 2050
- 538,149 · -8.3%
- By 2075
- 468,845 · -20.1%
- By 2100
- 350,297 · -40.3%
Race, ethnicity, and origin ACS 2023
- Neighborhood character
- Predominantly White (87%)
- Race & ethnicity
- White 87% Hispanic / Latino 5% Black 4% Two or more races 4% Asian 2%
- Hispanic origin (detail)
- Puerto Rican 2%
- Common ancestry
- Romanian 8% Scotch-Irish 2% Lithuanian 2%
- Foreign-born
- 11% · Canada, China
- Languages at home
- 88% English-only · Spanish 3% Russian/Polish/Slavic 2% Other Indo-European 2%
Political lean MEDSL · Ocean
- 2024 margin
- Solid R (+36.0) · D 31.4% · R 67.4% · Other 1.2%
- 2008→2024 swing
- -17.6pp toward R · 2008: -18.4pp · 2024: -36.0pp
- All cycles
- 2024: R+36.0 2020: R+28.7 2016: R+34.0 2012: R+17.7 2008: R+18.4
Not yet ingested
- Civics
- —
Market trends
- HPI YoY
- ▼ -347.85%
- Current HPI
- 274.4679
- Rent YoY
- —
- Metro
- —
- State GDP YoY
- ▲ 2.05%
- F500 in state
- 34
Industry mix (Fortune 500 HQ in NJ)
| Industry | F500 HQs | Revenue |
|---|---|---|
| Consumer Goods | 3 | $31B |
|
||
| Pharmaceuticals | 2 | $153B |
|
||
| Technology | 2 | $21B |
|
||
| Insurance | 2 | $20B |
|
||
| Healthcare | 2 | $19B |
|
||
| Financial Services | 1 | $70B |
|
||
Price history
2 events — show timeline
- 2026-04-25 Pending — MOMLS
- 2026-04-06 Listed $218,900 MOMLS
Cash-flow waterfall
monthlySold comps — $/sqft
last 12 mo · ≤1 miLoading sold comps…