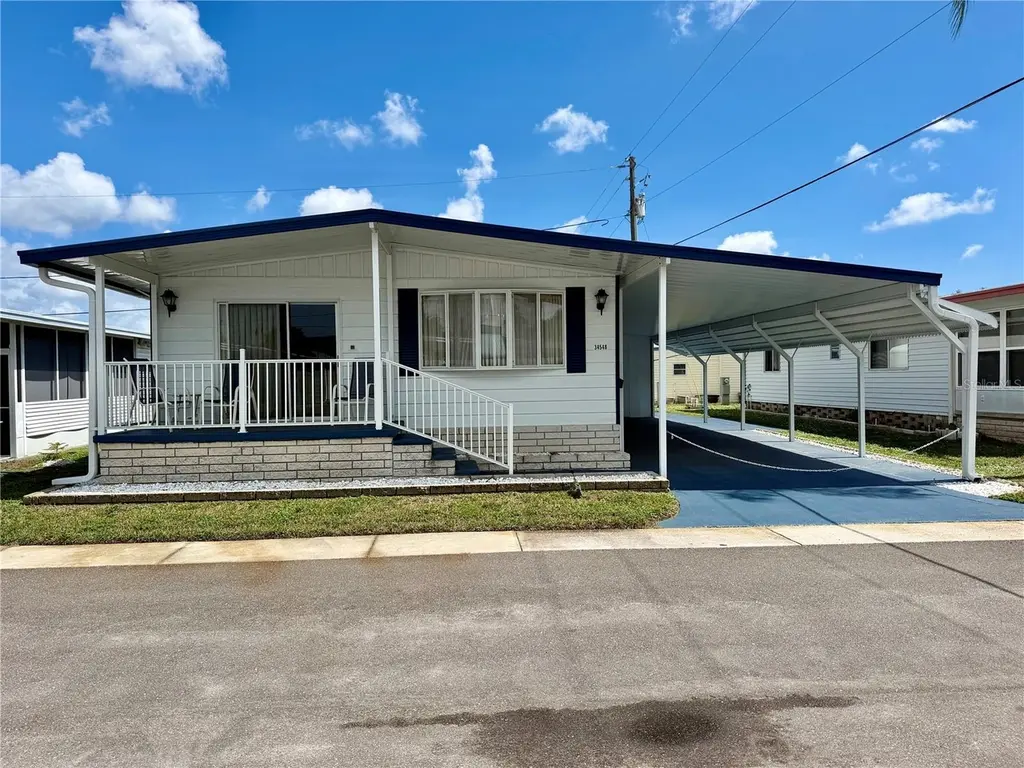
34548 Violet Dr N · Pinellas Park, FL
Flood risk 5/10 · Moderate
- FEMA flood zone
- X (unshaded)
- Chance of flooding over 30 yrs
- 0.51%
- Est. flood insurance / yr
- $507 – $1,088
Fire risk 1/10 · Minimal
- Est. fire insurance / yr
- $947 – $1,759
Heat risk 10/10 · Severe
- Hot days now (above 106°F)
- 6 days/yr
- Hot days in 30 yrs
- 21 days/yr
Wind risk 10/10 · Severe
- Chance of severe wind over 30 yrs
- 99.0%
Air-quality risk 4/10 · Minor
- Unhealthy air days now
- 4 days/yr
- Unhealthy air days in 30 yrs
- 4 days/yr
Risk factors via First Street. Map © Google.
Why this score? — see what drove the C+ grade
The composite is a weighted blend of 9 inputs, each scored 0–100. Each bar is that input's sub-score; the figure is the points it added to the 100-point composite (weight × sub-score).
- Cash flow +28.4/30.0
- DSCR +10.0/10.0
- 1% rule +9.5/10.0
- Schools +4.3/10.0
- Livability +3.9/5.0
- ARV discount +3.7/15.0
- Condition / age +2.5/5.0
- Rent growth +1.8/5.0
- Appreciation +0.0/10.0
$139,900
🖨 Deal sheet 📄 Offer letter ✓ Due diligence
Listing remarks
Sunset Palms was rated TOP 5 retirement communities for 2025! Well maintained home with lots of updates: New carport/front porch covering/Gutters/extended carport and painted driveway in 2025… HVAC 8/2024… thermal PANE WINDOWS… fresh exterior paint… recently installed vapor barrier… an aluminum ROOF-OVER in 2008/resealed 2025, partially updated bathrooms, newer o vinyl plank tiles, and part of the home, etc. Home features an inside laundry room, very spacious living area, bedrooms and bathrooms. This price includes the Share, valued at $55,000! Sunset Palms is Inexpensive living at only $210 per month which includes all the amenities one could want; owned
Key facts
- New carport
- Hvac
- Painted driveway
Tags
Property features AI
Finance
- Other: Lease restrictions apply
- Financial info: Total monthly fees $210, total annual fees $2,520; Association approval required; Turnkey (furnished)
- HOA & community: Has HOA (monthly fee $210); Association amenities include clubhouse, fitness center, pool, spa/hot tub, shuffleboard court, recreation facilities, laundry, maintenance; Association fee includes common area taxes, pool, escrow reserves, grounds maintenance, management, private road, recreational facilities, sewer, trash, water; Buyer approval required for community; Senior community; No pets allowed; On-site property manager
Exterior
- Parking: Carport with 2 spaces
- Utilities: Public water; Public sewer; Electricity connected; Water connected; Cable available; Broadband/high-speed internet available
- Home design: Residential mobile home (double wide); One story; Faces northeast
- Construction: Metal siding; Roof over
- Exterior features: Exterior lighting; Asphalt/paved road; Private maintained road
Interior
- Kitchen: Dishwasher; Range; Microwave; Refrigerator; Eat-in kitchen
- Bedrooms: 2 bedrooms
- Flooring: Carpet; Linoleum
- Bathrooms: 2 full bathrooms
- Heating & cooling: Central heating (electric); Central air conditioning
- Interior features: Built-in features; Ceiling fans; Eat-in kitchen; Walk-in closets; Drapes; Thermal windows; Inside utility
- Laundry & utility: Washer; Dryer; Laundry area in kitchen; Inside utility
Neighborhood map
What this means for you Summary
Snapshot
- This is a 2-bed/2.0-bath manufactured listed at $140k.
Deal economics
- At list price, monthly cash flow is $454 ($5k/yr) — positive.
- The deal already cash-flows at list — no discount required.
- Meets the 1% rule at list price ($2k rent vs $140k).
- Recommended offer: $138k (1.5% below list) — sets the bar for market timing.
- Cap rate 10.2% vs local median 4.0% in Pinellas Park — top-decile yield for the area; either an underpriced asset or a hidden risk that comps aren't pricing in. Stress-test before assuming the spread holds.
Location & tenants
- Location reads 78/100 on livability (#170 in FL, #2,546 nationally) — a middle-class / working-renter tenant base. Strengths: commute A+, cost of living A+, housing A+; Watch: employment D+, schools D-, amenities F.
- Pinellas (suburban): math 51% / reading 51% proficiency, ranked #31 of 73 in FL (top 42%) — acceptable for families but not a draw, mixed tenant base, ~2y average lease.
- Market conditions: Rents soft (-3.0%/yr); 226 active listings in the ZIP; 26 comparable units currently listed for rent nearby; rentals at typical pace (median 22d on market — plan ~3-4 weeks tenant-placement turnaround); 2,676 units permitted in Pinellas County in 2024 (1,422 in 5+ unit buildings).
- This rent runs 42% of the median local income ($58k/yr) — at the standard rent-burdened threshold; future hikes will face affordability resistance.
Forward outlook
- Local home prices are declining (-3.0%/yr); year-one equity from $967 of loan paydown is wiped out by about $4k of value loss. Plan a longer hold.
- Pinellas County population projected at +14% by 2050 — modest demand growth; plan on rents tracking national, not racing it.
Negotiation context
- It's been on market 16 days — a 2% lower offer ($138k) is reasonable based on typical stale-listing flexibility.
Risks & watch-outs
- Climate carrying-cost: moderate flood risk; severe wind risk, 99% chance of damaging wind over 30y; extreme-heat days projected 6→21/yr by 2055 (HVAC capex compounding) — expect insurance premiums to compound above CPI over the hold.
Questions for the listing agent
- Built in 1973 — when were the roof, HVAC, electrical panel, plumbing, and water heater last replaced?
- What does the HOA fee cover, when was the last increase, and are there any pending special assessments or reserve-fund shortfalls?
- Is there a deadline driving the sale (1031 exchange, divorce, estate, relocation)? That informs how much negotiation room exists.
- Schools are D-rated, which usually means shorter tenancies and higher turnover. Who's the typical renter profile here, and what's been the actual vacancy rate?
- What's the average days-on-market for RENTAL listings here right now (not sales)? A rising rental-DOM trend means longer vacancies and softer asking-rent achievability than the comps imply.
- What's the recent tenant-quality profile in this submarket — average credit score on applications, eviction rate, late-payment / NSF rate, and stable-employment percentage? A property-management company in the area should have these aggregated.
- How much new for-sale + rental construction is in the pipeline within 1–3 miles? Heavy new supply typically softens prices + rents 12–24 months out; constrained supply supports both.
Investment metrics
- 1% rule
- 1.45% ✓
- Cap rate
- 10.19%
- Cash-on-cash
- 13.91%
- DSCR
- 1.62
- GRM
- 5.7
CMA / ARV
- ARV (on-the-fly)
- $129,024
- Comps found
- 10
Show comp detail 10 sales within ~0.75 mi
| Address | Dist | Beds/Ba | Sqft | Sold | Price | $/sf | Match |
|---|---|---|---|---|---|---|---|
| 34098 Cherry Dr N | 0.06mi | 2/2.0 | 1,128 (-2%) | 2mo | $125,000 | $111 | 92 |
| 34657 Orange Dr N | 0.19mi | 2/2.0 | 1,152 (0%) | 4mo | $128,000 | $111 | 88 |
| 34479 Cactus Dr N | 0.06mi | 2/2.0 | 1,056 (-8%) | 2mo | $118,500 | $112 | 82 |
| 34541 Violet Dr N | 0.03mi | 2/2.0 | 1,008 (-12%) | 1mo | $110,000 | $109 | 77 |
| 82121 B St N #121 | 0.28mi | 2/2.0 | 1,144 (-1%) | 13mo | $165,000 | $144 | 75 |
| 82425 New Circle Dr N | 0.40mi | 2/2.0 | 1,144 (-1%) | 6mo | $130,500 | $114 | 75 |
| 82402 New Circle Dr N #402 | 0.38mi | 2/2.0 | 1,144 (-1%) | 9mo | $120,000 | $105 | 74 |
| 82226 F St N #226 | 0.28mi | 2/2.0 | 1,056 (-8%) | 10mo | $175,000 | $166 | 65 |
| 82009 A St N #9 | 0.32mi | 2/2.0 | 1,060 (-8%) | 12mo | $139,900 | $132 | 62 |
| 82177 E St N #177 | 0.25mi | 2/2.0 | 1,008 (-12%) | 9mo | $30,000 | $30 | 60 |
Match score weights: distance 35% · size 25% · config 20% · recency 20%. Top-matched comps best support the ARV.
Projected returns pro-forma
-3.0% appreciation · 0.0% rent growth · sell at horizon
- IRR
- 0.3%
- Equity multiple
- 1.01×
- Total profit
- $431
- Equity at exit
- $20,860
- IRR
- 6.1%
- Equity multiple
- 1.39×
- Total profit
- $15,172
- Equity at exit
- $12,096
Cash invested: $39,172 (down + closing). Projections, not guarantees.
Landlord ↔ Tenant lean methodology
- Overall (STATE)
- 87 Strongly Landlord-Friendly
- State Florida
- 87 Strongly Landlord-Friendly · R+3
- County
- — inherits STATE
- City
- — inherits STATE
ZIP-level market 33781
- Rents YoY
- -3.0%
- Active inventory
- 226
- Price-to-rent
- 5.7×
Monthly cashflow live
- Estimated rent
- $2,033 high interval (Pro) →
- Mortgage (P&I)
- −$734
- Tax from tax record
- −$150 /mo · $1,799/yr
- Insurance
- −$58
- HOA
- −$210
- Vacancy / Maint / Mgmt
- −$427
- Net cashflow
- $454
Break-even live
UW: 25.0% down · 7.5% · 30yr · 1.5% tax · 5.0% vac · 8.0% maint · 8.0% mgmt
Financing live
Cash to close
- Down payment
- $34,975
- Closing costs
- $4,197
- Reserves months
- —
- Total cash needed
- —
Loan-product check · same deal, 3 products live
Conventional
25% down · 7.5% · 30yr
- Down + closing
- —
- Monthly P&I
- —
- Monthly cashflow
- —
- DSCR
- —
- Eligible?
- —
Personal DTI + credit; lowest rate.
DSCR
20% down · 8.5% · 30yr
- Down + closing
- —
- Monthly P&I
- —
- Monthly cashflow
- —
- DSCR
- —
- Eligible?
- —
No personal income docs; deal must DSCR.
Hard money
10% down · 12.0% · 12mo
- Down + closing
- —
- Monthly P&I
- —
- Monthly cashflow
- —
- DSCR
- —
- Eligible?
- —
Short-term bridge; refi at stabilization.
Rent comps 26 comps
| Address | Beds | Baths | Sqft | Rent | $/sqft | DOM | Units | Dist |
|---|---|---|---|---|---|---|---|---|
| 4071 76th Ave N Pinellas Park, FL | 2.0 | 1.0 | 700 | $1,724 | $2.46 | 3d | 3 | 0.49mi |
| 3110 Grand Ave Pinellas Park, FL | 1.0–3.0 | 1.0–2.0 | 1104 | $2,467 | $2.23 | 2d | 34 | 0.51mi |
| 4355 84th Ave N Pinellas Park, FL | 1.0 | 1.0 | 700 | $1,550 | $2.21 | 2d | 10 | 0.66mi |
| 8851 US Highway 19 N Pinellas Park, FL | 1.0–3.0 | 1.0–2.0 | 993 | $2,295 | $2.31 | 2d | 23 | 0.66mi |
| 4057 71st Ter N Pinellas Park, FL | 3.0 | 2.5 | 1420 | $2,650 | $1.87 | 4d | 1 | 0.71mi |
| 4520 76th Ave N Pinellas Park, FL | 2.0 | 1.0 | 700 | $1,545 | $2.21 | 24d | 1 | 0.81mi |
| 2790 Grand Ave Saint Petersburg, FL | 1.0–3.0 | 1.0–2.0 | 1017 | $2,782 | $2.73 | 2d | 16 | 0.86mi |
| 3715 66th Ave N Unit B Pinellas Park, FL | 2.0 | 1.0 | 750 | $1,475 | $1.97 | 22d | 1 | 0.95mi |
| 4771 78th Ave N Pinellas Park, FL | 2.0 | 2.0 | 903 | $1,640 | $1.82 | 24d | 1 | 0.97mi |
| 4701 88th Ave N Pinellas Park, FL | 1.0–2.0 | 1.0–2.0 | 855 | $1,853 | $2.17 | 10d | 20 | 1.00mi |
| 4675 72nd Ave N Pinellas Park, FL | 2.0 | 1.0 | 750 | $1,649 | $2.20 | 22d | 1 | 1.05mi |
| 4631 69th Pl N Pinellas Park, FL | 3.0 | 2.5 | 1420 | $2,595 | $1.83 | 24d | 1 | 1.11mi |
| 8400 49th St N Pinellas Park, FL | 1.0–2.0 | 1.0–2.0 | 707 | $1,749 | $2.47 | 2d | 22 | 1.13mi |
| 4940 87th Ave Unit C Pinellas Park, FL | 2.0 | 1.0 | 700 | $2,600 | $3.71 | 24d | 1 | 1.15mi |
| 7050 48th St N Pinellas Park, FL | 3.0 | 1.5 | 1008 | $2,350 | $2.33 | 24d | 1 | 1.19mi |
| 6898 47th Ln N Pinellas Park, FL | 3.0 | 2.5 | 1500 | $2,525 | $1.68 | 24d | 1 | 1.23mi |
| 4732 68th Ave N Pinellas Park, FL | 2.0 | 3.0 | 1210 | $2,000 | $1.65 | 24d | 1 | 1.26mi |
| 5060 76th Ave N #409 Pinellas Park, FL | 1.0 | 1.0 | 750 | $1,295 | $1.73 | 22d | 1 | 1.27mi |
| 6379 29th St N Saint Petersburg, FL | 3.0 | 2.0 | 1323 | $2,869 | $2.17 | 24d | 1 | 1.28mi |
| 7800 52nd St N Pinellas Park, FL | 3.0 | 1.0 | 1163 | $1,850 | $1.59 | 24d | 1 | 1.32mi |
| 4973 91st Ave Unit C Pinellas Park, FL | 2.0 | 2.0 | 875 | $1,475 | $1.69 | 14d | 1 | 1.32mi |
| 4973 91st Ave Unit 12 (C) Pinellas Park, FL | 2.0 | 2.0 | 875 | $1,475 | $1.69 | 15d | 1 | 1.32mi |
| 9505 49th St N Pinellas Park, FL | 1.0–3.0 | 1.0–2.0 | 1049 | $2,297 | $2.19 | 2d | 19 | 1.34mi |
| 2715 63rd Ter N Unit B St. Petersburg, FL | 2.0 | 2.0 | 1030 | $1,900 | $1.84 | 24d | 1 | 1.35mi |
| 2734 62nd Ave N Apt 3 St. Petersburg, FL | 2.0 | 1.5 | 833 | $1,895 | $2.27 | 24d | 1 | 1.46mi |
| 4091 58th Ave N Unit F St. Petersburg, FL | 2.0 | 1.0 | 900 | $1,595 | $1.77 | 3d | 1 | 1.47mi |
HOA detail
- Monthly dues
- $210 · $2,520/yr
Listing history 11 events
-
2026-06-18days on market $139,900 Active 16 DOM
-
2026-06-17days on market $139,900 Active 15 DOM
-
2026-06-16days on market $139,900 Active 14 DOM
-
2026-06-15days on market $139,900 Active 13 DOM
-
2026-06-13days on market $139,900 Active 11 DOM
-
2026-06-09days on market $139,900 Active 7 DOM
-
2026-06-08days on market $139,900 Active 6 DOM
-
2026-06-07days on market $139,900 Active 5 DOM
-
2026-06-04days on market $139,900 Active 2 DOM
-
2026-06-02remarks 664-char remark
-
2026-06-02$139,900 Active 1 DOM
ⓘ Source: listings_history table (triggers on properties + properties_extension) + one-shot
backfill from property_details.listing_events for pre-trigger history.
Tax reassessment forecast FL · Resets to sale price
- Current annual tax
- $1,799 · $150/mo
- Projected year-2 tax
- $1,799 · $150/mo
- Expected delta
- $0/yr ($0/mo · 0.0%)
ⓘ Screening estimate from a state-policy table — verify with the county assessor before closing.
Climate risk First Street
- Flood 5/10 Major FEMA zone X (unshaded) · 51% chance over 30 yrs
- Wildfire 1/10 Low
- Heat 10/10 Extreme 6 d/yr ≥106°F today · 21 d/yr by 30 yrs out
- Wind 10/10 Extreme 99% chance of damaging wind over 30 yrs
- Air quality 4/10 Moderate 4 unhealthy d/yr today · 4 by 30 yrs out
Nearby sold comps map
Loading sold comps map…
Walkable amenities ~0.75 mi
Loading nearby amenities…
Taxation est. · year 1
- Rental income
- $24,392
- − Mortgage interest
- −$7,837
- − Property taxes
- −$1,799
- − Insurance
- −$700
- − Repairs & maintenance
- −$1,951
- − Management
- −$1,951
- − HOA
- −$2,520
- − Depreciation
- −$4,070
- Taxable income
- $3,565
- Est. tax owed @ 24.0%
- −$856
- After-tax cash flow
- $4,592/yr
For passive investors: Depreciation is non-cash, so a rental often shows a tax loss while cash-flowing — sheltering income. Rental losses are passive: they offset passive income freely, and up to $25,000/yr can offset ordinary (W-2) income if you actively participate and your MAGI is under $100k (phasing out to $0 by $150k); unused losses carry forward. On sale, claimed depreciation is recaptured at up to 25%, and gains may owe capital-gains tax (a 1031 exchange can defer both). Figures are a year-1 estimate at your 24.0% rate — not tax advice; consult a CPA.
Schools (NCES district)
- District
- Pinellas
- NCES district ID
- 1201560
- Math proficiency
- 51% ▼ -5.00%
- Reading proficiency
- 51% ▼ -3.00%
- Median HH income
- $46,270
- Composite
- 43.27/100
- National rank
- #3046
- State rank
- #31 of 73 in FL
Livability — Pinellas Park
- Score
- 78/100
- State rank
- #170
- US rank
- #2546
Category grades
Schools grade is shown separately in the Schools card above.
Census & demographics
- Census place
- Pinellas Park, FL
- County
- Pinellas County · 939,478 people
- City population
- 50,533
- Metro
- Tampa-St. Petersburg-Clearwater, FL
- Population (ZIP)
- 28,072
- Household income
- $57,785
- Rent vs Own
- Severe rent burden
- 1115.0
Population outlook (Pinellas County) Hauer SSP2
- Today (2025)
- 1,027,532 people
- By 2030
- 1,063,586 · +3.5%
- By 2040
- 1,125,020 · +9.5%
- By 2050
- 1,168,637 · +13.7%
- By 2075
- 1,265,188 · +23.1%
- By 2100
- 1,260,357 · +22.7%
Race, ethnicity, and origin ACS 2023
- Neighborhood character
- Diverse neighborhood (Simpson 0.60)
- Race & ethnicity
- White 59% Hispanic / Latino 16% Asian 14% Two or more races 11% Black 7%
- Hispanic origin (detail)
- Mexican 2% Puerto Rican 6% Cuban 5%
- Common ancestry
- Romanian 3% Lithuanian 3% Slovak 2%
- Foreign-born
- 18% · Canada, Vietnam, Jamaica
- Languages at home
- 72% English-only · Spanish 12% Vietnamese 7% Other Asian/Pacific 3%
Political lean MEDSL · Pinellas
- 2024 margin
- Lean R (+5.2) · D 46.9% · R 52.1%
- 2008→2024 swing
- -13.5pp toward R · 2008: 8.3pp · 2024: -5.2pp
- All cycles
- 2024: R+5.2 2020: D+0.2 2016: R+1.1 2012: D+5.6 2008: D+8.3
Not yet ingested
- Civics
- —
Market trends
- HPI YoY
- ▼ -409.77%
- Current HPI
- 348.546
- Rent YoY
- ▼ -2.95%
- Metro
- Tampa-St. Petersburg-Clearwater, FL
- State GDP YoY
- ▲ 3.28%
- F500 in state
- 36
Industry mix (Fortune 500 HQ in FL)
| Industry | F500 HQs | Revenue |
|---|---|---|
| Industrial Technology | 2 | $29B |
|
||
| Insurance | 2 | $17B |
|
||
| Retail | 1 | $60B |
|
||
| Technology Distribution | 1 | $58B |
|
||
| Homebuilding | 1 | $35B |
|
||
| Technology Manufacturing | 1 | $35B |
|
||
Price history
1 event — show timeline
- 2026-06-02 Listed $139,900 Stellar MLS as Distributed by MLS Grid
Property tax history
+5.6%/yrLatest (2025): $1,799 · +1.7% YoY. Source: county tax records.
Cash-flow waterfall
monthlySold comps — $/sqft
last 12 mo · ≤1 miLoading sold comps…