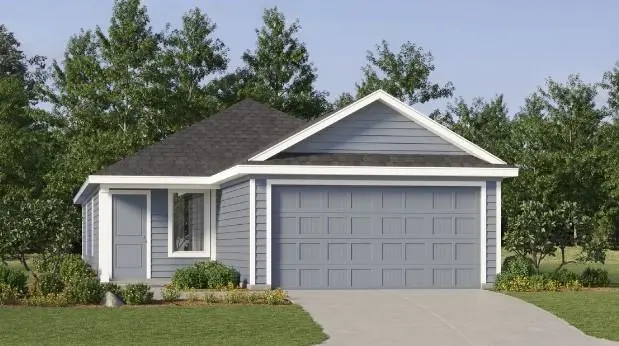
3813 Ontario Way · Sherman, TX
Flood risk No data
- FEMA flood zone
- —
- Chance of flooding over 30 yrs
- —
- Est. flood insurance / yr
- —
Fire risk No data
- Est. fire insurance / yr
- —
Heat risk No data
- Hot days now (above threshold)
- —
- Hot days in 30 yrs
- —
Wind risk No data
- Chance of severe wind over 30 yrs
- —
Air-quality risk No data
- Unhealthy air days now
- —
- Unhealthy air days in 30 yrs
- —
Risk factors via First Street. Map © Google.
Why this score? — see what drove the D- grade
The composite is a weighted blend of 9 inputs, each scored 0–100. Each bar is that input's sub-score; the figure is the points it added to the 100-point composite (weight × sub-score).
- Cash flow +10.5/30.0
- ARV discount +10.4/15.0
- Condition / age +4.0/5.0
- 1% rule +3.6/10.0
- Livability +3.1/5.0
- DSCR +3.0/10.0
- Schools +2.9/10.0
- Rent growth +1.8/5.0
- Appreciation +0.0/10.0
$210,999
🖨 Deal sheet 📄 Offer letter ✓ Due diligence
Listing remarks
LENNAR - Luella Crossing - Idlewood Floorplan This single-level home showcases a spacious open floorplan shared between the kitchen, dining area and family room for easy entertaining, along with access to an outdoor space. An owner’s suite enjoys a private location in a rear corner of the home, complemented by an en-suite bathroom and walk-in closet. There are two secondary bedrooms at the front of the home, ideal for household members and overnight guests.
Key facts
- Walk-in closet
- Open floorplan
- Secondary bedrooms
Tags
Property features AI
Finance
- Other: Energy-efficient features across appliances, construction, doors, insulation, windows, thermostat and enhanced air filtration; Water-conserving low-flow fixtures
- HOA & community: Mandatory HOA with annual fee; association provides full use of facilities and management services
Exterior
- Parking: Attached 2-car garage (approx. 20' wide x 18' deep); 2 covered parking spaces; Garage faces front
- Security: Smoke detectors; Carbon monoxide detectors
- Utilities: City water; City sewer; Curbs and sidewalks
- Home design: Single family residence; One-story (main level living); Property attached: Yes
- Construction: New construction (incomplete) — built 2026; Fiber cement exterior; Composition roof; Smart home features available
- Exterior features: Covered porch(es); Landscaped yard; Sprinkler system; Wood fencing
Interior
- Kitchen: Gas range; Microwave; Dishwasher; Disposal; Kitchen island; Natural stone/granite countertops; Walk-in pantry; Water line to refrigerator; Vented exhaust fan
- Bedrooms: 3 bedrooms, all on the main level; Primary bedroom on the main level with dual sinks and linen closet
- Flooring: Luxury vinyl plank; Other flooring
- Bathrooms: 2 full bathrooms
- Heating & cooling: Central heating; Central air conditioning; Ceiling fans; ENERGY STAR qualified equipment
- Interior features: Open floorplan with kitchen island and pantry; Built-in features; Decorative lighting; Cable TV available; High-speed internet available; Walk-in closet(s)
- Laundry & utility: Tankless water heater
Neighborhood map
What this means for you Summary
Snapshot
- This is a 3-bed/2.0-bath single-family listed at $211k. Condition is rated good.
Deal economics
- At list price, monthly cash flow is $-110 ($-1k/yr) — negative.
- To cash-flow at today's rent, offer at most $195k (7.5% below list).
- To meet the 1% rule (rent ≥ 1% of price), the offer needs to be $181k (14.1% below list).
- Recommended offer: $181k (14.1% below list) — sets the bar for 1% rule.
- Cap rate 5.7% vs local median 3.7% in Sherman — top-decile yield for the area; either an underpriced asset or a hidden risk that comps aren't pricing in. Stress-test before assuming the spread holds.
Location & tenants
- Location reads 61/100 on livability (#1,027 in TX) — a middle-class / working-renter tenant base. Strengths: cost of living A+, housing A+; Watch: crime C-, employment C-, amenities F.
- Sherman ISD (urban): math 31% / reading 37% proficiency, ranked #546 of 826 in TX (top 66%) — families likely to look elsewhere, expect single-tenant / working-renter base with shorter leases.
- Zoned schools: Dillingham El (837 students, 91% FRL) — zoned schools average 91% FRL vs 60% district-wide (32 pts higher); higher-poverty schools than district average — tighter screening recommended.
- Market conditions: Rents soft (-2.7%/yr); 473 active listings in the ZIP; 16 comparable units currently listed for rent nearby; rentals at typical pace (median 21d on market — plan ~3-4 weeks tenant-placement turnaround); 2,272 units permitted in Grayson County in 2024 (750 in 5+ unit buildings).
- This rent runs 39% of the median local income ($56k/yr) — at the standard rent-burdened threshold; future hikes will face affordability resistance.
Forward outlook
- Local home prices are declining (-3.0%/yr); year-one equity from $1k of loan paydown is wiped out by about $6k of value loss. Plan a longer hold.
- Grayson County population projected at +12% by 2050 — modest demand growth; plan on rents tracking national, not racing it.
Negotiation context
- It's been on market 25 days — a 2% lower offer ($208k) is reasonable based on typical stale-listing flexibility.
Questions for the listing agent
- What do current leases actually rent for vs. the listed asking? Can we see a recent rent roll and the last 12 months of T-12 income?
- What does the HOA fee cover, when was the last increase, and are there any pending special assessments or reserve-fund shortfalls?
- Is there a deadline driving the sale (1031 exchange, divorce, estate, relocation)? That informs how much negotiation room exists.
- Schools are D-rated, which usually means shorter tenancies and higher turnover. Who's the typical renter profile here, and what's been the actual vacancy rate?
- The area grade is low — what's the realistic commute time and amenity access for the typical tenant pool here? Any planned neighborhood developments (good or bad) we should know about?
- What's the average days-on-market for RENTAL listings here right now (not sales)? A rising rental-DOM trend means longer vacancies and softer asking-rent achievability than the comps imply.
- What's the recent tenant-quality profile in this submarket — average credit score on applications, eviction rate, late-payment / NSF rate, and stable-employment percentage? A property-management company in the area should have these aggregated.
- How much new for-sale + rental construction is in the pipeline within 1–3 miles? Heavy new supply typically softens prices + rents 12–24 months out; constrained supply supports both.
Investment metrics
- 1% rule
- 0.86% ✗
- Cap rate
- 5.67%
- Cash-on-cash
- -2.23%
- DSCR
- 0.90
- GRM
- 9.7
CMA / ARV
- ARV (median comp)
- $225,687
- List price
- $210,999
- Delta
- -6.51%
- Verdict
- FAIR
- Comps
- 20 within 1.0 mi
Show comp detail 12 sales within ~0.75 mi
| Address | Dist | Beds/Ba | Sqft | Sold | Price | $/sf | Match |
|---|---|---|---|---|---|---|---|
| 3800 Ontario Way | 0.04mi | 3/2.0 | 1,411 (0%) | 1mo | $221,549 | $157 | 97 |
| 3929 Pontchartrain Pkwy | 0.08mi | 3/2.0 | 1,411 (0%) | 1mo | $214,999 | $152 | 95 |
| 3918 Ontario Way | 0.06mi | 3/2.0 | 1,402 (-1%) | 3mo | $217,999 | $155 | 94 |
| 3912 Pontchartrain Pkwy | 0.09mi | 3/2.0 | 1,402 (-1%) | 4mo | $212,974 | $152 | 92 |
| 3808 Ontario Way | 0.03mi | 3/2.0 | 1,266 (-10%) | 2mo | $206,999 | $164 | 80 |
| 3428 Spur Run | 0.40mi | 3/2.0 | 1,332 (-6%) | 1mo | $243,490 | $183 | 71 |
| 3812 Ontario Way | 0.03mi | 4/2.0 (+1) | 1,600 (+13%) | 1mo | $226,999 | $142 | 71 |
| 4408 Carnation Dr | 0.40mi | 3/2.0 | 1,332 (-6%) | 3mo | $250,990 | $188 | 69 |
| 3406 Tomahawk Dr | 0.40mi | 3/2.0 | 1,332 (-6%) | 3mo | $248,490 | $187 | 69 |
| 3905 Pontchartrain Pkwy | 0.06mi | 4/2.0 (+1) | 1,600 (+13%) | 3mo | $228,199 | $143 | 67 |
| 3933 Pontchartrain Pkwy | 0.09mi | 4/2.0 (+1) | 1,600 (+13%) | 2mo | $228,149 | $143 | 67 |
| 3907 Sky Dr | 0.52mi | 3/2.0 | 1,518 (+8%) | 1mo | $244,990 | $161 | 62 |
Match score weights: distance 35% · size 25% · config 20% · recency 20%. Top-matched comps best support the ARV.
Projected returns pro-forma
-3.0% appreciation · 0.0% rent growth · sell at horizon
- IRR
- -23.6%
- Equity multiple
- 0.21×
- Total profit
- $-46,414
- Equity at exit
- $31,461
- IRR
- -30.5%
- Equity multiple
- -0.18×
- Total profit
- $-69,621
- Equity at exit
- $18,243
Cash invested: $59,080 (down + closing). Projections, not guarantees.
Landlord ↔ Tenant lean methodology
- Overall (STATE)
- 87 Strongly Landlord-Friendly
- State Texas
- 87 Strongly Landlord-Friendly · R+5
- County
- — inherits STATE
- City
- — inherits STATE
ZIP-level market 75090
- Home prices YoY
- -20.0%
- Rents YoY
- -2.7%
- Active inventory
- 473
- Price-to-rent
- 9.7×
Monthly cashflow live
- Estimated rent
- $1,812 high interval (Pro) →
- Mortgage (P&I)
- −$1,107
- Tax est. 1.5%
- −$264 /mo · $3,165/yr
- Insurance
- −$88
- HOA
- −$83
- Vacancy / Maint / Mgmt
- −$380
- Net cashflow
- $-110
Break-even live
UW: 25.0% down · 7.5% · 30yr · 1.5% tax · 5.0% vac · 8.0% maint · 8.0% mgmt
Financing live
Cash to close
- Down payment
- $52,750
- Closing costs
- $6,330
- Reserves months
- —
- Total cash needed
- —
Loan-product check · same deal, 3 products live
Conventional
25% down · 7.5% · 30yr
- Down + closing
- —
- Monthly P&I
- —
- Monthly cashflow
- —
- DSCR
- —
- Eligible?
- —
Personal DTI + credit; lowest rate.
DSCR
20% down · 8.5% · 30yr
- Down + closing
- —
- Monthly P&I
- —
- Monthly cashflow
- —
- DSCR
- —
- Eligible?
- —
No personal income docs; deal must DSCR.
Hard money
10% down · 12.0% · 12mo
- Down + closing
- —
- Monthly P&I
- —
- Monthly cashflow
- —
- DSCR
- —
- Eligible?
- —
Short-term bridge; refi at stabilization.
Rent comps 16 comps
| Address | Beds | Baths | Sqft | Rent | $/sqft | DOM | Units | Dist |
|---|---|---|---|---|---|---|---|---|
| 3809 Ontario Way Sherman, TX | 3.0 | 2.0 | 1402 | $1,650 | $1.18 | 21d | 1 | 0.03mi |
| 3914 Ontario Way Sherman, TX | 4.0 | 2.0 | 1617 | $1,695 | $1.05 | 21d | 1 | 0.03mi |
| 3807 Pontchartrain Pkwy Sherman, TX | 3.0 | 2.0 | 1411 | $1,650 | $1.17 | 21d | 1 | 0.06mi |
| 3902 Talisker Blvd Sherman, TX | 3.0 | 2.0 | 1740 | $2,100 | $1.21 | 21d | 1 | 0.31mi |
| 3825 Cherry Hills Dr Sherman, TX | 3.0 | 2.0 | 1585 | $2,100 | $1.32 | 43d | 1 | 0.35mi |
| 1601 FM1417 Sherman, TX | 3.0 | 2.0 | 1448 | $1,449 | $1.00 | 21d | 1 | 0.42mi |
| 3740 Paradise Way Sherman, TX | 3.0 | 2.5 | 1755 | $1,899 | $1.08 | 43d | 1 | 0.42mi |
| 3740 Paradise Way Sherman, TX | 3.0 | 2.5 | 1755 | $1,750 | $1.00 | 21d | 1 | 0.42mi |
| 1108 El Sol Blvd Sherman, TX | 3.0 | 2.0 | 1717 | $1,999 | $1.16 | 43d | 1 | 0.42mi |
| 3716 Paradise Way Sherman, TX | 3.0 | 2.5 | 1756 | $1,900 | $1.08 | 43d | 1 | 0.43mi |
| 1205 Morgan Dr Sherman, TX | 3.0 | 2.5 | 1775 | $1,850 | $1.04 | 21d | 1 | 0.44mi |
| 1127 Mesa St Sherman, TX | 3.0 | 2.5 | 1736 | $2,250 | $1.30 | 21d | 1 | 0.45mi |
| 3717 Malibu Dr Sherman, TX | 3.0 | 2.5 | 1794 | $1,900 | $1.06 | 21d | 1 | 0.45mi |
| 3730 Malibu Dr Sherman, TX | 3.0 | 2.5 | 1672 | $2,300 | $1.38 | 21d | 1 | 0.47mi |
| 2700 S Travis St Sherman, TX | 1.0–2.0 | 1.0–2.0 | 882 | $950 | $1.08 | 21d | 1 | 1.37mi |
| 2306 San Jacinto Way Sherman, TX | 3.0 | 2.0 | 1680 | $1,795 | $1.07 | 21d | 1 | 1.41mi |
HOA detail
- Monthly dues
- $83 · $996/yr
Listing history 4 events
-
2026-05-18status Pending 468-char remark
-
2026-05-14price $210,999 468-char remark
-
2026-05-02price $215,999 468-char remark
-
2026-04-23$219,999 Active 468-char remark
ⓘ Source: listings_history table (triggers on properties + properties_extension) + one-shot
backfill from property_details.listing_events for pre-trigger history.
Nearby sold comps map
Loading sold comps map…
Walkable amenities ~0.75 mi
Loading nearby amenities…
Taxation est. · year 1
- Rental income
- $21,743
- − Mortgage interest
- −$11,819
- − Property taxes
- −$3,165
- − Insurance
- −$1,055
- − Repairs & maintenance
- −$1,739
- − Management
- −$1,739
- − HOA
- −$996
- − Depreciation
- −$6,138
- Taxable loss
- −$4,909
- Est. tax savings @ 24.0%
- +$1,178
- After-tax cash flow
- $-139/yr
For passive investors: Depreciation is non-cash, so a rental often shows a tax loss while cash-flowing — sheltering income. Rental losses are passive: they offset passive income freely, and up to $25,000/yr can offset ordinary (W-2) income if you actively participate and your MAGI is under $100k (phasing out to $0 by $150k); unused losses carry forward. On sale, claimed depreciation is recaptured at up to 25%, and gains may owe capital-gains tax (a 1031 exchange can defer both). Figures are a year-1 estimate at your 24.0% rate — not tax advice; consult a CPA.
Condition & rehab AI · 1 photo
This single-family home is in good condition with no visible major issues. It has a good exterior, interior, and landscaping, making it a solid investment with potential for value enhancement through minor updates.
Value-add opportunities
- Both Painting the exterior and interior — Fresh paint can enhance the curb appeal and interior aesthetics, making the home more attractive to potential buyers and renters.
- Both Landscaping improvements — Enhancing the landscaping can improve the home's curb appeal and make it more inviting for potential buyers and renters.
- Both Updating the kitchen and bathrooms — Updating these spaces can increase the home's value by making it more modern and appealing to a wider range of buyers and renters.
Renovation cost estimate screening
Value-add ROI direction
- Both Painting the exterior and interior — Fresh paint can enhance the curb appeal and interior aesthetics, making the home more attractive to potential buyers and renters. ↑
- Both Landscaping improvements — Enhancing the landscaping can improve the home's curb appeal and make it more inviting for potential buyers and renters. ↑
- Both Updating the kitchen and bathrooms — Updating these spaces can increase the home's value by making it more modern and appealing to a wider range of buyers and renters. ↑
ⓘ Cost ranges are severity-bucket heuristics (US national rule-of-thumb). Get contractor quotes + a written scope before underwriting a rehab budget.
Schools (NCES district)
- District
- Sherman ISD
- NCES district ID
- 4840080
- Math proficiency
- 31% ▼ -9.00%
- Reading proficiency
- 37% ▼ -2.00%
- Median HH income
- $42,587
- Composite
- 28.79/100
- National rank
- #6665
- State rank
- #546 of 826 in TX
Livability — Sherman
- Score
- 61/100
- State rank
- #1027
- US rank
- #18243
Category grades
Schools grade is shown separately in the Schools card above.
Census & demographics
- County
- Grayson County · 108,053 people
- City population
- 54,936
- Metro
- Sherman-Denison, TX
- Population (ZIP)
- 26,594
- Household income
- $55,543
- Rent vs Own
- Severe rent burden
- 840.0
Population outlook (Grayson County) Hauer SSP2
- Today (2025)
- 134,540 people
- By 2030
- 138,653 · +3.1%
- By 2040
- 145,958 · +8.5%
- By 2050
- 151,218 · +12.4%
- By 2075
- 161,802 · +20.3%
- By 2100
- 159,036 · +18.2%
Race, ethnicity, and origin ACS 2023
- Neighborhood character
- Diverse neighborhood (Simpson 0.64)
- Race & ethnicity
- White 49% Hispanic / Latino 32% Two or more races 17% Black 11%
- Hispanic origin (detail)
- Mexican 26%
- Common ancestry
- Slovak 2% Romanian 2% Lithuanian 1%
- Foreign-born
- 15% · Canada
- Languages at home
- 73% English-only · Spanish 24% German/W. Germanic 1% Other Indo-European 1%
Political lean MEDSL · Grayson
- 2024 margin
- Solid R (+54.3) · D 22.5% · R 76.7%
- 2008→2024 swing
- -16.4pp toward R · 2008: -37.9pp · 2024: -54.3pp
- All cycles
- 2024: R+54.3 2020: R+49.9 2016: R+53.1 2012: R+48.0 2008: R+37.9
Not yet ingested
- Civics
- —
Market trends
- HPI YoY
- ▼ -69.00%
- Current HPI
- 276.5739
- Rent YoY
- ▼ -2.70%
- Metro
- Sherman-Denison, TX
- State GDP YoY
- ▲ 3.95%
- F500 in state
- 110
Industry mix (Fortune 500 HQ in TX)
| Industry | F500 HQs | Revenue |
|---|---|---|
| Energy | 16 | $1,198B |
|
||
| Technology | 5 | $198B |
|
||
| Engineering / Construction | 4 | $72B |
|
||
| Energy Services | 3 | $60B |
|
||
| Utilities | 3 | $41B |
|
||
| Healthcare | 2 | $330B |
|
||
Price history
-4.1% since first listed4 events — show timeline
- 2026-05-18 Pending — NTREIS
- 2026-05-14 Price Changed $210,999 NTREIS
- 2026-05-02 Price Changed $215,999 NTREIS
- 2026-04-23 Listed $219,999 NTREIS
Cash-flow waterfall
monthlySold comps — $/sqft
last 12 mo · ≤1 miLoading sold comps…