1126 17th St W #102 · Havre, MT
Flood risk 1/10 · Minimal
- FEMA flood zone
- —
- Chance of flooding over 30 yrs
- 0.0%
- Est. flood insurance / yr
- —
Fire risk 4/10 · Minor
- Est. fire insurance / yr
- $918 – $1,706
Heat risk 2/10 · Minimal
- Hot days now (above 94°F)
- 7 days/yr
- Hot days in 30 yrs
- 14 days/yr
Wind risk 1/10 · Minimal
- Chance of severe wind over 30 yrs
- —
Air-quality risk 5/10 · Moderate
- Unhealthy air days now
- 6 days/yr
- Unhealthy air days in 30 yrs
- 8 days/yr
Risk factors via First Street. Map © Google.
Why this score? — see what drove the C+ grade
The composite is a weighted blend of 9 inputs, each scored 0–100. Each bar is that input's sub-score; the figure is the points it added to the 100-point composite (weight × sub-score).
- Cash flow +26.8/30.0
- DSCR +9.2/10.0
- ARV discount +7.5/15.0
- 1% rule +7.2/10.0
- Condition / age +4.0/5.0
- Schools +3.8/10.0
- Livability +3.6/5.0
- Rent growth +2.5/5.0
- Appreciation +0.0/10.0
$115,000
🖨 Deal sheet 📄 Offer letter ✓ Due diligence
Key facts
- Bright open layout
- Private bathroom
- Outdoor living
Tags
Property features AI
Finance
- Financial info: Annual tax: $624.97
Exterior
- Utilities: Public water; Public sewer
- Home design: Manufactured home; Residential property
- Exterior features: Leased lot
Interior
- Kitchen: Dishwasher; Microwave; Refrigerator
- Bedrooms: Total of 7 rooms (bedroom count not specified)
- Flooring: Hardwood
- Bathrooms: 2 full bathrooms
- Interior features: Dishwasher; Microwave; Refrigerator
Neighborhood map
What this means for you Summary
Snapshot
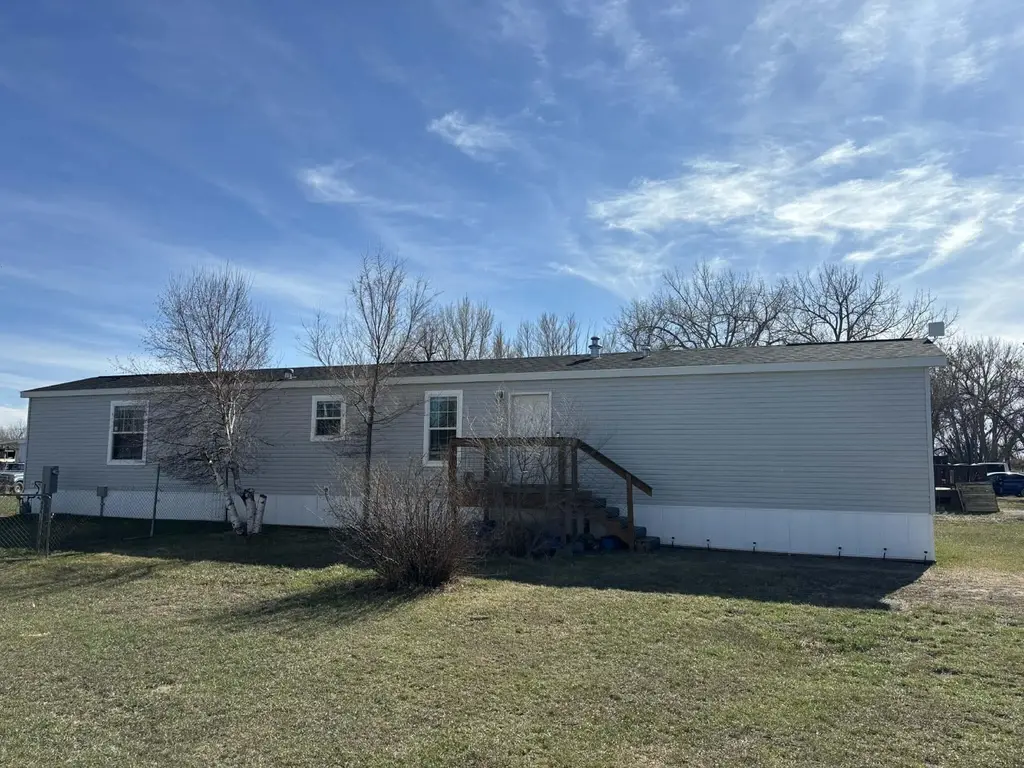
- This is a 3-bed/2.0-bath manufactured listed at $115k. Condition is rated good.
Deal economics
- At list price, monthly cash flow is $315 ($4k/yr) — positive.
- The deal already cash-flows at list — no discount required.
- Meets the 1% rule at list price ($1k rent vs $115k).
- Recommended offer: $108k (6.0% below list) — sets the bar for market timing.
Location & tenants
- Location reads 71/100 on livability (#62 in MT) — a middle-class / working-renter tenant base. Strengths: cost of living A+, housing A+, health & safety A+; Watch: amenities D, employment D, crime F.
- Havre H S (town): math 35% / reading 50% proficiency, ranked #125 of 339 in MT (top 37%) — families likely to look elsewhere, expect single-tenant / working-renter base with shorter leases.
- Market conditions: 115 active listings in the ZIP; 1 units permitted in Hill County in 2024 (0 in 5+ unit buildings).
- This rent runs 32% of the median local income ($52k/yr) — at the standard rent-burdened threshold; future hikes will face affordability resistance.
Forward outlook
- Local home prices are declining (-3.0%/yr); year-one equity from $795 of loan paydown is wiped out by about $3k of value loss. Plan a longer hold.
- At projected returns (-3.0% appreciation + 3.0% rent growth), your $32k cash investment doubles in ~10 years — after that, you're playing with house money.
Negotiation context
- It's been on market 67 days — a 6% lower offer ($108k) is reasonable based on typical stale-listing flexibility.
Questions for the listing agent
- It's been on market 67 days. Have you received any prior offers? Is the seller open to a 6% concession, seller financing, or rate buy-down credit?
- Why hasn't it sold? Are there any deal-killer items the seller is aware of (foundation, flood, title, zoning, code violations)?
- Is there a deadline driving the sale (1031 exchange, divorce, estate, relocation)? That informs how much negotiation room exists.
- Crime grade is F in this area — have there been break-ins, vandalism, or insurance claims at this property in the last 3 years? What carrier currently insures it and at what premium?
- What's the average days-on-market for RENTAL listings here right now (not sales)? A rising rental-DOM trend means longer vacancies and softer asking-rent achievability than the comps imply.
- What's the recent tenant-quality profile in this submarket — average credit score on applications, eviction rate, late-payment / NSF rate, and stable-employment percentage? A property-management company in the area should have these aggregated.
- How much new for-sale + rental construction is in the pipeline within 1–3 miles? Heavy new supply typically softens prices + rents 12–24 months out; constrained supply supports both.
Investment metrics
- 1% rule
- 1.22% ✓
- Cap rate
- 9.58%
- Cash-on-cash
- 11.74%
- DSCR
- 1.52
- GRM
- 6.8
CMA / ARV
No comps found within radius.
Projected returns pro-forma
-3.0% appreciation · 3.0% rent growth · sell at horizon
- IRR
- 1.2%
- Equity multiple
- 1.05×
- Total profit
- $1,450
- Equity at exit
- $17,147
- IRR
- 10.8%
- Equity multiple
- 1.84×
- Total profit
- $27,184
- Equity at exit
- $9,943
Cash invested: $32,200 (down + closing). Projections, not guarantees.
Landlord ↔ Tenant lean methodology
- Overall (STATE)
- 82 Strongly Landlord-Friendly
- State Montana
- 82 Strongly Landlord-Friendly · R+11
- County
- — inherits STATE
- City
- — inherits STATE
ZIP-level market 59501
- Active inventory
- 115
- Price-to-rent
- 6.8×
Monthly cashflow live
- Estimated rent
- $1,405 medium interval (Pro) →
- Mortgage (P&I)
- −$603
- Tax est. 1.5%
- −$144 /mo · $1,725/yr
- Insurance
- −$48
- HOA
- −$0
- Vacancy / Maint / Mgmt
- −$295
- Net cashflow
- $315
Break-even live
UW: 25.0% down · 7.5% · 30yr · 1.5% tax · 5.0% vac · 8.0% maint · 8.0% mgmt
Financing live
Cash to close
- Down payment
- $28,750
- Closing costs
- $3,450
- Reserves months
- —
- Total cash needed
- —
Loan-product check · same deal, 3 products live
Conventional
25% down · 7.5% · 30yr
- Down + closing
- —
- Monthly P&I
- —
- Monthly cashflow
- —
- DSCR
- —
- Eligible?
- —
Personal DTI + credit; lowest rate.
DSCR
20% down · 8.5% · 30yr
- Down + closing
- —
- Monthly P&I
- —
- Monthly cashflow
- —
- DSCR
- —
- Eligible?
- —
No personal income docs; deal must DSCR.
Hard money
10% down · 12.0% · 12mo
- Down + closing
- —
- Monthly P&I
- —
- Monthly cashflow
- —
- DSCR
- —
- Eligible?
- —
Short-term bridge; refi at stabilization.
Listing history 18 events
-
2026-06-18days on market $115,000 Active 67 DOM
-
2026-06-17days on market $115,000 Active 66 DOM
-
2026-06-16days on market $115,000 Active 65 DOM
-
2026-06-15days on market $115,000 Active 64 DOM
-
2026-06-14days on market $115,000 Active 62 DOM
-
2026-06-13days on market $115,000 Active 61 DOM
-
2026-06-10days on market $115,000 Active 59 DOM
-
2026-06-09days on market $115,000 Active 58 DOM
-
2026-06-08days on market $115,000 Active 57 DOM
-
2026-06-07days on market $115,000 Active 56 DOM
-
2026-06-05days on market $115,000 Active 53 DOM
-
2026-06-03days on market $115,000 Active 52 DOM
-
2026-06-02days on market $115,000 Active 51 DOM
-
2026-06-01days on market $115,000 Active 50 DOM
-
2026-05-31days on market $115,000 Active 49 DOM
-
2026-05-31days on market $115,000 Active 48 DOM
-
2026-04-20price $115,000
-
2026-04-12$120,000 Active
ⓘ Source: listings_history table (triggers on properties + properties_extension) + one-shot
backfill from property_details.listing_events for pre-trigger history.
Climate risk First Street
- Flood 1/10 Low 0% chance over 30 yrs
- Wildfire 4/10 Moderate
- Heat 2/10 Low 7 d/yr ≥94°F today · 14 d/yr by 30 yrs out
- Wind 1/10 Low
- Air quality 5/10 Major 6 unhealthy d/yr today · 8 by 30 yrs out
Nearby sold comps map
Loading sold comps map…
Walkable amenities ~0.75 mi
Loading nearby amenities…
Taxation est. · year 1
- Rental income
- $16,857
- − Mortgage interest
- −$6,442
- − Property taxes
- −$1,725
- − Insurance
- −$575
- − Repairs & maintenance
- −$1,349
- − Management
- −$1,349
- − Depreciation
- −$3,345
- Taxable income
- $2,073
- Est. tax owed @ 24.0%
- −$497
- After-tax cash flow
- $3,283/yr
For passive investors: Depreciation is non-cash, so a rental often shows a tax loss while cash-flowing — sheltering income. Rental losses are passive: they offset passive income freely, and up to $25,000/yr can offset ordinary (W-2) income if you actively participate and your MAGI is under $100k (phasing out to $0 by $150k); unused losses carry forward. On sale, claimed depreciation is recaptured at up to 25%, and gains may owe capital-gains tax (a 1031 exchange can defer both). Figures are a year-1 estimate at your 24.0% rate — not tax advice; consult a CPA.
Condition & rehab AI · 12 photos
This manufactured home is in good condition with modern finishes and minimal repairs needed. Painting the exterior and replacing the deck would significantly enhance its curb appeal and value.
Value-add opportunities
- Both paint exterior — enhances curb appeal and resale value
- Both replace deck — improves curb appeal and rental value
Renovation cost estimate screening
Value-add ROI direction
- Both paint exterior — enhances curb appeal and resale value ↑
- Both replace deck — improves curb appeal and rental value ↑
ⓘ Cost ranges are severity-bucket heuristics (US national rule-of-thumb). Get contractor quotes + a written scope before underwriting a rehab budget.
Schools (NCES district)
- District
- Havre H S
- NCES district ID
- 3013590
- Math proficiency
- 35% ▲ 10.00%
- Reading proficiency
- 50% ▲ 15.00%
- Median HH income
- $44,545
- Composite
- 38.34/100
- National rank
- #8537
- State rank
- #125 of 339 in MT
Livability — Havre
- Score
- 71/100
- State rank
- #62
- US rank
- #6620
Category grades
Schools grade is shown separately in the Schools card above.
Census & demographics
- County
- Hill County · 12,243 people
- City population
- 12,243
- Metro
- nan
- Population (ZIP)
- 12,243
- Household income
- $51,872
- Rent vs Own
- Severe rent burden
- 309.0
Population outlook (Hill County) Hauer SSP2
- Today (2025)
- 16,841 people
- By 2030
- 16,954 · +0.7%
- By 2040
- 17,063 · +1.3%
- By 2050
- 17,130 · +1.7%
- By 2075
- 17,273 · +2.6%
- By 2100
- 16,542 · -1.8%
Race, ethnicity, and origin ACS 2023
- Neighborhood character
- Predominantly White (79%)
- Race & ethnicity
- White 79% Native American 10% Two or more races 7% Hispanic / Latino 3%
- Common ancestry
- Portuguese 11% Italian 6% Scottish 3%
- Foreign-born
- 1% · Canada
- Languages at home
- 98% English-only · Spanish 1%
Political lean MEDSL · Hill
- 2024 margin
- R (+18.2) · D 38.7% · R 56.9% · Other 4.4%
- 2008→2024 swing
- -30.4pp toward R · 2008: 12.2pp · 2024: -18.2pp
- All cycles
- 2024: R+18.2 2020: R+13.6 2016: R+17.3 2012: D+3.5 2008: D+12.2
Not yet ingested
- Civics
- —
Market trends
- HPI YoY
- ▼ -121.86%
- Current HPI
- 209.1198
- Rent YoY
- —
- Metro
- nan
- State GDP YoY
- ▲ 3.41%
- F500 in state
- 2
Industry mix (Fortune 500 HQ in MT)
| Industry | F500 HQs | Revenue |
|---|---|---|
| Technology / Analytics | 1 | $2B |
|
||
Price history
-4.2% since first listed2 events — show timeline
- 2026-04-20 Price Changed $115,000 HHLMLS
- 2026-04-12 Listed $120,000 HHLMLS
Cash-flow waterfall
monthlySold comps — $/sqft
last 12 mo · ≤1 miLoading sold comps…