 Multi-family
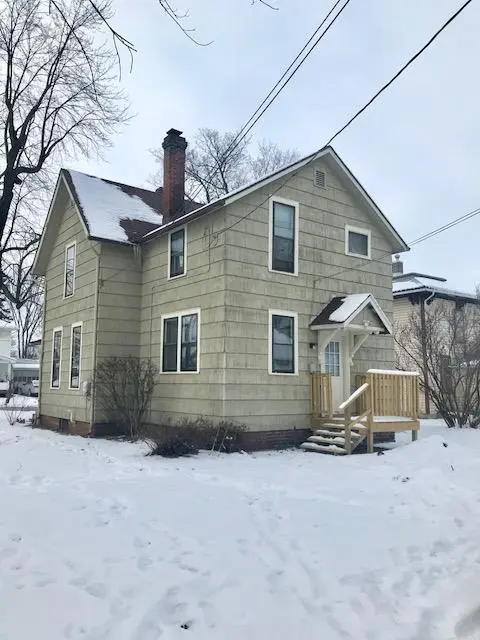
624 &1/2 Prospect St · Bucyrus, OH
Flood risk No data
- FEMA flood zone
- —
- Chance of flooding over 30 yrs
- —
- Est. flood insurance / yr
- —
Fire risk No data
- Est. fire insurance / yr
- —
Heat risk No data
- Hot days now (above threshold)
- —
- Hot days in 30 yrs
- —
Wind risk No data
- Chance of severe wind over 30 yrs
- —
Air-quality risk No data
- Unhealthy air days now
- —
- Unhealthy air days in 30 yrs
- —
Risk factors via First Street. Map © Google.
Why this score? — see what drove the C+ grade
The composite is a weighted blend of 9 inputs, each scored 0–100. Each bar is that input's sub-score; the figure is the points it added to the 100-point composite (weight × sub-score).
- Cash flow +23.5/30.0
- ARV discount +11.8/15.0
- DSCR +7.6/10.0
- 1% rule +6.1/10.0
- Livability +3.9/5.0
- Schools +3.4/10.0
- Rent growth +2.5/5.0
- Condition / age +2.2/5.0
- Appreciation +0.0/10.0
$120,000
🖨 Deal sheet (PDF) 📄 Offer letter ✓ Due diligence
Multi-family units
County records classify this as Multi-Family (2-4 Unit). Listing-text estimate: 1 unit. estimate disagrees with records
Listing remarks
You have options with this one! Convert to a single family home, continue to use as an investment property, or live in one unit and rent the other. So many choices! This corner property in Bucyrus SD features a total of four beds and two full baths, a nice yard, and a detached two-car garage. The real beauty though is found in the original woodwork of this home. By easily converting it back to a single-family home, you could possibly have instant equity with very little labor. This home is currently used as an investment property with two units. There has been steady tenant demand and it has provided good cash-flow. Both units come with kitchen appliances and have basement access w/ laundry
Key facts
- Basement access
- Kitchen appliances
- Original woodwork
Tags
Property features AI
Exterior
- Parking: 2 parking spaces
- Utilities: Public water; Public sewer
- Home design: Multi-family residential income property; 2-story building
- Construction: Shingle siding; Wood siding
- Exterior features: Lot approximately 53 x 132 (0.16 acres); Zoned: Other
Interior
- Heating & cooling: Forced air heating; Natural gas heating
- Interior features: Full walk-out basement
- Laundry & utility: Gas water heater
Neighborhood map
What this means for you Summary
Snapshot
- This is a 4-bed/2.0-bath multifamily listed at $120k. Condition is rated fair.
Deal economics
- At list price, monthly cash flow is $225 ($3k/yr) — positive.
- The deal already cash-flows at list — no discount required.
- Meets the 1% rule at list price ($1k rent vs $120k).
- Recommended offer: $116k (3.0% below list) — sets the bar for market timing.
- Cap rate 8.5% vs local median 4.4% in Bucyrus — top-decile yield for the area; either an underpriced asset or a hidden risk that comps aren't pricing in. Stress-test before assuming the spread holds.
Location & tenants
- Location reads 78/100 on livability (#158 in OH, #2,388 nationally) — a middle-class / working-renter tenant base. Strengths: cost of living A+, housing A+, health & safety A+; Watch: employment D, amenities F, commute F.
- Bucyrus City (town): math 37% / reading 46% proficiency, ranked #537 of 656 in OH (top 82%) — families likely to look elsewhere, expect single-tenant / working-renter base with shorter leases.
- Zoned schools: Bucyrus Elementary School (math 48% / reading 42%, grade D-, #984 of 1,584 statewide, top 62%, 544 students, 72% FRL); Bucyrus Middle School (math 28% / reading 44%, grade F, #541 of 654 statewide, top 83%, 272 students, 0% FRL); Bucyrus Secondary School (math 32% / reading 62%, grade D-, #435 of 781 statewide, top 59%, 290 students, 99% FRL) — zoned schools at 57% FRL track the district average.
- Market conditions: 80 active listings in the ZIP; 8 units permitted in Crawford County in 2024 (0 in 5+ unit buildings).
Forward outlook
- Local home prices are declining (-3.0%/yr); year-one equity from $830 of loan paydown is wiped out by about $4k of value loss. Plan a longer hold.
- Crawford County population projected at -22% by 2050 — secular population decline; favor cash flow + early exit over multi-decade hold.
Negotiation context
- It's been on market 44 days — a 3% lower offer ($116k) is reasonable based on typical stale-listing flexibility.
- 5 sale attempts since 13y ago with the ask held roughly flat each time — persistent listings suggest the price (not the market) is what's stuck; bring a comps-based counter.
Risks & watch-outs
- Watch-outs: built in 1901 — expect roof / HVAC / electrical / plumbing capex.
Questions for the listing agent
- It's been on market 44 days. Have you received any prior offers? Is the seller open to a 3% concession, seller financing, or rate buy-down credit?
- Have any recent inspections been done? Can we get a copy of the seller's disclosures and any deferred-maintenance estimates?
- Built in 1901 — when were the roof, HVAC, electrical panel, plumbing, and water heater last replaced?
- Is there a deadline driving the sale (1031 exchange, divorce, estate, relocation)? That informs how much negotiation room exists.
- What's the average days-on-market for RENTAL listings here right now (not sales)? A rising rental-DOM trend means longer vacancies and softer asking-rent achievability than the comps imply.
- What's the recent tenant-quality profile in this submarket — average credit score on applications, eviction rate, late-payment / NSF rate, and stable-employment percentage? A property-management company in the area should have these aggregated.
- How much new apartment / multifamily construction is in the pipeline within 1–3 miles? Heavy new supply (>2% of stock underway) typically softens rents 12–24 months out; light construction supports rent growth.
Investment metrics
- 1% rule
- 1.11% ✓
- Cap rate
- 8.54%
- Cash-on-cash
- 8.02%
- DSCR
- 1.36
- GRM
- 7.5
CMA / ARV
- ARV (median comp)
- $132,784
- List price
- $120,000
- Delta
- -9.63%
- Verdict
- FAIR
- Comps
- 1 within 2.0 mi
Projected returns pro-forma
-3.0% appreciation · 3.0% rent growth · sell at horizon
- IRR
- -4.1%
- Equity multiple
- 0.85×
- Total profit
- $-5,123
- Equity at exit
- $17,892
- IRR
- 5.6%
- Equity multiple
- 1.42×
- Total profit
- $14,036
- Equity at exit
- $10,375
Cash invested: $33,600 (down + closing). Projections, not guarantees.
Landlord ↔ Tenant lean methodology
- Overall (STATE)
- 73 Landlord-Friendly
- State Ohio
- 73 Landlord-Friendly · R+6
- County
- — inherits STATE
- City
- — inherits STATE
ZIP-level market 44820
- Home prices YoY
- -27.1%
- Active inventory
- 80
- Price-to-rent
- 7.5×
Monthly cashflow live
- Estimated rent
- $1,334 medium interval (Pro) →
- Mortgage (P&I)
- −$629
- Tax est. 1.5%
- −$150 /mo · $1,800/yr
- Insurance
- −$50
- HOA
- −$0
- Vacancy / Maint / Mgmt
- −$280
- Net cashflow
- $225
Break-even live
Sensitivity live
| Price | -10% $307 | -5% $266 | +0% $225 | +5% $183 | +10% $142 |
|---|---|---|---|---|---|
| Rent | -10% $119 | -5% $172 | +0% $225 | +5% $277 | +10% $330 |
| Rate | -1.0pp $285 | -0.5pp $255 | base $225 | +0.5pp $193 | +1.0pp $162 |
UW: 25.0% down · 7.5% · 30yr · 1.5% tax · 5.0% vac · 8.0% maint · 8.0% mgmt
Financing live
Cash to close
- Down payment
- $30,000
- Closing costs
- $3,600
- Reserves months
- —
- Total cash needed
- —
Loan-product check · same deal, 3 products live
Conventional
25% down · 7.5% · 30yr
- Down + closing
- —
- Monthly P&I
- —
- Monthly cashflow
- —
- DSCR
- —
- Eligible?
- —
Personal DTI + credit; lowest rate.
DSCR
20% down · 8.5% · 30yr
- Down + closing
- —
- Monthly P&I
- —
- Monthly cashflow
- —
- DSCR
- —
- Eligible?
- —
No personal income docs; deal must DSCR.
Hard money
10% down · 12.0% · 12mo
- Down + closing
- —
- Monthly P&I
- —
- Monthly cashflow
- —
- DSCR
- —
- Eligible?
- —
Short-term bridge; refi at stabilization.
Listing history 26 events
-
2026-06-22days on market $120,000 Active 44 DOM
-
2026-06-21days on market $120,000 Active 43 DOM
-
2026-06-21days on market $120,000 Active 42 DOM
-
2026-06-18days on market $120,000 Active 40 DOM
-
2026-06-17days on market $120,000 Active 39 DOM
-
2026-06-16days on market $120,000 Active 38 DOM
-
2026-06-15days on market $120,000 Active 37 DOM
-
2026-06-13days on market $120,000 Active 35 DOM
-
2026-06-12days on market $120,000 Active 34 DOM
-
2026-06-09days on market $120,000 Active 31 DOM
-
2026-06-08days on market $120,000 Active 30 DOM
-
2026-06-07pricedays on market $120,000 Active 29 DOM
-
2026-06-05days on market $125,000 Active 27 DOM
-
2026-06-04days on market $125,000 Active 25 DOM
-
2026-06-02days on market $125,000 Active 24 DOM
-
2026-06-01days on market $125,000 Active 23 DOM
-
2026-05-31days on market $125,000 Active 22 DOM
-
2026-05-09$125,000 Active 928-char remark
-
2025-10-14historical
-
2016-06-30historical
-
2016-06-30historical
-
2015-06-05$53,900
-
2015-06-05$53,900
-
2013-09-06historical
-
2013-03-26$59,900
-
2013-03-26$59,900
ⓘ Source: listings_history table (triggers on properties + properties_extension) + one-shot
backfill from property_details.listing_events for pre-trigger history.
Nearby sold comps map
Loading sold comps map…
Walkable amenities ~0.75 mi
Loading nearby amenities…
Taxation est. · year 1
- Rental income
- $16,008
- − Mortgage interest
- −$6,722
- − Property taxes
- −$1,800
- − Insurance
- −$600
- − Repairs & maintenance
- −$1,281
- − Management
- −$1,281
- − Depreciation
- −$3,491
- Taxable income
- $834
- Est. tax owed @ 24.0%
- −$200
- After-tax cash flow
- $2,495/yr
For passive investors: Depreciation is non-cash, so a rental often shows a tax loss while cash-flowing — sheltering income. Rental losses are passive: they offset passive income freely, and up to $25,000/yr can offset ordinary (W-2) income if you actively participate and your MAGI is under $100k (phasing out to $0 by $150k); unused losses carry forward. On sale, claimed depreciation is recaptured at up to 25%, and gains may owe capital-gains tax (a 1031 exchange can defer both). Figures are a year-1 estimate at your 24.0% rate — not tax advice; consult a CPA.
Condition & rehab AI · 1 photo
This multi-family property requires significant repairs and updates to improve its condition and value. Consider converting it to a single-family home for the best return on investment.
Repairs flagged
- Major Kitchen — No photos of kitchen
- Major Bathrooms — No photos of bathrooms
- Major Exterior — Snow on roof, no visible damage
- Major Flooring — No photos of flooring
- Major Interior walls/paint — No photos of interior walls/paint
- Major Windows — No photos of windows
- Major Foundation/structure — No photos of foundation/structure
- Major HVAC/mechanicals — No photos of HVAC/mechanicals
- Major Landscaping/curb appeal — Snow on ground, no visible landscaping
Value-add opportunities
- Both Paint interior walls/paint — Improves appearance and value
- Both Replace flooring — Improves appearance and value
- Both Replace kitchen and bathroom fixtures — Improves appearance and value
- Both Replace windows — Improves appearance and value
- Both Replace HVAC/mechanicals — Improves comfort and value
- Both Landscaping and curb appeal — Improves appearance and value
Renovation cost estimate screening
| Repair item | Severity | Est. cost |
|---|---|---|
| Kitchen · No photos of kitchen | Major | $15,000–50,000 |
| Bathrooms · No photos of bathrooms | Major | $15,000–50,000 |
| Exterior · Snow on roof, no visible damage | Major | $15,000–50,000 |
| Flooring · No photos of flooring | Major | $15,000–50,000 |
| Interior walls/paint · No photos of interior walls/paint | Major | $15,000–50,000 |
| Windows · No photos of windows | Major | $15,000–50,000 |
| Foundation/structure · No photos of foundation/structure | Major | $15,000–50,000 |
| HVAC/mechanicals · No photos of HVAC/mechanicals | Major | $15,000–50,000 |
| Landscaping/curb appeal · Snow on ground, no visible landscaping | Major | $15,000–50,000 |
| Total estimated repair cost · 9 items | $135,000–450,000 |
Value-add ROI direction
- Both Paint interior walls/paint — Improves appearance and value ↑
- Both Replace flooring — Improves appearance and value ↑
- Both Replace kitchen and bathroom fixtures — Improves appearance and value ↑
- Both Replace windows — Improves appearance and value ↑
- Both Replace HVAC/mechanicals — Improves comfort and value ↑
- Both Landscaping and curb appeal — Improves appearance and value ↑
ⓘ Cost ranges are severity-bucket heuristics (US national rule-of-thumb). Get contractor quotes + a written scope before underwriting a rehab budget.
Schools (NCES district)
- District
- Bucyrus City
- NCES district ID
- 3904368
- Math proficiency
- 37% ▼ -15.00%
- Reading proficiency
- 46% ▼ -5.00%
- Median HH income
- $36,819
- Composite
- 34.45/100
- National rank
- #5196
- State rank
- #537 of 656 in OH
Livability — Bucyrus
- Score
- 78/100
- State rank
- #158
- US rank
- #2388
Category grades
Schools grade is shown separately in the Schools card above.
Census & demographics
- Census place
- Bucyrus, OH
- County
- Crawford · 26,873 people
- City population
- 17,265
- Population (ZIP)
- 17,265
- Household income
- $56,942
- Rent vs Own
- Severe rent burden
- 8.2
Population outlook (Crawford County) Hauer SSP2
- Today (2025)
- 39,421 people
- By 2030
- 37,656 · -4.5%
- By 2040
- 34,043 · -13.6%
- By 2050
- 30,617 · -22.3%
- By 2075
- 23,652 · -40.0%
- By 2100
- 17,786 · -54.9%
Race, ethnicity, and origin ACS 2023
- Neighborhood character
- Predominantly White (93%)
- Race & ethnicity
- White 93% Two or more races 3% Hispanic / Latino 2% Asian 1% Black 1%
- Common ancestry
- Iranian 2% Lithuanian 2% Slovak 1%
- Foreign-born
- 1%
- Languages at home
- 97% English-only · Other Asian/Pacific 1% Spanish 1%
Political lean MEDSL · Crawford
- 2024 margin
- Solid R (+53.0) · D 23.1% · R 76.1%
- 2008→2024 swing
- -33.9pp toward R · 2008: -19.0pp · 2024: -53.0pp
- All cycles
- 2024: R+53.0 2020: R+50.9 2016: R+46.8 2012: R+22.7 2008: R+19.0
Not yet ingested
- Civics
- —
Market trends
- HPI YoY
- ▼ -65.64%
- Current HPI
- 176.3548
- Rent YoY
- —
- Metro
- —
- State GDP YoY
- ▲ 1.98%
- F500 in state
- 48
Industry mix (Fortune 500 HQ in OH)
| Industry | F500 HQs | Revenue |
|---|---|---|
| Insurance | 3 | $145B |
|
||
| Industrial Machinery | 3 | $49B |
|
||
| Financial Services | 3 | $24B |
|
||
| Consumer Goods | 2 | $93B |
|
||
| Aerospace / Defense | 2 | $47B |
|
||
| Utilities | 2 | $33B |
|
||
Price history
+100.3% since first listed10 events — show timeline
- 2026-06-06 Price Changed $120,000 ABOR
- 2026-05-09 Listed $125,000 ABOR
- 2025-10-14 Listing Removed — NORIS
- 2016-06-30 Listing Removed — NORIS
- 2016-06-30 Listing Removed — NORIS
- 2015-06-05 Listed $53,900 NORIS
- 2015-06-05 Listed $53,900 NORIS
- 2013-09-06 Listing Removed — NORIS
- 2013-03-26 Listed $59,900 NORIS
- 2013-03-26 Listed $59,900 NORIS
Cash-flow waterfall
monthlySold comps — $/sqft
last 12 mo · ≤1 miLoading sold comps…