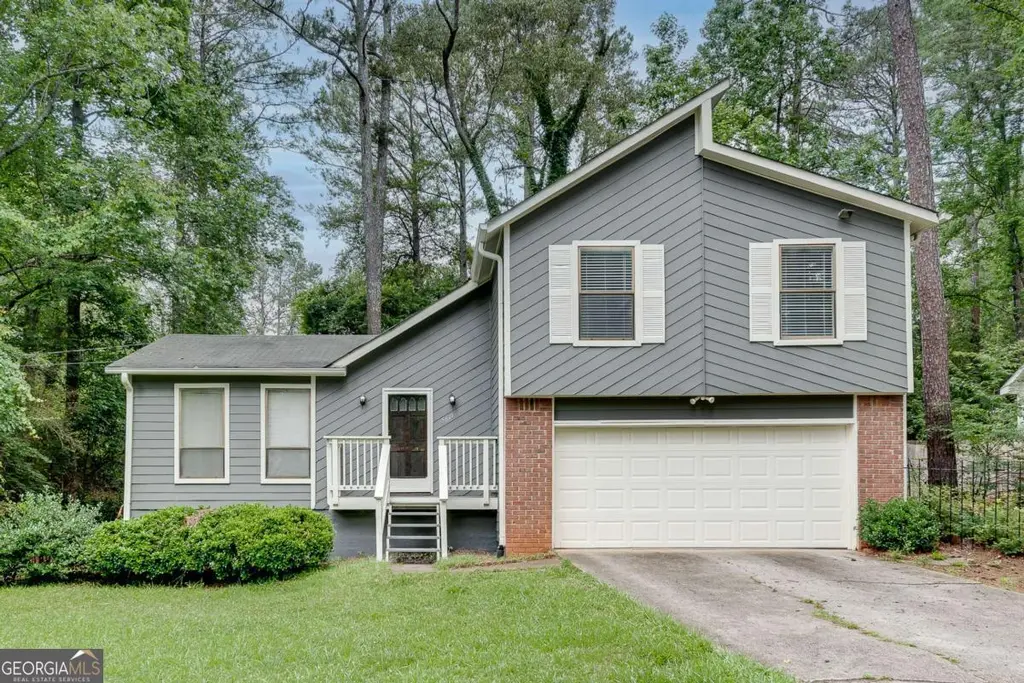
5611 Whittondale Rd · Redan, GA
Flood risk 1/10 · Minimal
- FEMA flood zone
- X (unshaded)
- Chance of flooding over 30 yrs
- 0.0%
- Est. flood insurance / yr
- $507 – $1,088
Fire risk 1/10 · Minimal
- Est. fire insurance / yr
- $963 – $1,789
Heat risk 6/10 · Moderate
- Hot days now (above 104°F)
- 7 days/yr
- Hot days in 30 yrs
- 18 days/yr
Wind risk 5/10 · Moderate
- Chance of severe wind over 30 yrs
- 26.0%
Air-quality risk 5/10 · Moderate
- Unhealthy air days now
- 7 days/yr
- Unhealthy air days in 30 yrs
- 10 days/yr
Risk factors via First Street. Map © Google.
Why this score? — see what drove the D grade
The composite is a weighted blend of 9 inputs, each scored 0–100. Each bar is that input's sub-score; the figure is the points it added to the 100-point composite (weight × sub-score).
- Cash flow +15.6/30.0
- ARV discount +9.9/15.0
- DSCR +4.8/10.0
- 1% rule +4.0/10.0
- Livability +3.2/5.0
- Rent growth +2.8/5.0
- Condition / age +2.5/5.0
- Schools +2.1/10.0
- Appreciation +0.0/10.0
$222,500
🖨 Deal sheet (PDF) 📄 Offer letter ✓ Due diligence
Listing remarks MLS
We LOVE that split-levels are making a trend comeback! ("Marcia, Marcia, Marcia!") Check out this Stone Mountain cutie at an affordable price. Located off Redan with easy access to Stone Mountain-Lithonia Rd, Covington Hwy, and I-20, SE/E of popular Pine Lake and Hidden Hills communities and minutes from growing Stone Mountain Village and Park. Eat-in kitchen with view to family room featuring a brick fireplace and sliding glass door view to large backyard. Family can't decide what to watch on TV? Fine! Two living rooms = ESPN AND Summer House. Large backyard features back deck and beautiful hardwood privacy fence. Check out a park (Biffle, Redan, or Stone Mountain) and then head to Outrun Brewing Company for an evening brewskie and Cherokee Rose for dinner! Home in less than 15 mins.
Key facts
- Split-level
- Easy access
- Brick fireplace
Tags
Property features AI
Exterior
- Parking: Attached garage with 2 spaces; Garage door opener; Garage faces front
- Utilities: Public water; Public sewer; Electric service with 110V and 220V in garage; Cable available; Natural gas available
- Home design: One-and-one-half story home; Brick front with frame construction; Block foundation; Composition roof
- Construction: Brick front and frame construction; Block foundation; Composition roof
- Exterior features: Private yard; Back yard fenced with wood fencing; Rain gutters; Deck
Interior
- Kitchen: White cabinets; Eat-in kitchen; View into family room; Range hood; Electric range; Refrigerator; Dishwasher
- Bedrooms: Three upper-level bedrooms; Roommate floor plan
- Flooring: Carpet; Laminate; Luxury vinyl; Tile
- Bathrooms: Two full bathrooms; Master bathroom with tub/shower combo
- Heating & cooling: Central heating (natural gas); Central air conditioning; Attic fan; Electric cooling components
- Interior features: Beamed ceilings; Entrance foyer; Vaulted ceilings; High-speed internet access; One fireplace with brick surround and gas starter (located in family room); Double-pane windows; No shared/common walls
- Laundry & utility: Washer and dryer included; Laundry located in garage; Gas water heater
Neighborhood map
What this means for you Summary
Snapshot
- This is a 3-bed/2.0-bath single-family listed at $222k.
Deal economics
- At list price, monthly cash flow is $95 ($1k/yr) — positive.
- The deal already cash-flows at list — no discount required.
- To meet the 1% rule (rent ≥ 1% of price), the offer needs to be $199k (10.4% below list).
- Recommended offer: $199k (10.4% below list) — sets the bar for 1% rule.
- Cap rate 6.8% vs local median 5.3% in Redan — meaningfully above typical; check what's discounted (condition, days-on-market, listing class) to confirm the premium yield is real.
Location & tenants
- Location reads 64/100 on livability (#274 in GA) — a middle-class / working-renter tenant base. Strengths: cost of living A+, housing A+; Watch: crime D, amenities F, commute F.
- Dekalb County (suburban): math 19% / reading 28% proficiency, ranked #125 of 174 in GA (top 72%) — low school quality limits family demand, transient renter base, plan for 1-2y turnover; 68% free/reduced lunch — lower-income household profile, screen leases tightly.
- Zoned schools: Redan Elementary School (math 8% / reading 12%, grade F, #1,092 of 1,228 statewide, top 91%, 521 students, 100% FRL); Redan Middle School (math 8% / reading 12%, grade F, #433 of 470 statewide, top 93%, 668 students, 100% FRL); Redan High School (math 8% / reading 17%, grade F, #336 of 424 statewide, top 80%, 951 students, 100% FRL) — zoned schools average 100% FRL vs 68% district-wide (32 pts higher); higher-poverty schools than district average — tighter screening recommended.
- Zoned-school proficiency averages 11% at this address vs 24% district-wide (-13 pts) — the specific schools serving this property underperform the Dekalb County average; the district grade overstates school quality for this exact location.
- Market conditions: Rents rising (+1.2%/yr); 444 active listings in the ZIP; 40 comparable units currently listed for rent nearby; rentals at typical pace (median 24d on market — plan ~3-4 weeks tenant-placement turnaround); 1,240 units permitted in DeKalb County in 2024 (385 in 5+ unit buildings).
- This rent runs 39% of the median local income ($62k/yr) — at the standard rent-burdened threshold; future hikes will face affordability resistance.
Forward outlook
- Local home prices are declining (-3.0%/yr); year-one equity from $2k of loan paydown is wiped out by about $7k of value loss. Plan a longer hold.
- DeKalb County population projected at +28% by 2050 — long-run rental-demand tailwind backs the buy-and-hold thesis.
Negotiation context
- Only 11 days on market — expect competitive offers; lowballing is unlikely to land.
- 5 sale attempts since 19y ago with the ask held roughly flat each time — persistent listings suggest the price (not the market) is what's stuck; bring a comps-based counter.
- Current owner paid $152k; 46% above their basis — modest negotiation headroom, anchor on the comps not their cost.
Risks & watch-outs
- Climate carrying-cost: moderate wind risk, 26% chance of damaging wind over 30y; extreme-heat days projected 7→18/yr by 2055 (HVAC capex compounding) — expect insurance premiums to compound above CPI over the hold.
Questions for the listing agent
- Is there a deadline driving the sale (1031 exchange, divorce, estate, relocation)? That informs how much negotiation room exists.
- Schools are B-rated — typically a magnet for longer-tenancy family renters. What's the average tenant stay here, and is there a school-zone premium baked into asking?
- Crime grade is D in this area — have there been break-ins, vandalism, or insurance claims at this property in the last 3 years? What carrier currently insures it and at what premium?
- The area grade is low — what's the realistic commute time and amenity access for the typical tenant pool here? Any planned neighborhood developments (good or bad) we should know about?
- What's the average days-on-market for RENTAL listings here right now (not sales)? A rising rental-DOM trend means longer vacancies and softer asking-rent achievability than the comps imply.
- What's the recent tenant-quality profile in this submarket — average credit score on applications, eviction rate, late-payment / NSF rate, and stable-employment percentage? A property-management company in the area should have these aggregated.
- How much new for-sale + rental construction is in the pipeline within 1–3 miles? Heavy new supply typically softens prices + rents 12–24 months out; constrained supply supports both.
Investment metrics
- 1% rule
- 0.90% ✗
- Cap rate
- 6.81%
- Cash-on-cash
- 1.83%
- DSCR
- 1.08
- GRM
- 9.3
CMA / ARV
- ARV (on-the-fly)
- $235,050
- Comps found
- 12
Show comp detail 12 sales within ~0.75 mi
| Address | Dist | Beds/Ba | Sqft | Sold | Price | $/sf | Match |
|---|---|---|---|---|---|---|---|
| 1748 Charmeth Rd | 0.23mi | 4/2.0 (+1) | 1,577 (+1%) | 2mo | $229,900 | $146 | 81 |
| 1598 Dillwood Ct | 0.22mi | 3/2.5 | 1,648 (+5%) | 1mo | $275,000 | $167 | 78 |
| 1579 Dillard Rd | 0.10mi | 3/3.0 | 1,407 (-10%) | 4mo | $219,000 | $156 | 71 |
| 5571 Tunbridge Wells Rd | 0.20mi | 3/2.0 | 1,367 (-13%) | 3mo | $220,000 | $161 | 67 |
| 5789 Dorian Ct | 0.37mi | 3/2.0 | 1,440 (-8%) | 3mo | $199,900 | $139 | 67 |
| 1937 Young Rd | 0.27mi | 3/2.0 | 1,378 (-12%) | 1mo | $210,000 | $152 | 66 |
| 1870 Taffeta Cv | 0.55mi | 3/2.0 | 1,485 (-5%) | 0mo | $155,000 | $104 | 66 |
| 1786 Dunbarton Dr | 0.29mi | 3/2.5 | 1,770 (+13%) | 4mo | $285,000 | $161 | 60 |
| 5404 Biffle Downs Rd | 0.47mi | 3/2.0 | 1,750 (+12%) | 0mo | $217,000 | $124 | 58 |
| 5509 Covent Way | 0.63mi | 3/2.0 | 1,456 (-7%) | 4mo | $171,000 | $117 | 56 |
| 1355 Stoneleigh Way | 0.47mi | 3/2.0 | 1,770 (+13%) | 4mo | $228,870 | $129 | 53 |
| 5328 Biffle Down Rd | 0.57mi | 3/2.0 | 1,357 (-13%) | 2mo | $204,125 | $150 | 49 |
Match score weights: distance 35% · size 25% · config 20% · recency 20%. Top-matched comps best support the ARV.
Projected returns pro-forma
-3.0% appreciation · 1.18% rent growth · sell at horizon
- IRR
- -15.4%
- Equity multiple
- 0.46×
- Total profit
- $-33,595
- Equity at exit
- $33,175
- IRR
- -10.2%
- Equity multiple
- 0.43×
- Total profit
- $-35,672
- Equity at exit
- $19,238
Cash invested: $62,300 (down + closing). Projections, not guarantees.
Landlord ↔ Tenant lean methodology
- Overall (STATE)
- 90 Strongly Landlord-Friendly
- State Georgia
- 90 Strongly Landlord-Friendly · R+3
- County
- — inherits STATE
- City
- — inherits STATE
ZIP-level market 30058
- Home prices YoY
- -21.4%
- Rents YoY
- 1.2%
- Active inventory
- 444
- Price-to-rent
- 9.3×
Monthly cashflow live
- Estimated rent
- $1,994 high interval (Pro) →
- Mortgage (P&I)
- −$1,167
- Tax from tax record
- −$221 /mo · $2,649/yr
- Insurance
- −$93
- HOA
- −$0
- Vacancy / Maint / Mgmt
- −$419
- Net cashflow
- $95
Break-even live
Sensitivity live
| Price | -10% $221 | -5% $158 | +0% $95 | +5% $32 | +10% $-31 |
|---|---|---|---|---|---|
| Rent | -10% $-63 | -5% $16 | +0% $95 | +5% $174 | +10% $253 |
| Rate | -1.0pp $207 | -0.5pp $152 | base $95 | +0.5pp $37 | +1.0pp $-21 |
UW: 25.0% down · 7.5% · 30yr · 1.5% tax · 5.0% vac · 8.0% maint · 8.0% mgmt
Financing live
Cash to close
- Down payment
- $55,625
- Closing costs
- $6,675
- Reserves months
- —
- Total cash needed
- —
Loan-product check · same deal, 3 products live
Conventional
25% down · 7.5% · 30yr
- Down + closing
- —
- Monthly P&I
- —
- Monthly cashflow
- —
- DSCR
- —
- Eligible?
- —
Personal DTI + credit; lowest rate.
DSCR
20% down · 8.5% · 30yr
- Down + closing
- —
- Monthly P&I
- —
- Monthly cashflow
- —
- DSCR
- —
- Eligible?
- —
No personal income docs; deal must DSCR.
Hard money
10% down · 12.0% · 12mo
- Down + closing
- —
- Monthly P&I
- —
- Monthly cashflow
- —
- DSCR
- —
- Eligible?
- —
Short-term bridge; refi at stabilization.
Rent comps 40 comps
| Address | Beds | Baths | Sqft | Rent | $/sqft | DOM | Units | Dist |
|---|---|---|---|---|---|---|---|---|
| 1610 Burnstone Dr Stone Mountain, GA | 3.0 | 2.0 | 1370 | $1,850 | $1.35 | 45d | 1 | 0.11mi |
| 1724 Laurel Creek Cir Lithonia, GA | 3.0 | 2.5 | 1558 | $1,935 | $1.24 | 14d | 1 | 0.24mi |
| 1487 Saint Dunstans Rd Lithonia, GA | 3.0 | 2.5 | 1650 | $1,973 | $1.20 | 0d | 1 | 0.33mi |
| 5739 Hilton Ridge Rd Lithonia, GA | 3.0 | 2.5 | 2000 | $1,820 | $0.91 | 3d | 1 | 0.34mi |
| 1652 Downs Xing Stone Mountain, GA | 3.0 | 2.5 | 1376 | $1,595 | $1.16 | 1d | 1 | 0.38mi |
| 1893 Gingham Way Lithonia, GA | 3.0 | 2.0 | 1144 | $1,730 | $1.51 | 18d | 1 | 0.45mi |
| 1717 Panola Rd Stone Mountain, GA | 3.0–4.0 | 2.5 | 2107 | $2,369 | $1.12 | 1d | 98 | 0.48mi |
| 1815 Herringbone Holw Lithonia, GA | 3.0 | 2.0 | 1812 | $1,750 | $0.97 | 45d | 1 | 0.57mi |
| 1964 Taffeta Trl Lithonia, GA | 3.0 | 2.0 | 1508 | $1,870 | $1.24 | 21d | 1 | 0.59mi |
| 1874 Vauxhall Dr Lithonia, GA | 3.0 | 2.0 | 1367 | $1,595 | $1.17 | 4d | 1 | 0.65mi |
| 1401 Panola Rd Stone Mountain, GA | 4.0 | 4.5 | 2000 | $2,975 | $1.49 | 45d | 1 | 0.66mi |
| 5579 Marbut Rd Lithonia, GA | 3.0 | 2.5 | 1280 | $1,850 | $1.45 | 45d | 1 | 0.67mi |
| 5799 Redan Rd Stone Mountain, GA | 3.0 | 2.0 | 1546 | $1,490 | $0.96 | 26d | 1 | 0.68mi |
| 5663 Saint Thomas Dr Lithonia, GA | 4.0 | 2.0 | 1230 | $1,595 | $1.30 | 14d | 1 | 0.70mi |
| 5811 Calico Ct Lithonia, GA | 4.0 | 2.5 | 2016 | $2,300 | $1.14 | 45d | 1 | 0.79mi |
| 2005 Marbut Forest Dr Lithonia, GA | 3.0 | 2.0 | 1556 | $1,900 | $1.22 | 7d | 1 | 0.82mi |
| 5974 S Deshon Ct Lithonia, GA | 4.0 | 2.5 | 1704 | $2,050 | $1.20 | 26d | 1 | 0.89mi |
| 5536 Downs Way Lithonia, GA | 3.0 | 2.0 | 1400 | $1,600 | $1.14 | 45d | 1 | 0.92mi |
| 2079 Panola Way Ct Lithonia, GA | 4.0 | 3.0 | 1971 | $1,850 | $0.94 | 26d | 1 | 0.99mi |
| 6014 Bretton Woods Dr Lithonia, GA | 4.0 | 2.5 | 1625 | $2,195 | $1.35 | 45d | 1 | 1.00mi |
| 1467 Muirfield Dr Stone Mountain, GA | 3.0 | 2.0 | 1630 | $1,870 | $1.15 | 23d | 1 | 1.01mi |
| 5452 Perching Pl Lithonia, GA | 3.0 | 2.5 | 2036 | $1,900 | $0.93 | 26d | 1 | 1.07mi |
| 2093 Drake Ct Lithonia, GA | 3.0 | 2.0 | 1168 | $1,604 | $1.37 | 1d | 1 | 1.07mi |
| 5550 Wellborn Creek Dr Lithonia, GA | 3.0 | 2.5 | 1850 | $2,085 | $1.13 | 3d | 1 | 1.11mi |
| 1958 Overton Trl Stone Mountain, GA | 3.0 | 2.0 | 1100 | $1,625 | $1.48 | 23d | 1 | 1.12mi |
| 5356 Olde St Stone Mountain, GA | 3.0 | 2.5 | 1560 | $1,745 | $1.12 | 22d | 1 | 1.17mi |
| 5622 Glen Ridge Bnd Lithonia, GA | 3.0 | 2.5 | 1967 | $2,110 | $1.07 | 26d | 1 | 1.19mi |
| 5386 Kristian Ct Stone Mountain, GA | 4.0 | 2.0 | 1531 | $1,901 | $1.24 | 26d | 1 | 1.22mi |
| 2090 Tidwell Trl Stone Mountain, GA | 3.0 | 2.0 | 1214 | $1,800 | $1.48 | 45d | 1 | 1.24mi |
| 5734 Lanny Ln Lithonia, GA | 3.0 | 2.0 | 1589 | $1,800 | $1.13 | 26d | 1 | 1.25mi |
| 2207 Clayton Rdg Lithonia, GA | 4.0 | 3.0 | 2175 | $2,400 | $1.10 | 45d | 1 | 1.25mi |
| 5349 Tracey Dr Stone Mountain, GA | 3.0 | 2.0 | 1188 | $1,975 | $1.66 | 18d | 1 | 1.26mi |
| 5349 Tracey Dr Stone Mountain, GA | 3.0 | 2.0 | 1188 | $1,975 | $1.66 | 45d | 1 | 1.26mi |
| 5972 Wellborn Trce Lithonia, GA | 3.0 | 2.0 | 1820 | $1,000 | $0.55 | 14d | 1 | 1.26mi |
| 5477 Wellborn Creek Dr Lithonia, GA | 3.0 | 3.0 | 2084 | $2,400 | $1.15 | 4d | 1 | 1.27mi |
| 2060 Kimber Trl Stone Mountain, GA | 3.0 | 2.0 | 1058 | $1,650 | $1.56 | 4d | 1 | 1.27mi |
| 2078 Kimber Trl Stone Mountain, GA | 3.0 | 2.0 | 1144 | $1,973 | $1.72 | 1d | 1 | 1.29mi |
| 2188 Justify LN #40 Lithonia, GA | 3.0 | 2.5 | 2085 | $2,400 | $1.15 | 45d | 1 | 1.30mi |
| 2244 Mulsanne Dr Lithonia, GA | 3.0 | 2.5 | 1750 | $2,250 | $1.29 | 7d | 1 | 1.30mi |
| 1168 Perry Way Stone Mountain, GA | 4.0 | 3.0 | 2100 | $1,200 | $0.57 | 3d | 1 | 1.31mi |
Listing history 7 events
-
2026-06-16status $222,500 Pending 11 DOM
-
2026-06-15days on market $222,500 Active Under Contract 11 DOM
-
2026-06-13statusdays on market $222,500 Active Under Contract 9 DOM
-
2026-06-09days on market $222,500 Active 5 DOM
-
2026-06-08days on market $222,500 Active 4 DOM
-
2026-06-07remarks 689-char remark
-
2026-06-07$222,500 Active 3 DOM
ⓘ Source: listings_history table (triggers on properties + properties_extension) + one-shot
backfill from property_details.listing_events for pre-trigger history.
Tax reassessment forecast GA · Resets to sale price
- Current annual tax
- $2,649 · $221/mo
- Projected year-2 tax
- $2,649 · $221/mo
- Expected delta
- $0/yr ($0/mo · 0.0%)
ⓘ Screening estimate from a state-policy table — verify with the county assessor before closing.
Climate risk First Street
- Flood 1/10 Low FEMA zone X (unshaded) · 0% chance over 30 yrs
- Wildfire 1/10 Low
- Heat 6/10 Major 7 d/yr ≥104°F today · 18 d/yr by 30 yrs out
- Wind 5/10 Major 26% chance of damaging wind over 30 yrs
- Air quality 5/10 Major 7 unhealthy d/yr today · 10 by 30 yrs out
Nearby sold comps map
Loading sold comps map…
Walkable amenities ~0.75 mi
Loading nearby amenities…
Taxation est. · year 1
- Rental income
- $23,929
- − Mortgage interest
- −$12,463
- − Property taxes
- −$2,649
- − Insurance
- −$1,112
- − Repairs & maintenance
- −$1,914
- − Management
- −$1,914
- − Depreciation
- −$6,473
- Taxable loss
- −$2,598
- Est. tax savings @ 24.0%
- +$623
- After-tax cash flow
- $1,764/yr
For passive investors: Depreciation is non-cash, so a rental often shows a tax loss while cash-flowing — sheltering income. Rental losses are passive: they offset passive income freely, and up to $25,000/yr can offset ordinary (W-2) income if you actively participate and your MAGI is under $100k (phasing out to $0 by $150k); unused losses carry forward. On sale, claimed depreciation is recaptured at up to 25%, and gains may owe capital-gains tax (a 1031 exchange can defer both). Figures are a year-1 estimate at your 24.0% rate — not tax advice; consult a CPA.
Schools (NCES district)
- District
- Dekalb County
- NCES district ID
- 1301740
- Math proficiency
- 19% ▼ -12.00%
- Reading proficiency
- 28% ▼ -7.00%
- Median HH income
- $51,448
- Composite
- 20.92/100
- National rank
- #8482
- State rank
- #125 of 174 in GA
Livability — Redan
- Score
- 64/100
- State rank
- #274
- US rank
- #14766
Category grades
Schools grade is shown separately in the Schools card above.
Census & demographics
- Census place
- Redan, GA
- County
- Dekalb County · 782,738 people
- City population
- 29,279
- Metro
- Atlanta-Sandy Springs-Alpharetta, GA
- Population (ZIP)
- 62,614
- Household income
- $61,684
- Rent vs Own
- Severe rent burden
- 3471.0
Population outlook (DeKalb County) Hauer SSP2
- Today (2025)
- 839,977 people
- By 2030
- 891,768 · +6.2%
- By 2040
- 988,894 · +17.7%
- By 2050
- 1,074,583 · +27.9%
- By 2075
- 1,245,026 · +48.2%
- By 2100
- 1,303,135 · +55.1%
Race, ethnicity, and origin ACS 2023
- Neighborhood character
- Predominantly Black (91%)
- Race & ethnicity
- Black 91% Hispanic / Latino 3% White 3% Two or more races 3%
- Common ancestry
- Hispanic 0%
- Foreign-born
- 12% · Canada, United Kingdom
- Languages at home
- 93% English-only · Spanish 2% French/Haitian/Cajun 1%
Political lean MEDSL · DeKalb
- 2024 margin
- Solid D (+64.8) · D 81.9% · R 17.1% · Other 1.0%
- 2008→2024 swing
- +6.1pp toward D · 2008: 58.6pp · 2024: 64.8pp
- All cycles
- 2024: D+64.8 2020: D+67.4 2016: D+64.8 2012: D+56.8 2008: D+58.6
Not yet ingested
- Civics
- —
Market trends
- HPI YoY
- ▼ -60.90%
- Current HPI
- 224.0366
- Rent YoY
- ▲ 1.18%
- Metro
- Atlanta-Sandy Springs-Alpharetta, GA
- State GDP YoY
- ▲ 2.66%
- F500 in state
- 28
Industry mix (Fortune 500 HQ in GA)
| Industry | F500 HQs | Revenue |
|---|---|---|
| Paper / Packaging | 2 | $29B |
|
||
| Retail | 1 | $160B |
|
||
| Transportation / Logistics | 1 | $91B |
|
||
| Airlines | 1 | $62B |
|
||
| Consumer Goods | 1 | $47B |
|
||
| Utilities | 1 | $25B |
|
||
Price history
+271.5% since first listed17 events — show timeline
- 2026-06-04 Listed $222,500 FMLS
- 2026-06-04 Listed $222,500 GAMLS
- 2020-08-26 Sold (Public Records) $152,500 Public Records
- 2020-08-21 Sold (MLS) $152,500 GAMLS
- 2020-08-21 Sold (MLS) $152,500 FMLS
- 2020-06-30 Pending — GAMLS
- 2020-06-30 Pending — FMLS
- 2020-06-25 Listed $149,900 GAMLS
- 2020-06-25 Listed $149,900 FMLS
- 2007-04-05 Sold (MLS) $110,720 FMLS
- 2007-01-02 Listed $104,900 FMLS
- 2005-04-27 Sold (Public Records) $105,000 Public Records
- 2003-05-20 Sold (Public Records) $128,000 Public Records
- 1990-03-01 Sold (Public Records) $63,900 Public Records
- 1990-02-16 Sold (Public Records) $63,900 Public Records
- 1988-09-09 Sold (Public Records) $74,000 Public Records
- 1982-10-29 Sold (Public Records) $59,900 Public Records
Property tax history
+4.3%/yrLatest (2025): $2,649 · -3.0% YoY. Source: county tax records.
Cash-flow waterfall
monthlySold comps — $/sqft
last 12 mo · ≤1 miLoading sold comps…