 🏷️ Likely Rental
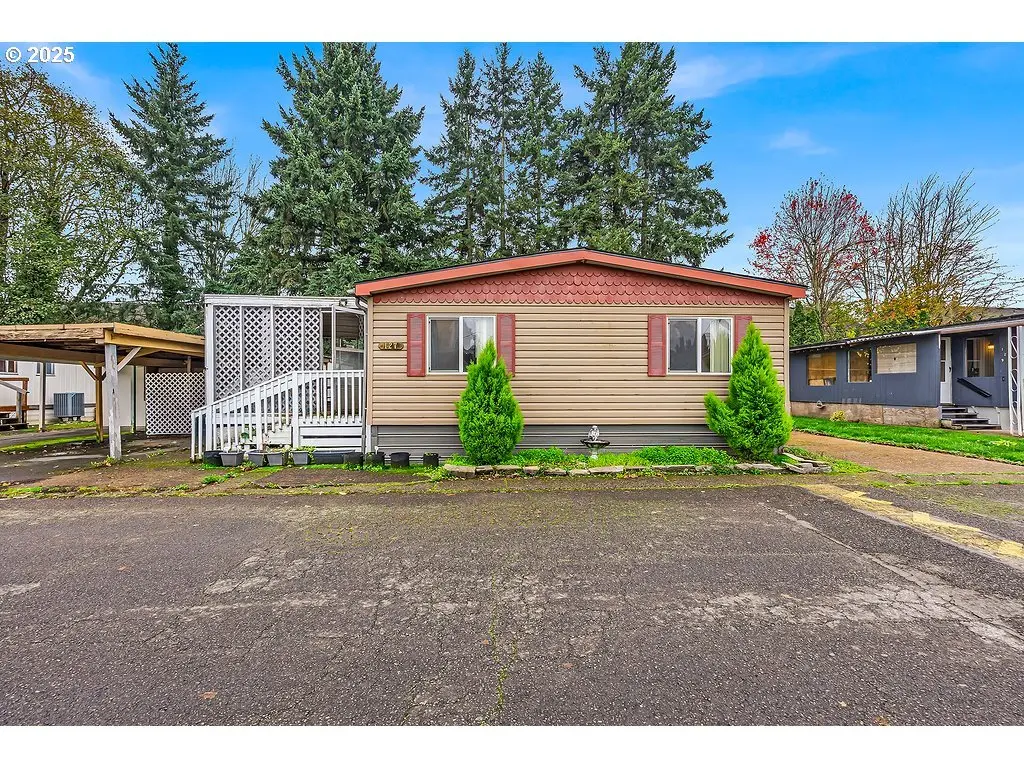
4882 NE Lancaster Dr #127 · Hayesville, OR
Flood risk 1/10 · Minimal
- FEMA flood zone
- X (unshaded)
- Chance of flooding over 30 yrs
- 0.0%
- Est. flood insurance / yr
- $507 – $1,088
Fire risk 1/10 · Minimal
- Est. fire insurance / yr
- $498 – $926
Heat risk 3/10 · Minor
- Hot days now (above 92°F)
- 7 days/yr
- Hot days in 30 yrs
- 14 days/yr
Wind risk 1/10 · Minimal
- Chance of severe wind over 30 yrs
- —
Air-quality risk 10/10 · Severe
- Unhealthy air days now
- 13 days/yr
- Unhealthy air days in 30 yrs
- 14 days/yr
Risk factors via First Street. Map © Google.
Why this score? — see what drove the D+ grade
The composite is a weighted blend of 9 inputs, each scored 0–100. Each bar is that input's sub-score; the figure is the points it added to the 100-point composite (weight × sub-score).
- Cash flow +15.0/30.0
- ARV discount +7.5/15.0
- 1% rule +5.0/10.0
- DSCR +5.0/10.0
- Livability +4.0/5.0
- Schools +3.7/10.0
- Rent growth +2.5/5.0
- Condition / age +2.5/5.0
- Appreciation +0.0/10.0
$25,000
🖨 Deal sheet 📄 Offer letter ✓ Due diligence
Listing remarks MLS
Incredible investment opportunity on this light fixer. 2 bed 2 bath double wide manufactured home in a 55+ community Park only. Cheapest price in town. Sold AS-IS. CASH ONLY preferred. Financing available. Space rent is $785/month.
Key facts
- Built 1984
- Listed 133 days
Neighborhood map
What this means for you Summary
Snapshot
- This is a 3-bed/2.0-bath manufactured listed at $25k.
Deal economics
- At list price, monthly cash flow is $1k ($15k/yr) — positive.
- The deal already cash-flows at list — no discount required.
- Meets the 1% rule at list price ($2k rent vs $25k).
- Recommended offer: $22k (12.0% below list) — sets the bar for market timing.
- Cap rate 65.6% vs local median 3.1% in Hayesville — top-decile yield for the area; either an underpriced asset or a hidden risk that comps aren't pricing in. Stress-test before assuming the spread holds.
Location & tenants
- Location reads 79/100 on livability (#63 in OR, #2,298 nationally) — a middle-class / working-renter tenant base. Strengths: commute A+, housing A+, health & safety A+; Watch: crime F, amenities F.
- Salem-Keizer SD 24J (urban): math 34% / reading 47% proficiency, ranked #103 of 183 in OR (top 56%) — families likely to look elsewhere, expect single-tenant / working-renter base with shorter leases.
- Market conditions: 175 active listings in the ZIP; 33 comparable units currently listed for rent nearby; rentals at typical pace (median 24d on market — plan ~3-4 weeks tenant-placement turnaround); 42% of comp listings sitting > 30 days — soft ceiling on asking rent; 1,591 units permitted in Marion County in 2024 (716 in 5+ unit buildings).
Forward outlook
- Local home prices are declining (-3.0%/yr); year-one equity from $173 of loan paydown is wiped out by about $750 of value loss. Plan a longer hold.
- Marion County population projected at +17% by 2050 — long-run rental-demand tailwind backs the buy-and-hold thesis.
- At projected returns (-3.0% appreciation + 3.0% rent growth), your $7k cash investment doubles in ~1 year — after that, you're playing with house money.
Negotiation context
- It's been on market 133 days — a 12% lower offer ($22k) is reasonable based on typical stale-listing flexibility.
Questions for the listing agent
- It's been on market 133 days. Have you received any prior offers? Is the seller open to a 12% concession, seller financing, or rate buy-down credit?
- Why hasn't it sold? Are there any deal-killer items the seller is aware of (foundation, flood, title, zoning, code violations)?
- Is there a deadline driving the sale (1031 exchange, divorce, estate, relocation)? That informs how much negotiation room exists.
- Crime grade is F in this area — have there been break-ins, vandalism, or insurance claims at this property in the last 3 years? What carrier currently insures it and at what premium?
- The area grade is low — what's the realistic commute time and amenity access for the typical tenant pool here? Any planned neighborhood developments (good or bad) we should know about?
- What's the average days-on-market for RENTAL listings here right now (not sales)? A rising rental-DOM trend means longer vacancies and softer asking-rent achievability than the comps imply.
- What's the recent tenant-quality profile in this submarket — average credit score on applications, eviction rate, late-payment / NSF rate, and stable-employment percentage? A property-management company in the area should have these aggregated.
- How much new for-sale + rental construction is in the pipeline within 1–3 miles? Heavy new supply typically softens prices + rents 12–24 months out; constrained supply supports both.
Investment metrics
- 1% rule
- 7.20% ✓
- Cap rate
- 65.60%
- Cash-on-cash
- 211.81%
- DSCR
- 10.42
- GRM
- 1.2
CMA / ARV
- ARV (median comp)
- $97,312
- List price
- $25,000
- Delta
- -74.31%
- Verdict
- UNDERPRICED
- Comps
- 20 within 1.0 mi
Show comp detail 12 sales within ~0.75 mi
| Address | Dist | Beds/Ba | Sqft | Sold | Price | $/sf | Match |
|---|---|---|---|---|---|---|---|
| 4783 38th Ave NE #17 | 0.38mi | 3/2.0 | 1,196 (-4%) | 5mo | $125,000 | $105 | 71 |
| 5422 Portland Rd NE #37 | 0.54mi | 3/2.0 | 1,296 (+4%) | 4mo | $39,000 | $30 | 65 |
| 5422 Portland Rd NE Unit 22 | 0.54mi | 3/2.0 | 1,296 (+4%) | 7mo | $122,000 | $94 | 63 |
| 5422 Portland Rd NE #80 | 0.54mi | 3/2.0 | 1,344 (+8%) | 1mo | $81,000 | $60 | 61 |
| 5422 Portland Rd NE #47 | 0.54mi | 3/2.0 | 1,344 (+8%) | 4mo | $35,000 | $26 | 59 |
| 4230 Hazelgreen Rd NE #52 | 0.67mi | 2/2.0 (-1) | 1,200 (-4%) | 3mo | $32,000 | $27 | 55 |
| 5422 Portland Rd NE #56 | 0.54mi | 2/2.0 (-1) | 1,152 (-8%) | 3mo | $38,500 | $33 | 54 |
| 5287 Gold Dust St #222 | 0.47mi | 4/2.0 (+1) | 1,404 (+12%) | 4mo | $136,850 | $97 | 49 |
| 5422 Portland Rd #35 | 0.54mi | 3/2.0 | 1,404 (+12%) | 7mo | $73,000 | $52 | 48 |
| 4293 Lemon St NE | 0.69mi | 2/2.0 (-1) | 1,152 (-8%) | 3mo | $60,000 | $52 | 47 |
| 5422 Portland Rd NE #33 | 0.54mi | 2/2.0 (-1) | 1,080 (-14%) | 2mo | $60,000 | $56 | 46 |
| 4353 Lemon St NE | 0.72mi | 3/2.0 | 1,386 (+11%) | 4mo | $57,500 | $41 | 45 |
Match score weights: distance 35% · size 25% · config 20% · recency 20%. Top-matched comps best support the ARV.
Projected returns pro-forma
-3.0% appreciation · 3.0% rent growth · sell at horizon
- IRR
- —
- Equity multiple
- 11.67×
- Total profit
- $74,679
- Equity at exit
- $3,728
- IRR
- —
- Equity multiple
- 24.79×
- Total profit
- $166,506
- Equity at exit
- $2,162
Cash invested: $7,000 (down + closing). Projections, not guarantees.
Landlord ↔ Tenant lean methodology
- Overall (STATE)
- 28 Tenant-Leaning
- State Oregon
- 28 Tenant-Leaning · D+6
- County
- — inherits STATE
- City
- — inherits STATE
ZIP-level market 97305
- Active inventory
- 175
- Price-to-rent
- 1.2×
Monthly cashflow live
- Estimated rent
- $1,800 high interval (Pro) →
- Mortgage (P&I)
- −$131
- Tax from tax record
- −$45 /mo · $538/yr
- Insurance
- −$10
- HOA
- −$0
- Vacancy / Maint / Mgmt
- −$378
- Net cashflow
- $1,236
Break-even live
UW: 25.0% down · 7.5% · 30yr · 1.5% tax · 5.0% vac · 8.0% maint · 8.0% mgmt
Financing live
Cash to close
- Down payment
- $6,250
- Closing costs
- $750
- Reserves months
- —
- Total cash needed
- —
Loan-product check · same deal, 3 products live
Conventional
25% down · 7.5% · 30yr
- Down + closing
- —
- Monthly P&I
- —
- Monthly cashflow
- —
- DSCR
- —
- Eligible?
- —
Personal DTI + credit; lowest rate.
DSCR
20% down · 8.5% · 30yr
- Down + closing
- —
- Monthly P&I
- —
- Monthly cashflow
- —
- DSCR
- —
- Eligible?
- —
No personal income docs; deal must DSCR.
Hard money
10% down · 12.0% · 12mo
- Down + closing
- —
- Monthly P&I
- —
- Monthly cashflow
- —
- DSCR
- —
- Eligible?
- —
Short-term bridge; refi at stabilization.
Rent comps 33 comps
| Address | Beds | Baths | Sqft | Rent | $/sqft | DOM | Units | Dist |
|---|---|---|---|---|---|---|---|---|
| 4115 Geranium Loop NE Salem, OR | 3.0 | 2.5 | 1316 | $2,250 | $1.71 | 13d | 1 | 0.08mi |
| 4828 Lancaster Dr NE Salem, OR | 2.0 | 1.0 | 832 | $1,435 | $1.72 | 13d | 5 | 0.17mi |
| 4040 Hayesville Dr NE Salem, OR | 1.0–3.0 | 1.0–2.0 | 927 | $1,995 | $2.15 | 13d | 25 | 0.36mi |
| 4624 Lancaster Dr NE Salem, OR | 2.0–3.0 | 2.0–2.5 | 963 | $2,325 | $2.41 | 13d | 10 | 0.49mi |
| 5115 Countryside St NE Salem, OR | 3.0 | 1.0–2.0 | 876 | $2,260 | $2.58 | 13d | 20 | 0.61mi |
| 4823 Settlers Dr NE Salem, OR | 3.0 | 2.0 | 1228 | $2,395 | $1.95 | 43d | 1 | 0.85mi |
| 4007 Iberis St NE Unit 4007 Salem, OR | 2.0 | 1.0 | 850 | $1,195 | $1.41 | 43d | 1 | 0.87mi |
| 3942 Ward Dr NE Salem, OR | 1.0–2.0 | 1.0–2.0 | 775 | $1,550 | $2.00 | 43d | 3 | 0.89mi |
| 4334 Ward Pl NE Unit 1 Salem, OR | 3.0 | 1.5 | 1250 | $1,775 | $1.42 | 43d | 1 | 0.89mi |
| 3875 Iberis St NE Salem, OR | 2.0 | 1.0 | 707 | $1,295 | $1.83 | 23d | 1 | 0.92mi |
| 4375 Falcon View Way NE Salem, OR | 2.0 | 1.0 | 842 | $1,395 | $1.66 | 43d | 1 | 0.92mi |
| 3813 Iberis St NE Salem, OR | 2.0 | 1.0 | 868 | $1,295 | $1.49 | 13d | 1 | 0.94mi |
| 3807 Iberis St NE Salem, OR | 2.0 | 1.0 | 868 | $1,295 | $1.49 | 23d | 1 | 0.94mi |
| 4370 Fisher Rd NE Unit 203 Salem, OR | 2.0 | 2.0 | 1092 | $1,545 | $1.41 | 13d | 1 | 0.96mi |
| 3792 Iberis St NE Salem, OR | 2.0 | 1.0 | 868 | $1,145 | $1.32 | 23d | 1 | 0.96mi |
| 4473 47th Ave NE Salem, OR | 3.0 | 1.0 | 1244 | $2,200 | $1.77 | 43d | 1 | 0.97mi |
| 4209 Satter Pl NE Salem, OR | 2.0 | 1.0 | 850 | $1,195 | $1.41 | 13d | 2 | 0.99mi |
| 3568 NE Cherry Glen Pl Salem, OR | 2.0 | 2.0 | 952 | $1,495 | $1.57 | 13d | 7 | 0.99mi |
| 4097-4207 Satter Dr NE Unit 4139 Salem, OR | 2.0 | 1.0 | 775 | $1,195 | $1.54 | 43d | 1 | 1.01mi |
| 4001 Satter Dr NE Unit 4067 Salem, OR | 2.0 | 1.0 | 850 | $1,195 | $1.41 | 43d | 1 | 1.05mi |
| 4097 Satter Dr NE Unit 4157 Salem, OR | 2.0 | 1.0 | 775 | $1,195 | $1.54 | 13d | 1 | 1.05mi |
| 5034 Armstrong Ave NE Salem, OR | 3.0 | 2.5 | 1400 | $2,550 | $1.82 | 43d | 1 | 1.14mi |
| 4116 Lancaster Dr NE Unit 4116 Salem, OR | 2.0 | 1.5 | 1100 | $1,295 | $1.18 | 23d | 1 | 1.17mi |
| 4114 Lancaster Dr NE Unit 4114 Salem, OR | 2.0 | 1.5 | 1100 | $1,295 | $1.18 | 43d | 1 | 1.17mi |
| 2768 Claxter Rd NE Salem, OR | 1.0–2.0 | 1.0–2.0 | 810 | $1,599 | $1.97 | 13d | 3 | 1.22mi |
| 4261 Hawthorne Ave NE Unit 218 Salem, OR | 2.0 | 2.0 | 952 | $1,500 | $1.58 | 43d | 1 | 1.22mi |
| 4245 Hawthorne Ave NE Salem, OR | 2.0 | 2.0 | 952 | $1,450 | $1.52 | 23d | 1 | 1.24mi |
| 2540 Hyacinth St NE Salem, OR | 1.0–2.0 | 1.0 | 665 | $1,220 | $1.83 | 13d | 2 | 1.40mi |
| 3295 Felina Ave NE Unit 85G Salem, OR | 2.0 | 1.0 | 900 | $1,399 | $1.55 | 43d | 1 | 1.40mi |
| 3295 Felina Ave NE Unit 55A Salem, OR | 2.0 | 1.0 | 900 | $1,479 | $1.64 | 43d | 1 | 1.40mi |
| 3295 Felina Ave NE Unit 15H Salem, OR | 2.0 | 1.0 | 900 | $1,459 | $1.62 | 43d | 1 | 1.40mi |
| 1813 Drexler Ln NE Unit 5095-202 Keizer, OR | 2.0 | 1.0 | 848 | $1,400 | $1.65 | 23d | 1 | 1.45mi |
| 5188 Perry St NE Keizer, OR | 3.0 | 2.0 | 1362 | $2,550 | $1.87 | 13d | 1 | 1.49mi |
Listing history 19 events
-
2026-06-18days on market $25,000 Active 133 DOM
-
2026-06-17days on market $25,000 Active 132 DOM
-
2026-06-16days on market $25,000 Active 131 DOM
-
2026-06-15days on market $25,000 Active 130 DOM
-
2026-06-14days on market $25,000 Active 128 DOM
-
2026-06-10days on market $25,000 Active 125 DOM
-
2026-06-09days on market $25,000 Active 124 DOM
-
2026-06-08days on market $25,000 Active 123 DOM
-
2026-06-07days on market $25,000 Active 122 DOM
-
2026-06-03days on market $25,000 Active 118 DOM
-
2026-06-02days on market $25,000 Active 117 DOM
-
2026-06-01days on market $25,000 Active 116 DOM
-
2026-05-31days on market $25,000 Active 115 DOM
-
2026-05-30days on market $25,000 Active 114 DOM
-
2025-11-26$25,000 Active 232-char remark
Show marketing remark (232 chars)
Incredible investment opportunity on this light fixer. 2 bed 2 bath double wide manufactured home in a 55+ community Park only. Cheapest price in town. Sold AS-IS. CASH ONLY preferred. Financing available. Space rent is $785/month.
-
2025-08-07price $25,000
-
2025-07-03price $35,000
-
2025-06-04price $55,000
-
1984-04-03soldstatus $27,828
ⓘ Source: listings_history table (triggers on properties + properties_extension) + one-shot
backfill from property_details.listing_events for pre-trigger history.
Tax reassessment forecast OR · Resets to sale price
- Current annual tax
- $538 · $45/mo
- Projected year-2 tax
- $538 · $45/mo
- Expected delta
- $0/yr ($0/mo · 0.0%)
ⓘ Screening estimate from a state-policy table — verify with the county assessor before closing.
Climate risk First Street
- Flood 1/10 Low FEMA zone X (unshaded) · 0% chance over 30 yrs
- Wildfire 1/10 Low
- Heat 3/10 Moderate 7 d/yr ≥92°F today · 14 d/yr by 30 yrs out
- Wind 1/10 Low
- Air quality 10/10 Extreme 13 unhealthy d/yr today · 14 by 30 yrs out
Nearby sold comps map
Loading sold comps map…
Walkable amenities ~0.75 mi
Loading nearby amenities…
Taxation est. · year 1
- Rental income
- $21,599
- − Mortgage interest
- −$1,400
- − Property taxes
- −$538
- − Insurance
- −$125
- − Repairs & maintenance
- −$1,728
- − Management
- −$1,728
- − Depreciation
- −$727
- Taxable income
- $15,353
- Est. tax owed @ 24.0%
- −$3,685
- After-tax cash flow
- $11,142/yr
For passive investors: Depreciation is non-cash, so a rental often shows a tax loss while cash-flowing — sheltering income. Rental losses are passive: they offset passive income freely, and up to $25,000/yr can offset ordinary (W-2) income if you actively participate and your MAGI is under $100k (phasing out to $0 by $150k); unused losses carry forward. On sale, claimed depreciation is recaptured at up to 25%, and gains may owe capital-gains tax (a 1031 exchange can defer both). Figures are a year-1 estimate at your 24.0% rate — not tax advice; consult a CPA.
Schools (NCES district)
- District
- Salem-Keizer SD 24J
- NCES district ID
- 4110820
- Math proficiency
- 34% ▼ -1.00%
- Reading proficiency
- 47% ▼ -2.00%
- Median HH income
- $48,632
- Composite
- 37.16/100
- National rank
- #9017
- State rank
- #103 of 183 in OR
Livability — Hayesville
- Score
- 79/100
- State rank
- #63
- US rank
- #2298
Category grades
Schools grade is shown separately in the Schools card above.
Census & demographics
- Census place
- Hayesville, OR
- Population (ZIP)
- 45,044
Population outlook (Marion County) Hauer SSP2
- Today (2025)
- 360,940 people
- By 2030
- 375,178 · +3.9%
- By 2040
- 400,914 · +11.1%
- By 2050
- 422,187 · +17.0%
- By 2075
- 460,305 · +27.5%
- By 2100
- 464,025 · +28.6%
Race, ethnicity, and origin ACS 2023
- Neighborhood character
- Diverse neighborhood (Simpson 0.61)
- Race & ethnicity
- Hispanic / Latino 44% White 44% Two or more races 16% Asian 3% Pacific Islander 3% Native American 3% Black 1%
- Hispanic origin (detail)
- Mexican 41%
- Common ancestry
- Italian 2% Slovak 2% Scotch-Irish 2%
- Foreign-born
- 23% · Canada, China
- Languages at home
- 57% English-only · Spanish 35% Other Asian/Pacific 3% Russian/Polish/Slavic 2%
Political lean MEDSL · Marion
- 2024 margin
- Toss-up / Even · D 47.5% · R 49.5% · Other 3.0%
- 2008→2024 swing
- -4.2pp toward R · 2008: 2.2pp · 2024: -2.0pp
- All cycles
- 2024: R+2.0 2020: D+1.1 2016: R+5.0 2012: R+3.5 2008: D+2.2
Not yet ingested
- Civics
- —
Market trends
- HPI YoY
- ▼ -328.50%
- Current HPI
- 296.3428
- Rent YoY
- —
- Metro
- —
- State GDP YoY
- ▲ 2.05%
- F500 in state
- 2
Industry mix (Fortune 500 HQ in OR)
| Industry | F500 HQs | Revenue |
|---|---|---|
| Consumer Goods | 1 | $51B |
|
||
Price history
-10.2% since first listed5 events — show timeline
- 2025-11-26 Listed $25,000 RMLS
- 2025-08-07 Price Changed $25,000 WVMLS
- 2025-07-03 Price Changed $35,000 WVMLS
- 2025-06-04 Price Changed $55,000 WVMLS
- 1984-04-03 Sold (Public Records) $27,828 Public Records
Property tax history
+3.8%/yrLatest (2025): $538 · +2.9% YoY. Source: county tax records.
Cash-flow waterfall
monthlySold comps — $/sqft
last 12 mo · ≤1 miLoading sold comps…