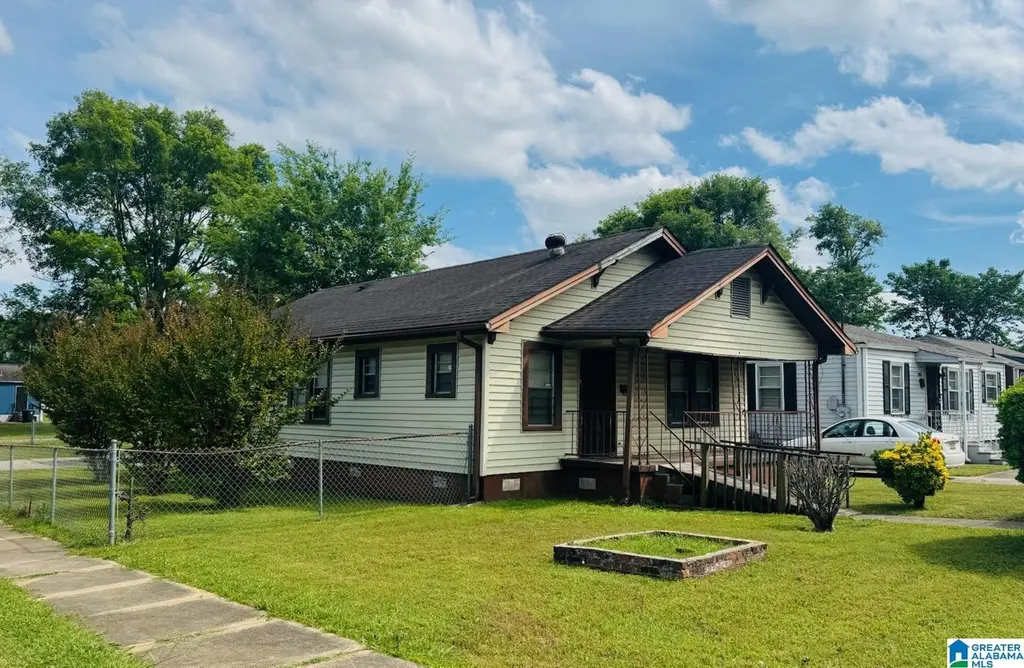
2601 Avenue C · Birmingham, AL
Flood risk 1/10 · Minimal
- FEMA flood zone
- X (unshaded)
- Chance of flooding over 30 yrs
- 0.0%
- Est. flood insurance / yr
- $507 – $1,088
Fire risk 3/10 · Minor
- Est. fire insurance / yr
- $916 – $1,700
Heat risk 7/10 · Major
- Hot days now (above 107°F)
- 7 days/yr
- Hot days in 30 yrs
- 20 days/yr
Wind risk 6/10 · Moderate
- Chance of severe wind over 30 yrs
- 27.0%
Air-quality risk 4/10 · Minor
- Unhealthy air days now
- 5 days/yr
- Unhealthy air days in 30 yrs
- 5 days/yr
Risk factors via First Street. Map © Google.
Why this score? — see what drove the B grade
The composite is a weighted blend of 9 inputs, each scored 0–100. Each bar is that input's sub-score; the figure is the points it added to the 100-point composite (weight × sub-score).
- Cash flow +30.0/30.0
- 1% rule +10.0/10.0
- DSCR +10.0/10.0
- ARV discount +6.5/15.0
- Appreciation +4.2/10.0
- Livability +3.4/5.0
- Rent growth +2.5/5.0
- Condition / age +2.5/5.0
- Schools +0.9/10.0
$69,900
🖨 Deal sheet 📄 Offer letter ✓ Due diligence
Listing remarks MLS
INVESTOR'S TAKE A LOOK!! 3 BEDROOM, 1 BATH HOME WITH A NICE SIZE KITCHEN, DINING ROOM. THIS HOME JUST NEED A LITTLE TLC. This is a Fannie Mae HomePath property. Buy this home with as little as 3% down. Right of Redemption may apply.
Key facts
- 7,405 sq ft lot
- Parking
- Built 1987
Property features AI
Finance
- Other: Lot size about 0.17 acres; Parcel ID available
Exterior
- Parking: Detached garage/parking; Driveway parking; One carport space
- Utilities: Public water; Connected sewer; Internet service available; Electric water heater
- Home design: Existing/established property; Wood construction; Crawl space foundation
- Construction: Wood construction; Crawl space foundation
- Exterior features: Fenced yard; No pool; No patio, deck, or garden/patio listed; Not waterfront
Interior
- Kitchen: Kitchen on main level
- Bedrooms: Multiple bedrooms on main level
- Flooring: Carpet
- Bathrooms: One full bathroom with tub/shower combo
- Heating & cooling: Central heating; Central cooling
- Interior features: Carpet flooring; Ceilings: see remarks; No additional interior built-ins or special features listed
- Laundry & utility: Main-level laundry; Washer hookup; Electric dryer hookup; Electric water heater
Neighborhood map
What this means for you Summary
Snapshot
- This is a 3-bed/1.0-bath single-family listed at $70k.
Deal economics
- At list price, monthly cash flow is $334 ($4k/yr) — positive.
- The deal already cash-flows at list — no discount required.
- Meets the 1% rule at list price ($1k rent vs $70k).
- Recommended offer: $68k (3.0% below list) — sets the bar for market timing.
- Cap rate 12.0% vs local median 6.2% in Birmingham — top-decile yield for the area; either an underpriced asset or a hidden risk that comps aren't pricing in. Stress-test before assuming the spread holds.
Location & tenants
- Location reads 67/100 on livability (#78 in AL) — a middle-class / working-renter tenant base. Strengths: commute A+, cost of living A+, housing A+; Watch: amenities C-, crime F, employment F.
- Birmingham City (urban): math 4% / reading 20% proficiency, ranked #116 of 129 in AL (top 90%) — low school quality limits family demand, transient renter base, plan for 1-2y turnover; 82% free/reduced lunch — lower-income household profile, screen leases tightly.
- Zoned schools: Wylam Elementary School (math 2% / reading 12%, grade F, #601 of 627 statewide, top 98%, 371 students, 89% FRL).
- Market conditions: 50 active listings in the ZIP; 40 comparable units currently listed for rent nearby; rentals lingering (median 44d on market — plan ~5-8 weeks vacancy on turnover, expect pricing pressure); 60% of comp listings sitting > 30 days — soft ceiling on asking rent; lower-income renter base — watch delinquency; 2,114 units permitted in Jefferson County in 2024 (556 in 5+ unit buildings).
- This rent runs 41% of the median local income ($31k/yr) — at the standard rent-burdened threshold; future hikes will face affordability resistance.
Forward outlook
- Local home prices are declining (-1.5%/yr); year-one equity from $483 of loan paydown is wiped out by about $1k of value loss. Plan a longer hold.
- Jefferson County population projected to shrink 4% by 2050 — rents likely to lag national; underwrite the cash flow, not the appreciation.
- At projected returns (-1.5% appreciation + 3.0% rent growth), your $20k cash investment doubles in ~5 years — after that, you're playing with house money.
Negotiation context
- It's been on market 40 days — a 3% lower offer ($68k) is reasonable based on typical stale-listing flexibility.
- 2 sale attempts since 13y ago with the ask held roughly flat each time — persistent listings suggest the price (not the market) is what's stuck; bring a comps-based counter.
- Current owner paid $11k; list at $70k implies a 535% gain — meaningful room to come down on a strong offer.
Risks & watch-outs
- Climate carrying-cost: major wind risk, 27% chance of damaging wind over 30y; extreme-heat days projected 7→20/yr by 2055 (HVAC capex compounding) — expect insurance premiums to compound above CPI over the hold.
Questions for the listing agent
- It's been on market 40 days. Have you received any prior offers? Is the seller open to a 3% concession, seller financing, or rate buy-down credit?
- Is there a deadline driving the sale (1031 exchange, divorce, estate, relocation)? That informs how much negotiation room exists.
- Schools are F-rated, which usually means shorter tenancies and higher turnover. Who's the typical renter profile here, and what's been the actual vacancy rate?
- Crime grade is F in this area — have there been break-ins, vandalism, or insurance claims at this property in the last 3 years? What carrier currently insures it and at what premium?
- What's the average days-on-market for RENTAL listings here right now (not sales)? A rising rental-DOM trend means longer vacancies and softer asking-rent achievability than the comps imply.
- What's the recent tenant-quality profile in this submarket — average credit score on applications, eviction rate, late-payment / NSF rate, and stable-employment percentage? A property-management company in the area should have these aggregated.
- How much new for-sale + rental construction is in the pipeline within 1–3 miles? Heavy new supply typically softens prices + rents 12–24 months out; constrained supply supports both.
Investment metrics
- 1% rule
- 1.52% ✓
- Cap rate
- 12.03%
- Cash-on-cash
- 20.49%
- DSCR
- 1.91
- GRM
- 5.5
CMA / ARV
- ARV (median comp)
- $68,380
- List price
- $69,900
- Delta
- 2.22%
- Verdict
- FAIR
- Comps
- 20 within 1.0 mi
Show comp detail 12 sales within ~0.75 mi
| Address | Dist | Beds/Ba | Sqft | Sold | Price | $/sf | Match |
|---|---|---|---|---|---|---|---|
| 3112 Avenue F | 0.42mi | 3/1.0 | 1,024 (-6%) | 5mo | $74,000 | $72 | 66 |
| 3205 Avenue G | 0.51mi | 3/2.0 | 1,108 (+2%) | 9mo | $123,900 | $112 | 62 |
| 2617 Avenue K | 0.57mi | 3/1.0 | 1,046 (-4%) | 10mo | $60,000 | $57 | 58 |
| 2604 Avenue L | 0.60mi | 2/1.0 (-1) | 1,088 (-0%) | 16mo | $57,500 | $53 | 53 |
| 2513 Avenue J | 0.51mi | 2/1.0 (-1) | 1,028 (-6%) | 13mo | $79,391 | $77 | 51 |
| 2513 Avenue I | 0.44mi | 3/1.5 | 1,008 (-8%) | 17mo | $54,000 | $54 | 51 |
| 3300 Avenue H | 0.59mi | 3/1.0 | 986 (-10%) | 13mo | $89,495 | $91 | 46 |
| 3005 Avenue G | 0.41mi | 3/2.0 | 1,194 (+9%) | 19mo | $87,000 | $73 | 45 |
| 2600 Avenue L | 0.61mi | 2/1.0 (-1) | 988 (-10%) | 12mo | $82,750 | $84 | 41 |
| 811 W 17th St | 0.73mi | 3/1.0 | 1,146 (+5%) | 22mo | $57,000 | $50 | 40 |
| 3409 Avenue D | 0.58mi | 2/1.0 (-1) | 928 (-15%) | 23mo | $15,000 | $16 | 24 |
| 3416 Avenue H | 0.68mi | 3/2.0 | 1,228 (+12%) | 23mo | $90,000 | $73 | 24 |
Match score weights: distance 35% · size 25% · config 20% · recency 20%. Top-matched comps best support the ARV.
Projected returns pro-forma
-1.54% appreciation · 3.0% rent growth · sell at horizon
- IRR
- 16.7%
- Equity multiple
- 1.73×
- Total profit
- $14,363
- Equity at exit
- $15,080
- IRR
- 23.1%
- Equity multiple
- 3.25×
- Total profit
- $44,026
- Equity at exit
- $14,354
Cash invested: $19,572 (down + closing). Projections, not guarantees.
Landlord ↔ Tenant lean methodology
- Overall (STATE)
- 90 Strongly Landlord-Friendly
- State Alabama
- 90 Strongly Landlord-Friendly · R+15
- County
- — inherits STATE
- City
- — inherits STATE
ZIP-level market 35218
- Home prices YoY
- -0.9%
- Active inventory
- 50
- Price-to-rent
- 5.5×
Monthly cashflow live
- Estimated rent
- $1,060 high interval (Pro) →
- Mortgage (P&I)
- −$367
- Tax from tax record
- −$108 /mo · $1,290/yr
- Insurance
- −$29
- HOA
- −$0
- Vacancy / Maint / Mgmt
- −$223
- Net cashflow
- $334
Break-even live
UW: 25.0% down · 7.5% · 30yr · 1.5% tax · 5.0% vac · 8.0% maint · 8.0% mgmt
Financing live
Cash to close
- Down payment
- $17,475
- Closing costs
- $2,097
- Reserves months
- —
- Total cash needed
- —
Loan-product check · same deal, 3 products live
Conventional
25% down · 7.5% · 30yr
- Down + closing
- —
- Monthly P&I
- —
- Monthly cashflow
- —
- DSCR
- —
- Eligible?
- —
Personal DTI + credit; lowest rate.
DSCR
20% down · 8.5% · 30yr
- Down + closing
- —
- Monthly P&I
- —
- Monthly cashflow
- —
- DSCR
- —
- Eligible?
- —
No personal income docs; deal must DSCR.
Hard money
10% down · 12.0% · 12mo
- Down + closing
- —
- Monthly P&I
- —
- Monthly cashflow
- —
- DSCR
- —
- Eligible?
- —
Short-term bridge; refi at stabilization.
Rent comps 40 comps
| Address | Beds | Baths | Sqft | Rent | $/sqft | DOM | Units | Dist |
|---|---|---|---|---|---|---|---|---|
| 3011 Avenue D Birmingham, AL | 2.0 | 1.0 | 1000 | $795 | $0.80 | 44d | 1 | 0.27mi |
| 3015 Avenue C Unit C Birmingham, AL | 2.0 | 1.0 | 1000 | $825 | $0.82 | 44d | 1 | 0.27mi |
| 3201 Avenue E Birmingham, AL | 3.0 | 1.0 | 1056 | $925 | $0.88 | 44d | 1 | 0.42mi |
| 2908 Avenue I Unit I Ensley, AL | 3.0 | 1.0 | 1383 | $1,025 | $0.74 | 24d | 1 | 0.46mi |
| 3212 Avenue G Unit G Ensley, AL | 2.0 | 1.0 | 902 | $850 | $0.94 | 44d | 1 | 0.50mi |
| 3100 Avenue J Birmingham, AL | 3.0 | 1.0 | 1409 | $1,000 | $0.71 | 10d | 1 | 0.58mi |
| 2617 Avenue K Birmingham, AL | 4.0 | 2.0 | 1046 | $1,495 | $1.43 | 2d | 1 | 0.59mi |
| 2520 Avenue L Unit A Birmingham, AL | 4.0 | 1.5 | 1260 | $1,150 | $0.91 | 24d | 1 | 0.63mi |
| 1001 21st Street Ensley Unit B Birmingham, AL | 2.0 | 1.0 | 700 | $725 | $1.04 | 16d | 1 | 0.65mi |
| 3517 Avenue F Birmingham, AL | 3.0 | 2.0 | 1155 | $1,200 | $1.04 | 44d | 1 | 0.68mi |
| 1313 Pike Rd Birmingham, AL | 3.0 | 1.0 | 1437 | $975 | $0.68 | 44d | 1 | 0.74mi |
| 811 17th Aly Birmingham, AL | 4.0 | 1.0 | 1146 | $1,050 | $0.92 | 10d | 1 | 0.75mi |
| 1701 Avenue I Unit I Birmingham, AL | 3.0 | 1.0 | 1140 | $1,200 | $1.05 | 3d | 1 | 0.80mi |
| 1520 Avenue G Unit G Birmingham, AL | 4.0 | 1.0 | 1231 | $1,100 | $0.89 | 44d | 1 | 0.80mi |
| 820 17th Street Ensley Birmingham, AL | 3.0 | 2.0 | 1336 | $1,250 | $0.94 | 44d | 1 | 0.80mi |
| 1521 22nd Street Ensley Unit B Birmingham, AL | 2.0 | 1.0 | 750 | $875 | $1.17 | 24d | 1 | 0.83mi |
| 1301 32nd Street Ensley Birmingham, AL | 3.0 | 1.0 | 1200 | $975 | $0.81 | 44d | 1 | 0.89mi |
| 1501 29th Street Ensley Birmingham, AL | 2.0 | 1.0 | 772 | $800 | $1.04 | 24d | 1 | 0.89mi |
| 1521 27th Street Ensley Birmingham, AL | 3.0 | 2.0 | 1120 | $1,000 | $0.89 | 44d | 1 | 0.90mi |
| 538 Gulfport St Birmingham, AL | 3.0 | 1.0 | 1036 | $850 | $0.82 | 44d | 1 | 0.91mi |
| 2610 Avenue P Birmingham, AL | 3.0 | 2.0 | 1014 | $850 | $0.84 | 44d | 1 | 0.92mi |
| 1609 Pike Rd Birmingham, AL | 2.0 | 1.5 | 820 | $800 | $0.98 | 19d | 5 | 0.94mi |
| 708 40th St Fairfield, AL | 2.0 | 1.0 | 788 | $650 | $0.82 | 44d | 1 | 0.96mi |
| 1545 29th Street Ensley Birmingham, AL | 3.0 | 1.5 | 1331 | $1,200 | $0.90 | 44d | 1 | 0.99mi |
| 518 41st St Fairfield, AL | 3.0 | 2.0 | 1095 | $1,200 | $1.10 | 44d | 1 | 1.01mi |
| 1221 Frisco St Birmingham, AL | 2.0 | 1.0 | 934 | $950 | $1.02 | 44d | 1 | 1.01mi |
| 1616 28th Street Ensley Birmingham, AL | 3.0 | 1.0 | 1081 | $1,100 | $1.02 | 44d | 1 | 1.02mi |
| 1532 31st Street Ensley Birmingham, AL | 2.0 | 1.0 | 839 | $850 | $1.01 | 44d | 1 | 1.03mi |
| 1226 Frisco St Birmingham, AL | 4.0 | 2.0 | 1232 | $1,245 | $1.01 | 12d | 1 | 1.03mi |
| 1232 Frisco St Birmingham, AL | 4.0 | 2.0 | 1332 | $1,295 | $0.97 | 2d | 1 | 1.04mi |
| 1306 35th Street Ensley Birmingham, AL | 3.0 | 2.0 | 1100 | $1,173 | $1.07 | 3d | 1 | 1.06mi |
| 728 41st St Fairfield, AL | 3.0 | 1.0 | 1316 | $1,100 | $0.84 | 44d | 1 | 1.07mi |
| 1417 34th Street Ensley Birmingham, AL | 3.0 | 1.0 | 1103 | $1,025 | $0.93 | 44d | 1 | 1.09mi |
| 1520 33rd Street Ensley Birmingham, AL | 4.0 | 2.0 | 1215 | $1,275 | $1.05 | 12d | 1 | 1.10mi |
| 1524 33rd Street Ensley Birmingham, AL | 4.0 | 2.0 | 1222 | $1,095 | $0.90 | 21d | 1 | 1.11mi |
| 1312 Gulfport St Birmingham, AL | 3.0 | 1.5 | 1376 | $1,100 | $0.80 | 44d | 1 | 1.14mi |
| 931 41st Street Ensley Birmingham, AL | 2.0 | 1.5 | 1048 | $995 | $0.95 | 3d | 1 | 1.14mi |
| 1825 18th Street Ensley Unit ENSLEY Birmingham, AL | 3.0 | 1.0 | 1316 | $1,123 | $0.85 | 44d | 1 | 1.14mi |
| 1309 41st St Fairfield, AL | 3.0 | 1.0 | 1070 | $1,200 | $1.12 | 44d | 1 | 1.15mi |
| 1528 34th Street Ensley Birmingham, AL | 3.0 | 2.0 | 972 | $1,073 | $1.10 | 44d | 1 | 1.17mi |
Listing history 18 events
-
2026-06-18days on market $69,900 Active 40 DOM
-
2026-06-17days on market $69,900 Active 39 DOM
-
2026-06-16days on market $69,900 Active 38 DOM
-
2026-06-15days on market $69,900 Active 37 DOM
-
2026-06-13days on market $69,900 Active 35 DOM
-
2026-06-10days on market $69,900 Active 32 DOM
-
2026-06-09days on market $69,900 Active 31 DOM
-
2026-06-08days on market $69,900 Active 30 DOM
-
2026-06-07days on market $69,900 Active 29 DOM
-
2026-06-03days on market $69,900 Active 25 DOM
-
2026-06-02days on market $69,900 Active 24 DOM
-
2026-06-01days on market $69,900 Active 23 DOM
-
2026-05-31days on market $69,900 Active 22 DOM
-
2026-05-06$69,900 Active 119-char remark
-
2013-05-15soldstatus $11,000 232-char remark
Show marketing remark (232 chars)
INVESTOR'S TAKE A LOOK!! 3 BEDROOM, 1 BATH HOME WITH A NICE SIZE KITCHEN, DINING ROOM. THIS HOME JUST NEED A LITTLE TLC. This is a Fannie Mae HomePath property. Buy this home with as little as 3% down. Right of Redemption may apply.
-
2013-04-11$12,900 232-char remark
Show marketing remark (232 chars)
INVESTOR'S TAKE A LOOK!! 3 BEDROOM, 1 BATH HOME WITH A NICE SIZE KITCHEN, DINING ROOM. THIS HOME JUST NEED A LITTLE TLC. This is a Fannie Mae HomePath property. Buy this home with as little as 3% down. Right of Redemption may apply.
-
2007-05-14soldstatus $74,000
-
1987-10-01soldstatus $32,000
ⓘ Source: listings_history table (triggers on properties + properties_extension) + one-shot
backfill from property_details.listing_events for pre-trigger history.
Tax reassessment forecast AL · Resets to sale price
- Current annual tax
- $1,290 · $108/mo
- Projected year-2 tax
- $1,290 · $108/mo
- Expected delta
- $0/yr ($0/mo · 0.0%)
ⓘ Screening estimate from a state-policy table — verify with the county assessor before closing.
Climate risk First Street
- Flood 1/10 Low FEMA zone X (unshaded) · 0% chance over 30 yrs
- Wildfire 3/10 Moderate
- Heat 7/10 Severe 7 d/yr ≥107°F today · 20 d/yr by 30 yrs out
- Wind 6/10 Major 27% chance of damaging wind over 30 yrs
- Air quality 4/10 Moderate 5 unhealthy d/yr today · 5 by 30 yrs out
Nearby sold comps map
Loading sold comps map…
Walkable amenities ~0.75 mi
Loading nearby amenities…
Taxation est. · year 1
- Rental income
- $12,720
- − Mortgage interest
- −$3,915
- − Property taxes
- −$1,290
- − Insurance
- −$350
- − Repairs & maintenance
- −$1,018
- − Management
- −$1,018
- − Depreciation
- −$2,033
- Taxable income
- $3,096
- Est. tax owed @ 24.0%
- −$743
- After-tax cash flow
- $3,267/yr
For passive investors: Depreciation is non-cash, so a rental often shows a tax loss while cash-flowing — sheltering income. Rental losses are passive: they offset passive income freely, and up to $25,000/yr can offset ordinary (W-2) income if you actively participate and your MAGI is under $100k (phasing out to $0 by $150k); unused losses carry forward. On sale, claimed depreciation is recaptured at up to 25%, and gains may owe capital-gains tax (a 1031 exchange can defer both). Figures are a year-1 estimate at your 24.0% rate — not tax advice; consult a CPA.
Schools (NCES district)
- District
- Birmingham City
- NCES district ID
- 0100390
- Math proficiency
- 4% ▼ -17.00%
- Reading proficiency
- 20% ▼ -4.00%
- Median HH income
- $31,988
- Composite
- 9.49/100
- National rank
- #9850
- State rank
- #116 of 129 in AL
Livability — Birmingham
- Score
- 67/100
- State rank
- #78
- US rank
- #10412
Category grades
Schools grade is shown separately in the Schools card above.
Census & demographics
- Census place
- Birmingham, AL
- County
- Jefferson County · 527,445 people
- City population
- 210,422
- Metro
- Birmingham-Hoover, AL
- Population (ZIP)
- 6,981
- Household income
- $30,739
- Rent vs Own
- Severe rent burden
- 621.0
Population outlook (Jefferson County) Hauer SSP2
- Today (2025)
- 669,185 people
- By 2030
- 669,694 · +0.1%
- By 2040
- 661,388 · -1.2%
- By 2050
- 643,086 · -3.9%
- By 2075
- 577,267 · -13.7%
- By 2100
- 474,758 · -29.1%
Race, ethnicity, and origin ACS 2023
- Neighborhood character
- Predominantly Black (76%)
- Race & ethnicity
- Black 76% Two or more races 17% White 5% Hispanic / Latino 4%
- Foreign-born
- 2% · Canada, South Korea
- Languages at home
- 97% English-only · Spanish 1%
Political lean MEDSL · Jefferson
- 2024 margin
- D (+10.4) · D 54.6% · R 44.2% · Other 1.2%
- 2008→2024 swing
- +5.4pp toward D · 2008: 5.1pp · 2024: 10.4pp
- All cycles
- 2024: D+10.4 2020: D+13.2 2016: D+7.2 2012: D+6.0 2008: D+5.1
Not yet ingested
- Civics
- —
Market trends
- HPI YoY
- ▼ -1.54%
- Current HPI
- 170.4053
- Rent YoY
- —
- Metro
- Birmingham-Hoover, AL
- State GDP YoY
- ▲ 2.94%
- F500 in state
- 4
Industry mix (Fortune 500 HQ in AL)
| Industry | F500 HQs | Revenue |
|---|---|---|
| Financial Services | 1 | $8B |
|
||
| Healthcare | 1 | $5B |
|
||
Price history
+118.4% since first listed5 events — show timeline
- 2026-05-06 Listed $69,900 Greater Alabama MLS
- 2013-05-15 Sold (MLS) $11,000 Greater Alabama MLS
- 2013-04-11 Listed $12,900 Greater Alabama MLS
- 2007-05-14 Sold (Public Records) $74,000 Public Records
- 1987-10-01 Sold (Public Records) $32,000 Public Records
Property tax history
+3.7%/yrLatest (2025): $1,290 · +0.0% YoY. Source: county tax records.
Cash-flow waterfall
monthlySold comps — $/sqft
last 12 mo · ≤1 miLoading sold comps…