 Multi-family
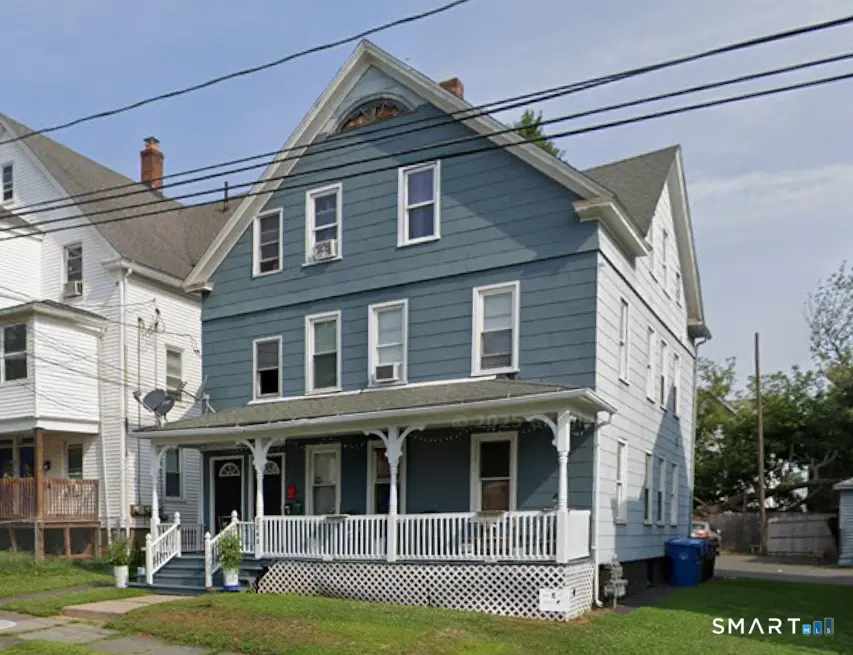
540 Church St · New Britain, CT
Flood risk No data
- FEMA flood zone
- —
- Chance of flooding over 30 yrs
- —
- Est. flood insurance / yr
- —
Fire risk No data
- Est. fire insurance / yr
- —
Heat risk No data
- Hot days now (above threshold)
- —
- Hot days in 30 yrs
- —
Wind risk No data
- Chance of severe wind over 30 yrs
- —
Air-quality risk No data
- Unhealthy air days now
- —
- Unhealthy air days in 30 yrs
- —
Risk factors via First Street. Map © Google.
Why this score? — see what drove the C+ grade
The composite is a weighted blend of 9 inputs, each scored 0–100. Each bar is that input's sub-score; the figure is the points it added to the 100-point composite (weight × sub-score).
- Cash flow +22.7/30.0
- Appreciation +10.0/10.0
- DSCR +7.3/10.0
- 1% rule +5.9/10.0
- ARV discount +5.5/15.0
- Livability +3.7/5.0
- Condition / age +2.5/5.0
- Rent growth +2.4/5.0
- Schools +1.0/10.0
$460,000
🖨 Deal sheet 📄 Offer letter ✓ Due diligence
Multi-family units
County records classify this as Multi-Family (2-4 Unit). Listing-text estimate: 1 unit. estimate disagrees with records
Listing remarks MLS
Great 3 family home with three 2 BR units. Newer driveway and windows. Separate utilities with owner panel. Laundry hook up in each unit. Fully leased. Great investment or owner occupy. Convenient location.
Key facts
- Local services
- Convenient location
- Major roads
Tags
Property features AI
Finance
- Other: Living area recorded as 3078
- Financial info: Assessed value listed
Exterior
- Utilities: Public water connected; Public sewer connected; Natural gas available
- Home design: Multi-family property (3-family)
- Construction: Frame construction; Concrete foundation; Asphalt shingle roof; Asbestos exterior siding
- Exterior features: Level lot
Interior
- Bedrooms: 6 total bedrooms
- Bathrooms: 3 full bathrooms
- Heating & cooling: Baseboard heating; Hot air heating; Natural gas fuel for heating; Hot water described as other
- Interior features: 12 total rooms; Full, unfinished basement with hatchway; Property is a multi-family building with 3 units
Neighborhood map
What this means for you Summary
Snapshot
- This is a 6-bed/3.0-bath multifamily listed at $460k.
Deal economics
- At list price, monthly cash flow is $787 ($9k/yr) — positive.
- The deal already cash-flows at list — no discount required.
- Meets the 1% rule at list price ($5k rent vs $460k).
- Cap rate 8.3% vs local median 4.4% in New Britain — top-decile yield for the area; either an underpriced asset or a hidden risk that comps aren't pricing in. Stress-test before assuming the spread holds.
Location & tenants
- Location reads 74/100 on livability (#67 in CT, #4,936 nationally) — a middle-class / working-renter tenant base. Strengths: health & safety A+, cost of living A, housing A; Watch: crime D, employment D.
- New Britain School District (suburban): math 6% / reading 17% proficiency, ranked #153 of 153 in CT (top 100%) — low school quality limits family demand, transient renter base, plan for 1-2y turnover; 71% free/reduced lunch — lower-income household profile, screen leases tightly.
- Zoned schools: New Britain High School (math 10% / reading 31%, grade F, #162 of 194 statewide, top 83%, 2,331 students, 71% FRL) — zoned schools at 71% FRL track the district average.
- Market conditions: Rents soft (-0.6%/yr); 63 active listings in the ZIP; 1 comparable units currently listed for rent nearby; 1,867 units permitted in Capitol Planning Region in 2024 (1,399 in 5+ unit buildings).
- At $5,031/mo this rent would consume 118% of the median local household income ($51k/yr) (locally 2100% of renters already pay >50% of income on rent) — very limited rent-growth headroom before tenants either downsize or default.
Forward outlook
- In year one you build about $49k of equity ($3k loan paydown + $46k appreciation (10.0% local appreciation)).
- At projected returns (10.0% appreciation + 0.0% rent growth), your $129k cash investment doubles in ~3 years — after that, you're playing with house money.
- By year 2, paydown + projected appreciation supports a ~$79k cash-out refi (75% LTV) — recoverable capital for the next deal without selling this one.
Negotiation context
- Only 3 days on market — expect competitive offers; lowballing is unlikely to land.
- 3 sale attempts since 17y ago with the ask held roughly flat each time — persistent listings suggest the price (not the market) is what's stuck; bring a comps-based counter.
Risks & watch-outs
- Watch-outs: built in 1904 — expect roof / HVAC / electrical / plumbing capex.
Questions for the listing agent
- Built in 1904 — when were the roof, HVAC, electrical panel, plumbing, and water heater last replaced?
- Is there a deadline driving the sale (1031 exchange, divorce, estate, relocation)? That informs how much negotiation room exists.
- Schools are F-rated, which usually means shorter tenancies and higher turnover. Who's the typical renter profile here, and what's been the actual vacancy rate?
- Crime grade is D in this area — have there been break-ins, vandalism, or insurance claims at this property in the last 3 years? What carrier currently insures it and at what premium?
- What's the average days-on-market for RENTAL listings here right now (not sales)? A rising rental-DOM trend means longer vacancies and softer asking-rent achievability than the comps imply.
- What's the recent tenant-quality profile in this submarket — average credit score on applications, eviction rate, late-payment / NSF rate, and stable-employment percentage? A property-management company in the area should have these aggregated.
- How much new apartment / multifamily construction is in the pipeline within 1–3 miles? Heavy new supply (>2% of stock underway) typically softens rents 12–24 months out; light construction supports rent growth.
Investment metrics
- 1% rule
- 1.09% ✓
- Cap rate
- 8.35%
- Cash-on-cash
- 7.33%
- DSCR
- 1.33
- GRM
- 7.6
CMA / ARV
- ARV (median comp)
- $440,541
- List price
- $460,000
- Delta
- 4.42%
- Verdict
- FAIR
- Comps
- 20 within 1.0 mi
Show comp detail 12 sales within ~0.75 mi
| Address | Dist | Beds/Ba | Sqft | Sold | Price | $/sf | Match |
|---|---|---|---|---|---|---|---|
| 540 Church St | 0.00mi | 6/3.0 | 3,078 (0%) | 1mo | $480,000 | $156 | 99 |
| 484 Church St | 0.09mi | 5/3.0 (-1) | 2,620 (-15%) | 0mo | $430,000 | $164 | 65 |
| 112 Austin St | 0.39mi | 6/3.0 | 2,766 (-10%) | 1mo | $485,000 | $175 | 64 |
| 712 Stanley St | 0.29mi | 6/2.0 | 3,268 (+6%) | 10mo | $355,000 | $109 | 64 |
| 29 Olive St | 0.32mi | 6/3.0 | 2,668 (-13%) | 5mo | $400,000 | $150 | 59 |
| 228 Whiting St | 0.45mi | 6/3.0 | 3,312 (+8%) | 11mo | $430,000 | $130 | 57 |
| 36 Carlson St | 0.36mi | 6/3.0 | 3,420 (+11%) | 10mo | $435,000 | $127 | 56 |
| 182 West St | 0.72mi | 6/3.0 | 2,910 (-6%) | 7mo | $485,000 | $167 | 52 |
| 38 Fairview St | 0.36mi | 6/2.0 | 2,724 (-12%) | 12mo | $450,000 | $165 | 50 |
| 21 Tremont St | 0.72mi | 7/3.0 (+1) | 3,277 (+6%) | 8mo | $511,000 | $156 | 44 |
| 411 Ellis St | 0.68mi | 5/3.0 (-1) | 2,688 (-13%) | 2mo | $450,000 | $167 | 40 |
| 341 Stanley St | 0.71mi | 6/3.0 | 3,460 (+12%) | 12mo | $440,000 | $127 | 36 |
Match score weights: distance 35% · size 25% · config 20% · recency 20%. Top-matched comps best support the ARV.
Projected returns pro-forma
10.0% appreciation · 0.0% rent growth · sell at horizon
- IRR
- 28.4%
- Equity multiple
- 3.22×
- Total profit
- $286,008
- Equity at exit
- $414,404
- IRR
- 23.9%
- Equity multiple
- 7.03×
- Total profit
- $776,575
- Equity at exit
- $893,679
Cash invested: $128,800 (down + closing). Projections, not guarantees.
Landlord ↔ Tenant lean methodology
- Overall (STATE)
- 27 Tenant-Leaning
- State Connecticut
- 27 Tenant-Leaning · D+7
- County
- — inherits STATE
- City
- — inherits STATE
ZIP-level market 06051
- Home prices YoY
- 9.0%
- Rents YoY
- -0.6%
- Active inventory
- 63
- Price-to-rent
- 22.9×
Monthly cashflow live
- Estimated rent
- $5,031 high interval (Pro) →
- Mortgage (P&I)
- −$2,412
- Tax from tax record
- −$583 /mo · $6,999/yr
- Insurance
- −$192
- HOA
- −$0
- Vacancy / Maint / Mgmt
- −$1,057
- Net cashflow
- $787
Break-even live
3-unit breakdown (identical units grouped — click to expand)
| Units | Beds | Baths | Est. rent |
|---|---|---|---|
| 3× units | 2 | 1 | $5,031 |
| #1 | 2 | 1 | $1,677 |
| #2 | 2 | 1 | $1,677 |
| #3 | 2 | 1 | $1,677 |
| Total (3 units) | $5,031 | ||
UW: 25.0% down · 7.5% · 30yr · 1.5% tax · 5.0% vac · 8.0% maint · 8.0% mgmt
Financing live
Cash to close
- Down payment
- $115,000
- Closing costs
- $13,800
- Reserves months
- —
- Total cash needed
- —
Loan-product check · same deal, 3 products live
Conventional
25% down · 7.5% · 30yr
- Down + closing
- —
- Monthly P&I
- —
- Monthly cashflow
- —
- DSCR
- —
- Eligible?
- —
Personal DTI + credit; lowest rate.
DSCR
20% down · 8.5% · 30yr
- Down + closing
- —
- Monthly P&I
- —
- Monthly cashflow
- —
- DSCR
- —
- Eligible?
- —
No personal income docs; deal must DSCR.
Hard money
10% down · 12.0% · 12mo
- Down + closing
- —
- Monthly P&I
- —
- Monthly cashflow
- —
- DSCR
- —
- Eligible?
- —
Short-term bridge; refi at stabilization.
Rent comps 1 comps
| Address | Beds | Baths | Sqft | Rent | $/sqft | DOM | Units | Dist |
|---|---|---|---|---|---|---|---|---|
| 151 Fairview St New Britain, CT | 6.0 | 3.0 | 4098 | $1,800 | $0.44 | 3d | 1 | 0.17mi |
Listing history 10 events
-
2026-05-02status Under Contract 622-char remark
-
2026-04-29$460,000 Active 622-char remark
-
2017-10-19soldstatus $163,600
-
2017-10-17soldstatus $163,600 206-char remark
Show marketing remark (206 chars)
Great 3 family home with three 2 BR units. Newer driveway and windows. Separate utilities with owner panel. Laundry hook up in each unit. Fully leased. Great investment or owner occupy. Convenient location.
-
2017-09-24historical 206-char remark
Show marketing remark (206 chars)
Great 3 family home with three 2 BR units. Newer driveway and windows. Separate utilities with owner panel. Laundry hook up in each unit. Fully leased. Great investment or owner occupy. Convenient location.
-
2017-01-06$155,000 206-char remark
Show marketing remark (206 chars)
Great 3 family home with three 2 BR units. Newer driveway and windows. Separate utilities with owner panel. Laundry hook up in each unit. Fully leased. Great investment or owner occupy. Convenient location.
-
2010-06-23soldstatus $180,000
-
2009-10-26soldstatus $65,000
Show marketing remark (131 chars)
Large house with great potential for the right investor to finish work started house is large floor 1 and 2 are larger than floor 3
-
2009-08-11$74,900
Show marketing remark (131 chars)
Large house with great potential for the right investor to finish work started house is large floor 1 and 2 are larger than floor 3
-
2003-12-05soldstatus $146,960
ⓘ Source: listings_history table (triggers on properties + properties_extension) + one-shot
backfill from property_details.listing_events for pre-trigger history.
Tax reassessment forecast CT · Partial reset (capped growth)
- Current annual tax
- $6,999 · $583/mo
- Projected year-2 tax
- $8,422 · $702/mo
- Expected delta
- +$1,422/yr (+$119/mo · 20.3%)
ⓘ Screening estimate from a state-policy table — verify with the county assessor before closing.
Nearby sold comps map
Loading sold comps map…
Walkable amenities ~0.75 mi
Loading nearby amenities…
Taxation est. · year 1
- Rental income
- $60,372
- − Mortgage interest
- −$25,767
- − Property taxes
- −$6,999
- − Insurance
- −$2,300
- − Repairs & maintenance
- −$4,830
- − Management
- −$4,830
- − Depreciation
- −$13,382
- Taxable income
- $2,265
- Est. tax owed @ 24.0%
- −$543
- After-tax cash flow
- $8,904/yr
For passive investors: Depreciation is non-cash, so a rental often shows a tax loss while cash-flowing — sheltering income. Rental losses are passive: they offset passive income freely, and up to $25,000/yr can offset ordinary (W-2) income if you actively participate and your MAGI is under $100k (phasing out to $0 by $150k); unused losses carry forward. On sale, claimed depreciation is recaptured at up to 25%, and gains may owe capital-gains tax (a 1031 exchange can defer both). Figures are a year-1 estimate at your 24.0% rate — not tax advice; consult a CPA.
Schools (NCES district)
- District
- New Britain School District
- NCES district ID
- 0902670
- Math proficiency
- 6% ▼ -6.00%
- Reading proficiency
- 17% ▼ -5.00%
- Median HH income
- $40,827
- Composite
- 9.95/100
- National rank
- #9816
- State rank
- #153 of 153 in CT
Livability — New Britain
- Score
- 74/100
- State rank
- #67
- US rank
- #4936
Category grades
Schools grade is shown separately in the Schools card above.
Census & demographics
- Census place
- New Britain, CT
- County
- Hartford County · 754,208 people
- City population
- 66,322
- Metro
- Hartford-East Hartford-Middletown, CT
- Population (ZIP)
- 29,548
- Household income
- $51,022
- Rent vs Own
- Severe rent burden
- 2100.0
Population outlook (Capitol County) Hauer SSP2
- By 2040
- 1,063,519
Race, ethnicity, and origin ACS 2023
- Neighborhood character
- Diverse neighborhood (Simpson 0.63)
- Race & ethnicity
- Hispanic / Latino 52% White 30% Two or more races 17% Black 11% Asian 2%
- Hispanic origin (detail)
- Mexican 2% Puerto Rican 40% Dominican 4%
- Common ancestry
- Romanian 7% Lithuanian 6% Slovak 1%
- Foreign-born
- 15% · Canada, Jamaica
- Languages at home
- 51% English-only · Spanish 39% Russian/Polish/Slavic 6% Arabic 3%
Political lean MEDSL · Capitol
- 2024 margin
- Strong D (+21.9) · D 60.1% · R 38.2% · Other 1.7%
- All cycles
- 2024: D+21.9
Not yet ingested
- Civics
- —
Market trends
- HPI YoY
- ▲ 31.52%
- Current HPI
- 382.7816
- Rent YoY
- ▼ -0.58%
- Metro
- Hartford-East Hartford-Middletown, CT
- State GDP YoY
- ▲ 1.06%
- F500 in state
- 38
Industry mix (Fortune 500 HQ in CT)
| Industry | F500 HQs | Revenue |
|---|---|---|
| Industrial Machinery | 4 | $38B |
|
||
| Insurance | 3 | $71B |
|
||
| Financial Services | 2 | $25B |
|
||
| Transportation / Logistics | 2 | $18B |
|
||
| Healthcare | 1 | $247B |
|
||
| Telecommunications | 1 | $55B |
|
||
Price history
+226.6% since first listed11 events — show timeline
- 2026-05-18 Sold (MLS) $480,000 Smart MLS
- 2026-05-02 Pending — Smart MLS
- 2026-04-29 Listed $460,000 Smart MLS
- 2017-10-19 Sold (Public Records) $163,600 Public Records
- 2017-10-17 Sold (MLS) $163,600 Smart MLS
- 2017-09-24 Listing Removed — Smart MLS
- 2017-01-06 Listed $155,000 Smart MLS
- 2010-06-23 Sold (Public Records) $180,000 Public Records
- 2009-10-26 Sold (MLS) $65,000 Smart MLS
- 2009-08-11 Listed $74,900 Smart MLS
- 2003-12-05 Sold (Public Records) $146,960 Public Records
Property tax history
+4.0%/yrLatest (2025): $6,999 · +2.4% YoY. Source: county tax records.
Cash-flow waterfall
monthlySold comps — $/sqft
last 12 mo · ≤1 miLoading sold comps…