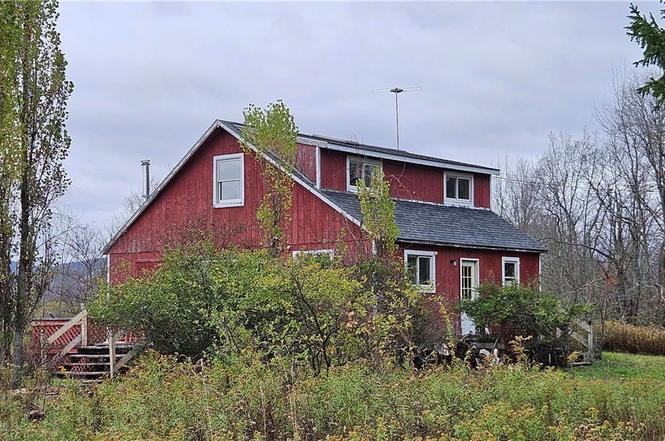
18 Casale Ln · Margaretville, NY
Flood risk 1/10 · Minimal
- FEMA flood zone
- X (unshaded)
- Chance of flooding over 30 yrs
- 0.0%
- Est. flood insurance / yr
- $507 – $1,088
Fire risk 2/10 · Minimal
- Est. fire insurance / yr
- $691 – $1,283
Heat risk 1/10 · Minimal
- Hot days now (above 89°F)
- 7 days/yr
- Hot days in 30 yrs
- 15 days/yr
Wind risk 2/10 · Minimal
- Chance of severe wind over 30 yrs
- 2.0%
Air-quality risk 1/10 · Minimal
- Unhealthy air days now
- 0 days/yr
- Unhealthy air days in 30 yrs
- 0 days/yr
Risk factors via First Street. Map © Google.
Why this score? — see what drove the B+ grade
The composite is a weighted blend of 9 inputs, each scored 0–100. Each bar is that input's sub-score; the figure is the points it added to the 100-point composite (weight × sub-score).
- Cash flow +30.0/30.0
- 1% rule +10.0/10.0
- DSCR +10.0/10.0
- ARV discount +7.5/15.0
- Appreciation +7.2/10.0
- Schools +3.5/10.0
- Livability +3.2/5.0
- Rent growth +2.5/5.0
- Condition / age +2.5/5.0
$139,000
🖨 Deal sheet 📄 Offer letter ✓ Due diligence
Listing remarks MLS
Private home with beautiful views. This large home offers two large bedrooms on the main floor and two more bedrooms plus a half bath on the second floor. Eat in kitchen, woodstove, great room, and a level 4+ acres.
Key facts
- 4.36 acre lot
- Built 1981
Neighborhood map
What this means for you Summary
Snapshot
- This is a 3-bed/2.0-bath single-family listed at $139k.
Deal economics
- At list price, monthly cash flow is $1k ($17k/yr) — positive.
- The deal already cash-flows at list — no discount required.
- Meets the 1% rule at list price ($3k rent vs $139k).
- Cap rate 18.3% vs local median 4.2% in Margaretville — top-decile yield for the area; either an underpriced asset or a hidden risk that comps aren't pricing in. Stress-test before assuming the spread holds.
Location & tenants
- Location reads 65/100 on livability (#711 in NY) — a middle-class / working-renter tenant base. Strengths: health & safety A, cost of living A-; Watch: employment D, schools F, crime F.
- Roxbury Central School District (rural): math 40% / reading 35% proficiency, ranked #668 of 755 in NY (top 88%) — families likely to look elsewhere, expect single-tenant / working-renter base with shorter leases.
- Market conditions: 47 active listings in the ZIP; 66 units permitted in Delaware County in 2024 (0 in 5+ unit buildings).
Forward outlook
- In year one you build about $7k of equity ($961 loan paydown + $6k appreciation (4.4% local appreciation)).
- Delaware County population projected at -27% by 2050 — secular population decline; favor cash flow + early exit over multi-decade hold.
- At projected returns (4.4% appreciation + 3.0% rent growth), your $39k cash investment doubles in ~2 years — after that, you're playing with house money.
- By year 5, paydown + projected appreciation supports a ~$30k cash-out refi (75% LTV) — recoverable capital for the next deal without selling this one.
Negotiation context
- Only 1 days on market — expect competitive offers; lowballing is unlikely to land.
- 3 sale attempts since 14y ago with the ask held roughly flat each time — persistent listings suggest the price (not the market) is what's stuck; bring a comps-based counter.
Questions for the listing agent
- Is there a deadline driving the sale (1031 exchange, divorce, estate, relocation)? That informs how much negotiation room exists.
- Schools are F-rated, which usually means shorter tenancies and higher turnover. Who's the typical renter profile here, and what's been the actual vacancy rate?
- Crime grade is F in this area — have there been break-ins, vandalism, or insurance claims at this property in the last 3 years? What carrier currently insures it and at what premium?
- What's the average days-on-market for RENTAL listings here right now (not sales)? A rising rental-DOM trend means longer vacancies and softer asking-rent achievability than the comps imply.
- What's the recent tenant-quality profile in this submarket — average credit score on applications, eviction rate, late-payment / NSF rate, and stable-employment percentage? A property-management company in the area should have these aggregated.
- How much new for-sale + rental construction is in the pipeline within 1–3 miles? Heavy new supply typically softens prices + rents 12–24 months out; constrained supply supports both.
Investment metrics
- 1% rule
- 2.21% ✓
- Cap rate
- 18.31%
- Cash-on-cash
- 42.92%
- DSCR
- 2.91
- GRM
- 3.8
CMA / ARV
- ARV (on-the-fly)
- $495,430
- Comps found
- 2
Show comp detail 2 sales within ~0.75 mi
| Address | Dist | Beds/Ba | Sqft | Sold | Price | $/sf | Match |
|---|---|---|---|---|---|---|---|
| 151 Taco Ln | 0.09mi | 4/1.5 (+1) | 1,304 (-3%) | 5mo | $275,000 | $211 | 80 |
| 440 Fox Meadow Ln | 0.39mi | 3/3.0 | 1,350 (+1%) | 15mo | $500,000 | $370 | 64 |
Match score weights: distance 35% · size 25% · config 20% · recency 20%. Top-matched comps best support the ARV.
Projected returns pro-forma
4.36% appreciation · 3.0% rent growth · sell at horizon
- IRR
- 50.2%
- Equity multiple
- 3.97×
- Total profit
- $115,780
- Equity at exit
- $73,447
- IRR
- 48.6%
- Equity multiple
- 8.09×
- Total profit
- $276,110
- Equity at exit
- $122,564
Cash invested: $38,920 (down + closing). Projections, not guarantees.
Landlord ↔ Tenant lean methodology
- Overall (STATE)
- 15 Strongly Tenant-Friendly
- State New York
- 15 Strongly Tenant-Friendly · D+10
- County
- — inherits STATE
- City
- — inherits STATE
ZIP-level market 12455
- Home prices YoY
- 1.2%
- Active inventory
- 47
- Price-to-rent
- 3.8×
Monthly cashflow live
- Estimated rent
- $3,075 medium interval (Pro) →
- Mortgage (P&I)
- −$729
- Tax from tax record
- −$250 /mo · $3,002/yr
- Insurance
- −$58
- HOA
- −$0
- Vacancy / Maint / Mgmt
- −$646
- Net cashflow
- $1,392
Break-even live
UW: 25.0% down · 7.5% · 30yr · 1.5% tax · 5.0% vac · 8.0% maint · 8.0% mgmt
Financing live
Cash to close
- Down payment
- $34,750
- Closing costs
- $4,170
- Reserves months
- —
- Total cash needed
- —
Loan-product check · same deal, 3 products live
Conventional
25% down · 7.5% · 30yr
- Down + closing
- —
- Monthly P&I
- —
- Monthly cashflow
- —
- DSCR
- —
- Eligible?
- —
Personal DTI + credit; lowest rate.
DSCR
20% down · 8.5% · 30yr
- Down + closing
- —
- Monthly P&I
- —
- Monthly cashflow
- —
- DSCR
- —
- Eligible?
- —
No personal income docs; deal must DSCR.
Hard money
10% down · 12.0% · 12mo
- Down + closing
- —
- Monthly P&I
- —
- Monthly cashflow
- —
- DSCR
- —
- Eligible?
- —
Short-term bridge; refi at stabilization.
Listing history 7 events
-
2026-03-16soldstatus $125,000
-
2025-10-14status Pending
-
2025-10-13$139,000 Active
-
2015-10-08soldstatus $110,000
-
2015-10-05soldstatus $110,000 215-char remark
Show marketing remark (215 chars)
Private home with beautiful views. This large home offers two large bedrooms on the main floor and two more bedrooms plus a half bath on the second floor. Eat in kitchen, woodstove, great room, and a level 4+ acres.
-
2014-04-07$119,000 215-char remark
Show marketing remark (215 chars)
Private home with beautiful views. This large home offers two large bedrooms on the main floor and two more bedrooms plus a half bath on the second floor. Eat in kitchen, woodstove, great room, and a level 4+ acres.
-
2012-08-02$159,000
ⓘ Source: listings_history table (triggers on properties + properties_extension) + one-shot
backfill from property_details.listing_events for pre-trigger history.
Tax reassessment forecast NY · Partial reset (capped growth)
- Current annual tax
- $3,002 · $250/mo
- Projected year-2 tax
- $3,002 · $250/mo
- Expected delta
- $0/yr ($0/mo · 0.0%)
ⓘ Screening estimate from a state-policy table — verify with the county assessor before closing.
Climate risk First Street
- Flood 1/10 Low FEMA zone X (unshaded) · 0% chance over 30 yrs
- Wildfire 2/10 Low
- Heat 1/10 Low 7 d/yr ≥89°F today · 15 d/yr by 30 yrs out
- Wind 2/10 Low 2% chance of damaging wind over 30 yrs
- Air quality 1/10 Low 0 unhealthy d/yr today · 0 by 30 yrs out
Nearby sold comps map
Loading sold comps map…
Walkable amenities ~0.75 mi
Loading nearby amenities…
Taxation est. · year 1
- Rental income
- $36,896
- − Mortgage interest
- −$7,786
- − Property taxes
- −$3,002
- − Insurance
- −$695
- − Repairs & maintenance
- −$2,952
- − Management
- −$2,952
- − Depreciation
- −$4,044
- Taxable income
- $15,465
- Est. tax owed @ 24.0%
- −$3,712
- After-tax cash flow
- $12,991/yr
For passive investors: Depreciation is non-cash, so a rental often shows a tax loss while cash-flowing — sheltering income. Rental losses are passive: they offset passive income freely, and up to $25,000/yr can offset ordinary (W-2) income if you actively participate and your MAGI is under $100k (phasing out to $0 by $150k); unused losses carry forward. On sale, claimed depreciation is recaptured at up to 25%, and gains may owe capital-gains tax (a 1031 exchange can defer both). Figures are a year-1 estimate at your 24.0% rate — not tax advice; consult a CPA.
Schools (NCES district)
- District
- Roxbury Central School District
- NCES district ID
- 3625110
- Math proficiency
- 40% ▼ -10.00%
- Reading proficiency
- 35% ▼ -10.00%
- Median HH income
- $47,744
- Composite
- 34.74/100
- National rank
- #10038
- State rank
- #668 of 755 in NY
Livability — Margaretville
- Score
- 65/100
- State rank
- #711
- US rank
- #13534
Category grades
Schools grade is shown separately in the Schools card above.
Census & demographics
- Population (ZIP)
- 1,859
Population outlook (Delaware County) Hauer SSP2
- Today (2025)
- 42,668 people
- By 2030
- 40,337 · -5.5%
- By 2040
- 35,514 · -16.8%
- By 2050
- 31,265 · -26.7%
- By 2075
- 24,455 · -42.7%
- By 2100
- 19,529 · -54.2%
Race, ethnicity, and origin ACS 2023
- Neighborhood character
- Predominantly White (74%)
- Race & ethnicity
- White 74% Hispanic / Latino 21% Two or more races 11%
- Hispanic origin (detail)
- Puerto Rican 1% Dominican 2%
- Common ancestry
- Romanian 5% Iranian 3% Slovak 3%
- Foreign-born
- 21% · Canada, South Korea
- Languages at home
- 77% English-only · Spanish 12% Russian/Polish/Slavic 2% Other Indo-European 2%
Political lean MEDSL · Delaware
- 2024 margin
- R (+19.8) · D 40.1% · R 59.9%
- 2008→2024 swing
- -14.6pp toward R · 2008: -5.2pp · 2024: -19.8pp
- All cycles
- 2024: R+19.8 2020: R+18.4 2016: R+29.2 2012: R+9.6 2008: R+5.2
Not yet ingested
- Civics
- —
Market trends
- HPI YoY
- ▲ 4.36%
- Current HPI
- 355.7672
- Rent YoY
- —
- Metro
- —
- State GDP YoY
- ▲ 2.60%
- F500 in state
- 92
Industry mix (Fortune 500 HQ in NY)
| Industry | F500 HQs | Revenue |
|---|---|---|
| Financial Services | 10 | $950B |
|
||
| Consumer Goods | 9 | $162B |
|
||
| Insurance | 4 | $225B |
|
||
| Telecommunications | 2 | $144B |
|
||
| Pharmaceuticals | 2 | $112B |
|
||
| Media / Entertainment | 2 | $69B |
|
||
Price history
-21.4% since first listed7 events — show timeline
- 2026-03-16 Sold (Public Records) $125,000 Public Records
- 2025-10-14 Pending — UNYREIS
- 2025-10-13 Listed $139,000 UNYREIS
- 2015-10-08 Sold (Public Records) $110,000 Public Records
- 2015-10-05 Sold (MLS) $110,000 UNYREIS
- 2014-04-07 Listed $119,000 UNYREIS
- 2012-08-02 Listed $159,000 UNYREIS
Property tax history
+1.2%/yrLatest (2025): $3,002 · +1.0% YoY. Source: county tax records.
Cash-flow waterfall
monthlySold comps — $/sqft
last 12 mo · ≤1 miLoading sold comps…