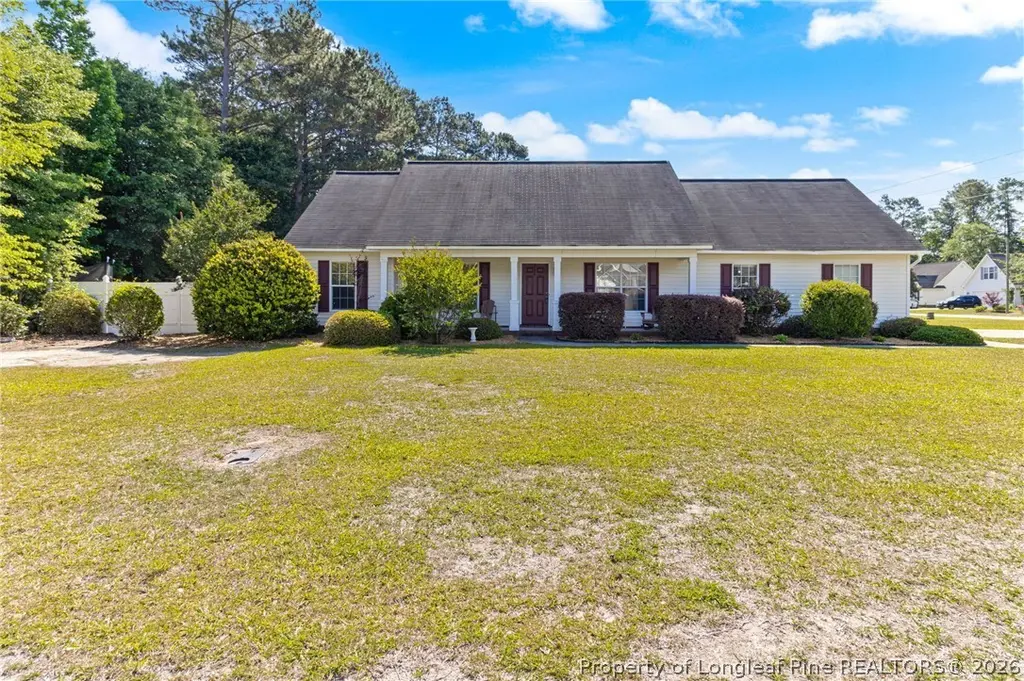
629 Tulip Ct · Stedman, NC
Flood risk 5/10 · Moderate
- FEMA flood zone
- X (unshaded)
- Chance of flooding over 30 yrs
- 0.52%
- Est. flood insurance / yr
- $507 – $1,088
Fire risk 5/10 · Moderate
- Est. fire insurance / yr
- $906 – $1,684
Heat risk 7/10 · Major
- Hot days now (above 106°F)
- 7 days/yr
- Hot days in 30 yrs
- 16 days/yr
Wind risk 8/10 · Major
- Chance of severe wind over 30 yrs
- 80.0%
Air-quality risk 1/10 · Minimal
- Unhealthy air days now
- 0 days/yr
- Unhealthy air days in 30 yrs
- 0 days/yr
Risk factors via First Street. Map © Google.
Why this score? — see what drove the D+ grade
The composite is a weighted blend of 9 inputs, each scored 0–100. Each bar is that input's sub-score; the figure is the points it added to the 100-point composite (weight × sub-score).
- Cash flow +12.4/30.0
- Appreciation +10.0/10.0
- ARV discount +6.0/15.0
- DSCR +3.7/10.0
- Livability +3.6/5.0
- Schools +3.1/10.0
- 1% rule +2.9/10.0
- Rent growth +2.5/5.0
- Condition / age +2.5/5.0
$265,000
🖨 Deal sheet 📄 Offer letter ✓ Due diligence
Listing remarks MLS
Located in the beautiful Stedman area. Corner lot, new carpet lots of space a must see. Awesome back yard with pool and plenty of space for entertaining.
Key facts
- Bonus room
- Granite countertops
- Corner lot
Tags
Property features AI
Finance
- Other: Zoned R10 - Residential District; Located in the STEDMAN subdivision
Exterior
- Parking: Attached carport; 2 covered parking spaces (2-car garage present)
- Utilities: Public water; Public sewer
- Home design: Single-family residence; One and one-half stories; Vinyl siding construction
- Construction: Vinyl siding exterior; One and one-half level design
- Exterior features: Fenced yard with privacy fencing; In-ground pool; Level topography; Corner lot
Interior
- Kitchen: Refrigerator
- Bedrooms: 7 total rooms (includes bedrooms and living spaces)
- Flooring: Carpet; Hardwood; Tile
- Bathrooms: 2 full bathrooms
- Heating & cooling: Heat pump heating; Central air conditioning
- Interior features: Eat-in kitchen; Fireplace with propane fuel
Neighborhood map
What this means for you Summary
Snapshot
- This is a 3-bed/3.0-bath single-family listed at $265k.
Deal economics
- At list price, monthly cash flow is $-41 ($-495/yr) — negative.
- To cash-flow at today's rent, offer at most $258k (2.7% below list).
- To meet the 1% rule (rent ≥ 1% of price), the offer needs to be $210k (20.8% below list).
- Recommended offer: $210k (20.8% below list) — sets the bar for 1% rule.
- Cap rate 6.1% vs local median 4.3% in Stedman — top-decile yield for the area; either an underpriced asset or a hidden risk that comps aren't pricing in. Stress-test before assuming the spread holds.
Location & tenants
- Location reads 71/100 on livability (#107 in NC) — a middle-class / working-renter tenant base. Strengths: crime A+, employment A+, cost of living A+; Watch: amenities F, commute F, health & safety F.
- Cumberland County Schools (urban): math 32% / reading 41% proficiency, ranked #126 of 178 in NC (top 71%) — families likely to look elsewhere, expect single-tenant / working-renter base with shorter leases.
- Zoned schools: Stedman Elementary (math 57% / reading 52%, grade C, #302 of 1,410 statewide, top 23%, 271 students, 99% FRL); Mac Williams Middle (math 40% / reading 50%, grade D, #160 of 475 statewide, top 35%, 1,151 students, 58% FRL); Cape Fear High (math 75% / reading 47%, grade C+, #202 of 535 statewide, top 39%, 1,529 students, 50% FRL).
- Zoned-school proficiency averages 54% at this address vs 36% district-wide (+17 pts) — the actual schools serving this property are materially stronger than the Cumberland County Schools average implies; a family-tenant draw the district grade alone would hide.
- Market conditions: 33 active listings in the ZIP; 1 comparable units currently listed for rent nearby; 1,125 units permitted in Cumberland County in 2024 (104 in 5+ unit buildings).
Forward outlook
- In year one you build about $28k of equity ($2k loan paydown + $26k appreciation (10.0% local appreciation)).
- At projected returns (10.0% appreciation + 3.0% rent growth), your $74k cash investment doubles in ~3 years — after that, you're playing with house money.
- By year 2, paydown + projected appreciation supports a ~$46k cash-out refi (75% LTV) — recoverable capital for the next deal without selling this one.
Negotiation context
- Only 6 days on market — expect competitive offers; lowballing is unlikely to land.
- 3 sale attempts since 4y ago with the ask held roughly flat each time — persistent listings suggest the price (not the market) is what's stuck; bring a comps-based counter.
Risks & watch-outs
- Climate carrying-cost: moderate flood risk; severe wind risk, 80% chance of damaging wind over 30y; moderate wildfire risk; extreme-heat days projected 7→16/yr by 2055 (HVAC capex compounding) — expect insurance premiums to compound above CPI over the hold.
Questions for the listing agent
- What do current leases actually rent for vs. the listed asking? Can we see a recent rent roll and the last 12 months of T-12 income?
- Is there a deadline driving the sale (1031 exchange, divorce, estate, relocation)? That informs how much negotiation room exists.
- The area grade is low — what's the realistic commute time and amenity access for the typical tenant pool here? Any planned neighborhood developments (good or bad) we should know about?
- What's the average days-on-market for RENTAL listings here right now (not sales)? A rising rental-DOM trend means longer vacancies and softer asking-rent achievability than the comps imply.
- What's the recent tenant-quality profile in this submarket — average credit score on applications, eviction rate, late-payment / NSF rate, and stable-employment percentage? A property-management company in the area should have these aggregated.
- How much new for-sale + rental construction is in the pipeline within 1–3 miles? Heavy new supply typically softens prices + rents 12–24 months out; constrained supply supports both.
Investment metrics
- 1% rule
- 0.79% ✗
- Cap rate
- 6.11%
- Cash-on-cash
- -0.67%
- DSCR
- 0.97
- GRM
- 10.5
CMA / ARV
- ARV (on-the-fly)
- $256,592
- Comps found
- 11
Show comp detail 11 sales within ~0.75 mi
| Address | Dist | Beds/Ba | Sqft | Sold | Price | $/sf | Match |
|---|---|---|---|---|---|---|---|
| 712 Mill Bay Dr | 0.11mi | 3/2.0 | 1,573 (-3%) | 2mo | $213,750 | $136 | 84 |
| 6217 Yorkie (lot 72) Ct | 0.21mi | 3/2.0 | 1,543 (-5%) | 4mo | $298,900 | $194 | 74 |
| 620 Tulip Ct | 0.05mi | 3/2.0 | 1,415 (-13%) | 1mo | $238,000 | $168 | 72 |
| 6204 Azelia Dr | 0.18mi | 4/2.0 (+1) | 1,618 (-0%) | 15mo | $250,000 | $155 | 69 |
| 6251 Azelia Dr | 0.10mi | 4/2.0 (+1) | 1,671 (+3%) | 20mo | $263,500 | $158 | 65 |
| 610 Bird Nest Ct | 0.31mi | 3/2.0 | 1,648 (+2%) | 16mo | $250,000 | $152 | 65 |
| 713 Mill Bay Dr | 0.09mi | 3/2.0 | 1,473 (-9%) | 15mo | $244,000 | $166 | 64 |
| 6301 Emerson Grove (lot 1) Ct | 0.19mi | 3/2.0 | 1,774 (+9%) | 10mo | $314,900 | $178 | 63 |
| 6213 Yorkie (lot 71) Ct | 0.22mi | 3/2.0 | 1,774 (+9%) | 9mo | $314,900 | $178 | 63 |
| 605 Bird Nest Ct | 0.30mi | 3/2.0 | 1,742 (+7%) | 19mo | $250,000 | $144 | 54 |
| 921 Fred Hall Rd | 0.59mi | 3/2.0 | 1,573 (-3%) | 22mo | $229,000 | $146 | 45 |
Match score weights: distance 35% · size 25% · config 20% · recency 20%. Top-matched comps best support the ARV.
Projected returns pro-forma
10.0% appreciation · 3.0% rent growth · sell at horizon
- IRR
- 23.8%
- Equity multiple
- 2.91×
- Total profit
- $141,651
- Equity at exit
- $238,733
- IRR
- 21.1%
- Equity multiple
- 6.65×
- Total profit
- $419,106
- Equity at exit
- $514,837
Cash invested: $74,200 (down + closing). Projections, not guarantees.
Landlord ↔ Tenant lean methodology
- Overall (STATE)
- 85 Strongly Landlord-Friendly
- State North Carolina
- 85 Strongly Landlord-Friendly · R+3
- County
- — inherits STATE
- City
- — inherits STATE
ZIP-level market 28391
- Home prices YoY
- 16.1%
- Active inventory
- 33
- Price-to-rent
- 10.5×
Monthly cashflow live
- Estimated rent
- $2,100 medium interval (Pro) →
- Mortgage (P&I)
- −$1,390
- Tax from tax record
- −$200 /mo · $2,402/yr
- Insurance
- −$110
- HOA
- −$0
- Vacancy / Maint / Mgmt
- −$441
- Net cashflow
- $-41
Break-even live
UW: 25.0% down · 7.5% · 30yr · 1.5% tax · 5.0% vac · 8.0% maint · 8.0% mgmt
Financing live
Cash to close
- Down payment
- $66,250
- Closing costs
- $7,950
- Reserves months
- —
- Total cash needed
- —
Loan-product check · same deal, 3 products live
Conventional
25% down · 7.5% · 30yr
- Down + closing
- —
- Monthly P&I
- —
- Monthly cashflow
- —
- DSCR
- —
- Eligible?
- —
Personal DTI + credit; lowest rate.
DSCR
20% down · 8.5% · 30yr
- Down + closing
- —
- Monthly P&I
- —
- Monthly cashflow
- —
- DSCR
- —
- Eligible?
- —
No personal income docs; deal must DSCR.
Hard money
10% down · 12.0% · 12mo
- Down + closing
- —
- Monthly P&I
- —
- Monthly cashflow
- —
- DSCR
- —
- Eligible?
- —
Short-term bridge; refi at stabilization.
Rent comps 1 comps
| Address | Beds | Baths | Sqft | Rent | $/sqft | DOM | Units | Dist |
|---|---|---|---|---|---|---|---|---|
| 6205 Yorkie Ct Stedman, NC | 4.0 | 3.0 | 2069 | $2,100 | $1.01 | 13d | 1 | 0.27mi |
Listing history 10 events
-
2026-05-19$265,000 Active
-
2022-08-30soldstatus $250,000 153-char remark
Show marketing remark (153 chars)
Located in the beautiful Stedman area. Corner lot, new carpet lots of space a must see. Awesome back yard with pool and plenty of space for entertaining.
-
2022-08-30soldstatus $250 Closed 153-char remark
Show marketing remark (153 chars)
Located in the beautiful Stedman area. Corner lot, new carpet lots of space a must see. Awesome back yard with pool and plenty of space for entertaining.
-
2022-08-30soldstatus $250,000
Show marketing remark (153 chars)
Located in the beautiful Stedman area. Corner lot, new carpet lots of space a must see. Awesome back yard with pool and plenty of space for entertaining.
-
2022-08-09status Pending 153-char remark
Show marketing remark (153 chars)
Located in the beautiful Stedman area. Corner lot, new carpet lots of space a must see. Awesome back yard with pool and plenty of space for entertaining.
-
2022-08-05price $250,000 153-char remark
Show marketing remark (153 chars)
Located in the beautiful Stedman area. Corner lot, new carpet lots of space a must see. Awesome back yard with pool and plenty of space for entertaining.
-
2022-07-25$250,000 153-char remark
Show marketing remark (153 chars)
Located in the beautiful Stedman area. Corner lot, new carpet lots of space a must see. Awesome back yard with pool and plenty of space for entertaining.
-
2022-07-25$245,000 Active 153-char remark
Show marketing remark (153 chars)
Located in the beautiful Stedman area. Corner lot, new carpet lots of space a must see. Awesome back yard with pool and plenty of space for entertaining.
-
2005-06-07soldstatus $120,000
-
2003-04-02soldstatus $13,000
ⓘ Source: listings_history table (triggers on properties + properties_extension) + one-shot
backfill from property_details.listing_events for pre-trigger history.
Tax reassessment forecast NC · Resets to sale price
- Current annual tax
- $2,402 · $200/mo
- Projected year-2 tax
- $2,402 · $200/mo
- Expected delta
- $0/yr ($0/mo · 0.0%)
ⓘ Screening estimate from a state-policy table — verify with the county assessor before closing.
Climate risk First Street
- Flood 5/10 Major FEMA zone X (unshaded) · 52% chance over 30 yrs
- Wildfire 5/10 Major
- Heat 7/10 Severe 7 d/yr ≥106°F today · 16 d/yr by 30 yrs out
- Wind 8/10 Severe 80% chance of damaging wind over 30 yrs
- Air quality 1/10 Low 0 unhealthy d/yr today · 0 by 30 yrs out
Nearby sold comps map
Loading sold comps map…
Walkable amenities ~0.75 mi
Loading nearby amenities…
Taxation est. · year 1
- Rental income
- $25,200
- − Mortgage interest
- −$14,844
- − Property taxes
- −$2,402
- − Insurance
- −$1,325
- − Repairs & maintenance
- −$2,016
- − Management
- −$2,016
- − Depreciation
- −$7,709
- Taxable loss
- −$5,112
- Est. tax savings @ 24.0%
- +$1,227
- After-tax cash flow
- $732/yr
For passive investors: Depreciation is non-cash, so a rental often shows a tax loss while cash-flowing — sheltering income. Rental losses are passive: they offset passive income freely, and up to $25,000/yr can offset ordinary (W-2) income if you actively participate and your MAGI is under $100k (phasing out to $0 by $150k); unused losses carry forward. On sale, claimed depreciation is recaptured at up to 25%, and gains may owe capital-gains tax (a 1031 exchange can defer both). Figures are a year-1 estimate at your 24.0% rate — not tax advice; consult a CPA.
Schools (NCES district)
- District
- Cumberland County Schools
- NCES district ID
- 3700011
- Math proficiency
- 32% ▼ -2.00%
- Reading proficiency
- 41% ▼ -1.00%
- Median HH income
- $44,168
- Composite
- 31.0/100
- National rank
- #6096
- State rank
- #126 of 178 in NC
Livability — Stedman
- Score
- 71/100
- State rank
- #107
- US rank
- #6799
Category grades
Schools grade is shown separately in the Schools card above.
Census & demographics
- Census place
- Stedman, NC
- Population (ZIP)
- 5,956
Population outlook (Cumberland County) Hauer SSP2
- Today (2025)
- 330,855 people
- By 2030
- 333,523 · +0.8%
- By 2040
- 335,583 · +1.4%
- By 2050
- 335,325 · +1.4%
- By 2075
- 342,853 · +3.6%
- By 2100
- 340,698 · +3.0%
Race, ethnicity, and origin ACS 2023
- Neighborhood character
- Predominantly White (77%)
- Race & ethnicity
- White 77% Black 12% Two or more races 7% Hispanic / Latino 2% Native American 2%
- Common ancestry
- Slovak 4% Serbian 2% Iranian 2%
- Foreign-born
- 2% · Canada
- Languages at home
- 98% English-only · Spanish 1%
Political lean MEDSL · Cumberland
- 2024 margin
- D (+13.4) · D 56.1% · R 42.7% · Other 1.2%
- 2008→2024 swing
- -4.3pp toward R · 2008: 17.7pp · 2024: 13.4pp
- All cycles
- 2024: D+13.4 2020: D+16.6 2016: D+16.0 2012: D+19.7 2008: D+17.7
Not yet ingested
- Civics
- —
Market trends
- HPI YoY
- ▲ 46.06%
- Current HPI
- 331.7099
- Rent YoY
- —
- Metro
- —
- State GDP YoY
- ▲ 3.28%
- F500 in state
- 26
Industry mix (Fortune 500 HQ in NC)
| Industry | F500 HQs | Revenue |
|---|---|---|
| Financial Services | 2 | $213B |
|
||
| Retail | 2 | $95B |
|
||
| Industrial Conglomerate | 1 | $38B |
|
||
| Metals / Steel | 1 | $35B |
|
||
| Utilities | 1 | $30B |
|
||
| Industrial Machinery | 1 | $19B |
|
||
Price history
+1938.5% since first listed10 events — show timeline
- 2026-05-19 Listed $265,000 LPRMLS
- 2022-08-30 Sold (Public Records) $250,000 Public Records
- 2022-08-30 Sold (MLS) $250 TMLS
- 2022-08-30 Sold (MLS) $250,000 LPRMLS
- 2022-08-09 Pending — TMLS
- 2022-08-05 Price Changed $250,000 TMLS
- 2022-07-25 Listed $245,000 TMLS
- 2022-07-25 Listed $250,000 LPRMLS
- 2005-06-07 Sold (Public Records) $120,000 Public Records
- 2003-04-02 Sold (Public Records) $13,000 Public Records
Property tax history
+2.3%/yrLatest (2025): $2,402 · +24.0% YoY. Source: county tax records.
Cash-flow waterfall
monthlySold comps — $/sqft
last 12 mo · ≤1 miLoading sold comps…