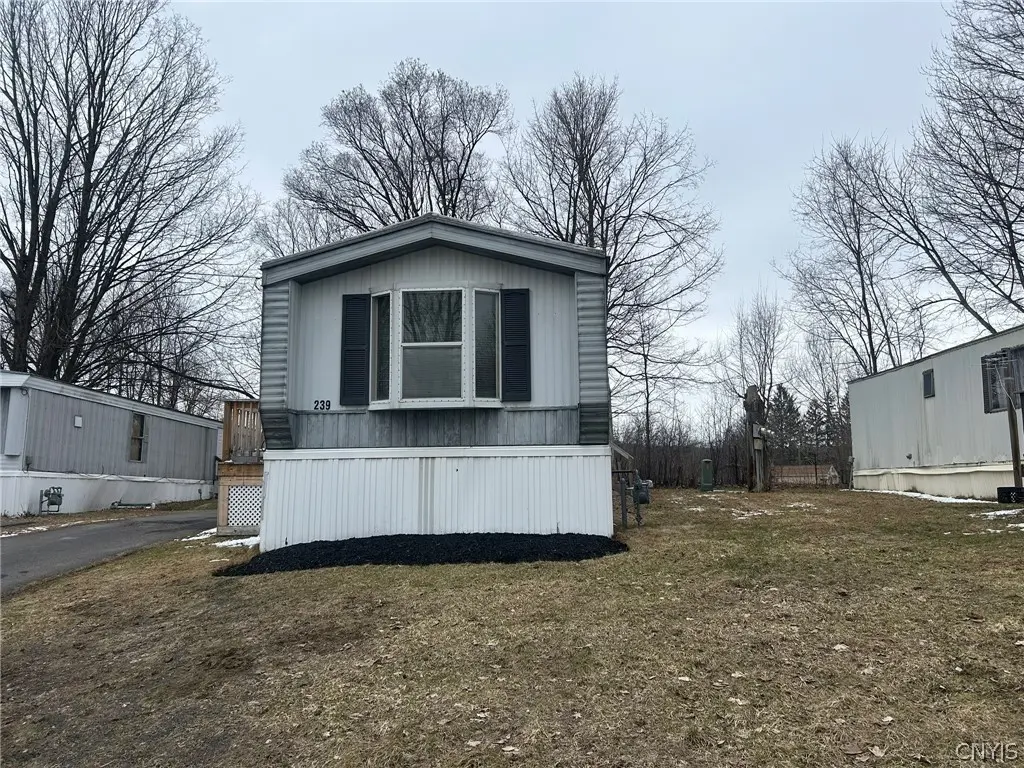
239 Colonial Cir · Utica, NY
Flood risk 1/10 · Minimal
- FEMA flood zone
- X (unshaded)
- Chance of flooding over 30 yrs
- 0.0%
- Est. flood insurance / yr
- $507 – $1,088
Fire risk 3/10 · Minor
- Est. fire insurance / yr
- $691 – $1,283
Heat risk 3/10 · Minor
- Hot days now (above 96°F)
- 7 days/yr
- Hot days in 30 yrs
- 16 days/yr
Wind risk 2/10 · Minimal
- Chance of severe wind over 30 yrs
- 1.0%
Air-quality risk 2/10 · Minimal
- Unhealthy air days now
- 0 days/yr
- Unhealthy air days in 30 yrs
- 1 days/yr
Risk factors via First Street. Map © Google.
Why this score? — see what drove the C+ grade
The composite is a weighted blend of 9 inputs, each scored 0–100. Each bar is that input's sub-score; the figure is the points it added to the 100-point composite (weight × sub-score).
- Cash flow +30.0/30.0
- 1% rule +10.0/10.0
- DSCR +10.0/10.0
- Livability +4.0/5.0
- Schools +2.9/10.0
- Rent growth +2.5/5.0
- Condition / age +2.2/5.0
- ARV discount +1.7/15.0
- Appreciation +0.0/10.0
$39,500
🖨 Deal sheet 📄 Offer letter ✓ Due diligence
Listing remarks MLS
Single-wide mobile home in hertiage acres. Great condition, new carpet and appliances 2 bedrooms, bathroom, laundry area with washer and dryer, beautiful electric fireplace, and blacktop driveway. Before making a written offer, the buyer must make an application for park approval. Pets are allowed. Certain breed restrictions. Contact Heritage acres at 585-434-3032 for more info and application, or visit their website.
Key facts
- Blacktop driveway
- New carpet
- New appliances
Tags
Neighborhood map
What this means for you Summary
Snapshot
- This is a 2-bed/1.0-bath manufactured listed at $40k. Condition is rated fair.
Deal economics
- At list price, monthly cash flow is $789 ($9k/yr) — positive.
- The deal already cash-flows at list — no discount required.
- Meets the 1% rule at list price ($1k rent vs $40k).
- Recommended offer: $36k (9.0% below list) — sets the bar for market timing.
- Cap rate 30.3% vs local median 7.7% in Utica — top-decile yield for the area; either an underpriced asset or a hidden risk that comps aren't pricing in. Stress-test before assuming the spread holds.
Location & tenants
- Location reads 80/100 on livability (#104 in NY, #1,589 nationally) — a professional / high-income tenant draw. Strengths: commute A+, cost of living A+, housing A+; Watch: employment D, schools D-, crime F.
- Utica City School District (urban): math 33% / reading 38% proficiency, ranked #562 of 590 in NY (top 95%) — families likely to look elsewhere, expect single-tenant / working-renter base with shorter leases; 71% free/reduced lunch — lower-income household profile, screen leases tightly.
- Market conditions: 150 active listings in the ZIP; 204 units permitted in Oneida County in 2024 (68 in 5+ unit buildings).
Forward outlook
- Local home prices are declining (-3.0%/yr); year-one equity from $273 of loan paydown is wiped out by about $1k of value loss. Plan a longer hold.
- Oneida County population projected at -12% by 2050 — secular population decline; favor cash flow + early exit over multi-decade hold.
- At projected returns (-3.0% appreciation + 3.0% rent growth), your $11k cash investment doubles in ~2 years — after that, you're playing with house money.
Negotiation context
- It's been on market 91 days — a 9% lower offer ($36k) is reasonable based on typical stale-listing flexibility.
- 2 sale attempts; this cycle's ask has dropped $20k (34%) from the opening price — seller is motivated, your offer sets the floor, not the list.
Questions for the listing agent
- It's been on market 91 days. Have you received any prior offers? Is the seller open to a 9% concession, seller financing, or rate buy-down credit?
- Have any recent inspections been done? Can we get a copy of the seller's disclosures and any deferred-maintenance estimates?
- Why hasn't it sold? Are there any deal-killer items the seller is aware of (foundation, flood, title, zoning, code violations)?
- Is there a deadline driving the sale (1031 exchange, divorce, estate, relocation)? That informs how much negotiation room exists.
- Schools are D-rated, which usually means shorter tenancies and higher turnover. Who's the typical renter profile here, and what's been the actual vacancy rate?
- Crime grade is F in this area — have there been break-ins, vandalism, or insurance claims at this property in the last 3 years? What carrier currently insures it and at what premium?
- What's the average days-on-market for RENTAL listings here right now (not sales)? A rising rental-DOM trend means longer vacancies and softer asking-rent achievability than the comps imply.
- What's the recent tenant-quality profile in this submarket — average credit score on applications, eviction rate, late-payment / NSF rate, and stable-employment percentage? A property-management company in the area should have these aggregated.
- How much new for-sale + rental construction is in the pipeline within 1–3 miles? Heavy new supply typically softens prices + rents 12–24 months out; constrained supply supports both.
Investment metrics
- 1% rule
- 3.40% ✓
- Cap rate
- 30.26%
- Cash-on-cash
- 85.61%
- DSCR
- 4.81
- GRM
- 2.4
CMA / ARV
- ARV (median comp)
- $35,000
- List price
- $39,500
- Delta
- 12.86%
- Verdict
- OVERPRICED
- Comps
- 5 within 1.0 mi
Show comp detail 6 sales within ~0.75 mi
| Address | Dist | Beds/Ba | Sqft | Sold | Price | $/sf | Match |
|---|---|---|---|---|---|---|---|
| 608 Kilkenny Dr | 0.31mi | 3/1.0 (+1) | 853 (+2%) | 2mo | $64,400 | $75 | 76 |
| 635 Kilkenny Dr | 0.35mi | 3/1.0 (+1) | 853 (+2%) | 4mo | $65,000 | $76 | 73 |
| 153 Rodeo Dr | 0.33mi | 2/1.0 | 800 (-5%) | 7mo | $20,000 | $25 | 71 |
| 170 Concord Dr | 0.25mi | 2/2.0 | 900 (+7%) | 4mo | $35,000 | $39 | 69 |
| 135 Concord Dr | 0.08mi | 3/1.0 (+1) | 813 (-3%) | 23mo | $49,000 | $60 | 66 |
| 254 Blossom Ln | 0.37mi | 2/1.0 | 910 (+8%) | 13mo | $37,000 | $41 | 58 |
Match score weights: distance 35% · size 25% · config 20% · recency 20%. Top-matched comps best support the ARV.
Projected returns pro-forma
-3.0% appreciation · 3.0% rent growth · sell at horizon
- IRR
- 86.1%
- Equity multiple
- 4.97×
- Total profit
- $43,875
- Equity at exit
- $5,890
- IRR
- 89.2%
- Equity multiple
- 10.31×
- Total profit
- $102,999
- Equity at exit
- $3,415
Cash invested: $11,060 (down + closing). Projections, not guarantees.
Landlord ↔ Tenant lean methodology
- Overall (STATE)
- 15 Strongly Tenant-Friendly
- State New York
- 15 Strongly Tenant-Friendly · D+10
- County
- — inherits STATE
- City
- — inherits STATE
ZIP-level market 13502
- Home prices YoY
- -12.1%
- Active inventory
- 150
- Price-to-rent
- 2.4×
Monthly cashflow live
- Estimated rent
- $1,344 medium interval (Pro) →
- Mortgage (P&I)
- −$207
- Tax est. 1.5%
- −$49 /mo · $592/yr
- Insurance
- −$16
- HOA
- −$0
- Vacancy / Maint / Mgmt
- −$282
- Net cashflow
- $789
Break-even live
UW: 25.0% down · 7.5% · 30yr · 1.5% tax · 5.0% vac · 8.0% maint · 8.0% mgmt
Financing live
Cash to close
- Down payment
- $9,875
- Closing costs
- $1,185
- Reserves months
- —
- Total cash needed
- —
Loan-product check · same deal, 3 products live
Conventional
25% down · 7.5% · 30yr
- Down + closing
- —
- Monthly P&I
- —
- Monthly cashflow
- —
- DSCR
- —
- Eligible?
- —
Personal DTI + credit; lowest rate.
DSCR
20% down · 8.5% · 30yr
- Down + closing
- —
- Monthly P&I
- —
- Monthly cashflow
- —
- DSCR
- —
- Eligible?
- —
No personal income docs; deal must DSCR.
Hard money
10% down · 12.0% · 12mo
- Down + closing
- —
- Monthly P&I
- —
- Monthly cashflow
- —
- DSCR
- —
- Eligible?
- —
Short-term bridge; refi at stabilization.
Listing history 27 events
-
2026-06-19days on market $39,500 Active 91 DOM
-
2026-06-18days on market $39,500 Active 90 DOM
-
2026-06-17days on market $39,500 Active 89 DOM
-
2026-06-16days on market $39,500 Active 88 DOM
-
2026-06-15price $39,500 Active 87 DOM
-
2026-06-15days on market $49,500 Active 87 DOM
-
2026-06-14days on market $49,500 Active 85 DOM
-
2026-06-13days on market $49,500 Active 84 DOM
-
2026-06-10days on market $49,500 Active 82 DOM
-
2026-06-09days on market $49,500 Active 81 DOM
-
2026-06-08days on market $49,500 Active 80 DOM
-
2026-06-07days on market $49,500 Active 79 DOM
-
2026-06-03days on market $49,500 Active 75 DOM
-
2026-06-02days on market $49,500 Active 74 DOM
-
2026-06-01days on market $49,500 Active 73 DOM
-
2026-05-31days on market $49,500 Active 72 DOM
-
2026-05-30days on market $49,500 Active 71 DOM
-
2026-05-04price $49,500 421-char remark
Show marketing remark (421 chars)
Single-wide mobile home in hertiage acres. Great condition, new carpet and appliances 2 bedrooms, bathroom, laundry area with washer and dryer, beautiful electric fireplace, and blacktop driveway. Before making a written offer, the buyer must make an application for park approval. Pets are allowed. Certain breed restrictions. Contact Heritage acres at 585-434-3032 for more info and application, or visit their website.
-
2026-04-20price $54,500 421-char remark
Show marketing remark (421 chars)
Single-wide mobile home in hertiage acres. Great condition, new carpet and appliances 2 bedrooms, bathroom, laundry area with washer and dryer, beautiful electric fireplace, and blacktop driveway. Before making a written offer, the buyer must make an application for park approval. Pets are allowed. Certain breed restrictions. Contact Heritage acres at 585-434-3032 for more info and application, or visit their website.
-
2026-03-20$59,500 Active 421-char remark
Show marketing remark (421 chars)
Single-wide mobile home in hertiage acres. Great condition, new carpet and appliances 2 bedrooms, bathroom, laundry area with washer and dryer, beautiful electric fireplace, and blacktop driveway. Before making a written offer, the buyer must make an application for park approval. Pets are allowed. Certain breed restrictions. Contact Heritage acres at 585-434-3032 for more info and application, or visit their website.
-
2025-12-16historical
-
2025-11-05status Pending
-
2025-11-03historical
-
2025-10-25price $12,000
-
2025-10-08price $16,000
-
2025-09-26price $27,500
-
2025-09-12$34,500 Active
ⓘ Source: listings_history table (triggers on properties + properties_extension) + one-shot
backfill from property_details.listing_events for pre-trigger history.
Climate risk First Street
- Flood 1/10 Low FEMA zone X (unshaded) · 0% chance over 30 yrs
- Wildfire 3/10 Moderate
- Heat 3/10 Moderate 7 d/yr ≥96°F today · 16 d/yr by 30 yrs out
- Wind 2/10 Low 100% chance of damaging wind over 30 yrs
- Air quality 2/10 Low 0 unhealthy d/yr today · 1 by 30 yrs out
Nearby sold comps map
Loading sold comps map…
Walkable amenities ~0.75 mi
Loading nearby amenities…
Taxation est. · year 1
- Rental income
- $16,132
- − Mortgage interest
- −$2,213
- − Property taxes
- −$592
- − Insurance
- −$198
- − Repairs & maintenance
- −$1,291
- − Management
- −$1,291
- − Depreciation
- −$1,149
- Taxable income
- $9,399
- Est. tax owed @ 24.0%
- −$2,256
- After-tax cash flow
- $7,213/yr
For passive investors: Depreciation is non-cash, so a rental often shows a tax loss while cash-flowing — sheltering income. Rental losses are passive: they offset passive income freely, and up to $25,000/yr can offset ordinary (W-2) income if you actively participate and your MAGI is under $100k (phasing out to $0 by $150k); unused losses carry forward. On sale, claimed depreciation is recaptured at up to 25%, and gains may owe capital-gains tax (a 1031 exchange can defer both). Figures are a year-1 estimate at your 24.0% rate — not tax advice; consult a CPA.
Condition & rehab AI · 2 photos
This single-wide mobile home requires cosmetic repairs and maintenance to improve its curb appeal and value. The roof and exterior siding show significant wear, and the landscaping is overgrown. Painting the exterior and repairing the roof would be the highest-ROI updates.
Repairs flagged
- Major roof — Signs of wear and potential leaks
- Major exterior siding — Worn and peeling
- Major landscaping — Overgrown and unkempt
Value-add opportunities
- Both paint exterior — Enhances curb appeal and value
- Both repair roof — Prevents water damage and increases value
- Both landscape — Improves curb appeal and rental value
Renovation cost estimate screening
| Repair item | Severity | Est. cost |
|---|---|---|
| roof · Signs of wear and potential leaks | Major | $15,000–50,000 |
| exterior siding · Worn and peeling | Major | $15,000–50,000 |
| landscaping · Overgrown and unkempt | Major | $15,000–50,000 |
| Total estimated repair cost · 3 items | $45,000–150,000 |
Value-add ROI direction
- Both paint exterior — Enhances curb appeal and value ↑
- Both repair roof — Prevents water damage and increases value ↑
- Both landscape — Improves curb appeal and rental value ↑
ⓘ Cost ranges are severity-bucket heuristics (US national rule-of-thumb). Get contractor quotes + a written scope before underwriting a rehab budget.
Schools (NCES district)
- District
- Utica City School District
- NCES district ID
- 3629370
- Math proficiency
- 33% ▼ -7.00%
- Reading proficiency
- 38% ▲ 2.00%
- Median HH income
- $31,834
- Composite
- 29.01/100
- National rank
- #6613
- State rank
- #562 of 590 in NY
Livability — Utica
- Score
- 80/100
- State rank
- #104
- US rank
- #1589
Category grades
Schools grade is shown separately in the Schools card above.
Census & demographics
- Census place
- Utica, NY
- County
- Oneida County · 89,710 people
- City population
- 72,968
- Metro
- Utica-Rome, NY
- Population (ZIP)
- 34,037
- Household income
- $57,835
- Rent vs Own
- Severe rent burden
- 1604.0
Population outlook (Oneida County) Hauer SSP2
- Today (2025)
- 225,223 people
- By 2030
- 220,384 · -2.1%
- By 2040
- 209,071 · -7.2%
- By 2050
- 197,920 · -12.1%
- By 2075
- 175,541 · -22.1%
- By 2100
- 148,491 · -34.1%
Race, ethnicity, and origin ACS 2023
- Neighborhood character
- Predominantly White (71%)
- Race & ethnicity
- White 71% Hispanic / Latino 11% Black 9% Two or more races 7% Asian 5%
- Hispanic origin (detail)
- Mexican 2% Puerto Rican 5% Dominican 2%
- Common ancestry
- Romanian 11% Lithuanian 3% American 2%
- Foreign-born
- 12% · Canada, Philippines, China
- Languages at home
- 81% English-only · Spanish 7% Russian/Polish/Slavic 4% Other Asian/Pacific 3%
Political lean MEDSL · Oneida
- 2024 margin
- Strong R (+21.3) · D 39.4% · R 60.6%
- 2008→2024 swing
- -15.2pp toward R · 2008: -6.1pp · 2024: -21.3pp
- All cycles
- 2024: R+21.3 2020: R+15.5 2016: R+21.1 2012: R+5.3 2008: R+6.1
Not yet ingested
- Civics
- —
Market trends
- HPI YoY
- ▼ -50.76%
- Current HPI
- 368.3955
- Rent YoY
- —
- Metro
- Utica-Rome, NY
- State GDP YoY
- ▲ 2.60%
- F500 in state
- 92
Industry mix (Fortune 500 HQ in NY)
| Industry | F500 HQs | Revenue |
|---|---|---|
| Financial Services | 10 | $950B |
|
||
| Consumer Goods | 9 | $162B |
|
||
| Insurance | 4 | $225B |
|
||
| Telecommunications | 2 | $144B |
|
||
| Pharmaceuticals | 2 | $112B |
|
||
| Media / Entertainment | 2 | $69B |
|
||
Price history
+43.5% since first listed10 events — show timeline
- 2026-05-04 Price Changed $49,500 CNYIS
- 2026-04-20 Price Changed $54,500 CNYIS
- 2026-03-20 Listed $59,500 CNYIS
- 2025-12-16 Listing Removed — CNYIS
- 2025-11-05 Pending — CNYIS
- 2025-11-03 Listing Removed — CNYIS
- 2025-10-25 Price Changed $12,000 CNYIS
- 2025-10-08 Price Changed $16,000 CNYIS
- 2025-09-26 Price Changed $27,500 CNYIS
- 2025-09-12 Listed $34,500 CNYIS
Cash-flow waterfall
monthlySold comps — $/sqft
last 12 mo · ≤1 miLoading sold comps…