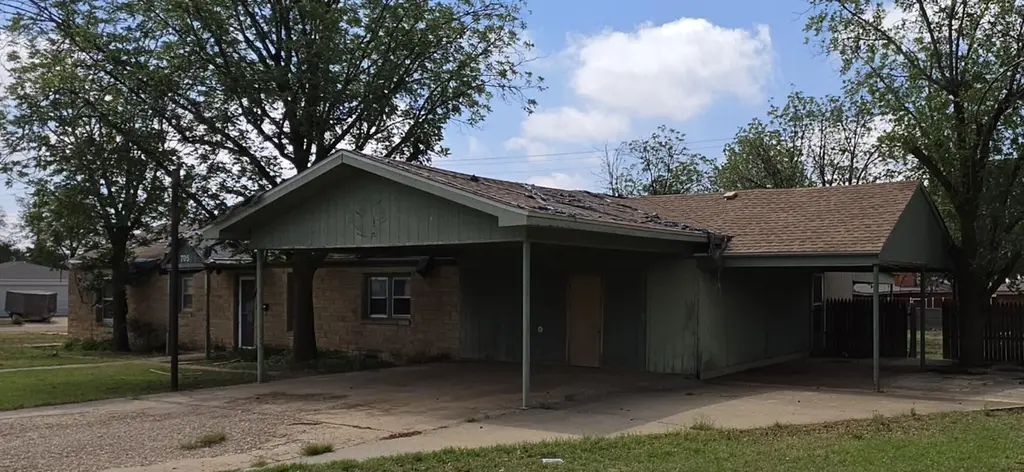
706 E Buckley St · Brownfield, TX
Flood risk 1/10 · Minimal
- FEMA flood zone
- —
- Chance of flooding over 30 yrs
- 0.0%
- Est. flood insurance / yr
- —
Fire risk 1/10 · Minimal
- Est. fire insurance / yr
- $1,222 – $2,270
Heat risk 5/10 · Moderate
- Hot days now (above 99°F)
- 7 days/yr
- Hot days in 30 yrs
- 21 days/yr
Wind risk 2/10 · Minimal
- Chance of severe wind over 30 yrs
- 1.0%
Air-quality risk 1/10 · Minimal
- Unhealthy air days now
- 0 days/yr
- Unhealthy air days in 30 yrs
- 0 days/yr
Risk factors via First Street. Map © Google.
Why this score? — see what drove the B- grade
The composite is a weighted blend of 9 inputs, each scored 0–100. Each bar is that input's sub-score; the figure is the points it added to the 100-point composite (weight × sub-score).
- Cash flow +30.0/30.0
- 1% rule +10.0/10.0
- DSCR +10.0/10.0
- ARV discount +7.5/15.0
- Livability +3.6/5.0
- Rent growth +2.5/5.0
- Condition / age +2.5/5.0
- Schools +2.2/10.0
- Appreciation +0.0/10.0
$89,700
🖨 Deal sheet (PDF) 📄 Offer letter ✓ Due diligence
Key facts
- 0.48 acre lot
- 2 parking spots
- Built 1968
Property features AI
Exterior
- Parking: Carport (2 spaces); Driveway
- Utilities: Public water; Public sewer
- Home design: Single-family residence; Residential property; Reported as fixer condition
- Construction: Brick and Masonite construction; Composition roof; Pillar/post/pier foundation; Built on a 0.48-acre lot
- Exterior features: Covered patio; Patio; Fenced backyard; Corner lot; Paved, publicly maintained city street frontage
Interior
- Kitchen: Gas water heater (appliance listed); Water heater
- Flooring: Carpet; Vinyl
- Bathrooms: Three full bathrooms
- Heating & cooling: Central heating (natural gas); Central air conditioning; Ceiling fans; Electric cooling components
- Interior features: Other interior features; Gas-started stone fireplace in the family room; One fireplace
- Laundry & utility: Laundry room with electric dryer hookup
Neighborhood map
What this means for you Summary
Snapshot
- This is a 3-bed/3.0-bath single-family listed at $90k.
Deal economics
- At list price, monthly cash flow is $802 ($10k/yr) — positive.
- The deal already cash-flows at list — no discount required.
- Meets the 1% rule at list price ($2k rent vs $90k).
- Recommended offer: $88k (1.5% below list) — sets the bar for market timing.
Location & tenants
- Location reads 71/100 on livability (#298 in TX) — a middle-class / working-renter tenant base. Strengths: cost of living A+, housing A+, health & safety A+; Watch: crime D+, amenities D, commute F.
- Brownfield ISD (town): math 26% / reading 27% proficiency, ranked #704 of 826 in TX (top 85%) — low school quality limits family demand, transient renter base, plan for 1-2y turnover; 70% free/reduced lunch — lower-income household profile, screen leases tightly.
- Zoned schools: Colonial Heights El (141 students, 94% FRL); Brownfield Middle (math 24% / reading 28%, grade F, #1,222 of 1,662 statewide, top 74%, 354 students, 83% FRL); Brownfield H S (math 37% / reading 32%, grade F, #963 of 1,632 statewide, top 61%, 443 students, 78% FRL).
- Market conditions: 92 active listings in the ZIP; 1 comparable units currently listed for rent nearby; 2 units permitted in Terry County in 2024 (0 in 5+ unit buildings).
Forward outlook
- Local home prices are declining (-3.0%/yr); year-one equity from $620 of loan paydown is wiped out by about $3k of value loss. Plan a longer hold.
- Terry County population projected at +16% by 2050 — long-run rental-demand tailwind backs the buy-and-hold thesis.
- At projected returns (-3.0% appreciation + 3.0% rent growth), your $25k cash investment doubles in ~4 years — after that, you're playing with house money.
Negotiation context
- It's been on market 25 days — a 2% lower offer ($88k) is reasonable based on typical stale-listing flexibility.
- 2 sale attempts since 5y ago; this cycle's ask has dropped $20k (18%) from the opening price — seller is motivated, your offer sets the floor, not the list.
Risks & watch-outs
- Climate carrying-cost: extreme-heat days projected 7→21/yr by 2055 (HVAC capex compounding) — expect insurance premiums to compound above CPI over the hold.
Questions for the listing agent
- Built in 1968 — when were the roof, HVAC, electrical panel, plumbing, and water heater last replaced?
- Is there a deadline driving the sale (1031 exchange, divorce, estate, relocation)? That informs how much negotiation room exists.
- Schools are F-rated, which usually means shorter tenancies and higher turnover. Who's the typical renter profile here, and what's been the actual vacancy rate?
- Crime grade is D in this area — have there been break-ins, vandalism, or insurance claims at this property in the last 3 years? What carrier currently insures it and at what premium?
- What's the average days-on-market for RENTAL listings here right now (not sales)? A rising rental-DOM trend means longer vacancies and softer asking-rent achievability than the comps imply.
- What's the recent tenant-quality profile in this submarket — average credit score on applications, eviction rate, late-payment / NSF rate, and stable-employment percentage? A property-management company in the area should have these aggregated.
- How much new for-sale + rental construction is in the pipeline within 1–3 miles? Heavy new supply typically softens prices + rents 12–24 months out; constrained supply supports both.
Investment metrics
- 1% rule
- 2.01% ✓
- Cap rate
- 17.02%
- Cash-on-cash
- 38.32%
- DSCR
- 2.71
- GRM
- 4.2
CMA / ARV
No comps found within radius.
Projected returns pro-forma
-3.0% appreciation · 3.0% rent growth · sell at horizon
- IRR
- 34.4%
- Equity multiple
- 2.46×
- Total profit
- $36,578
- Equity at exit
- $13,375
- IRR
- 41.3%
- Equity multiple
- 4.89×
- Total profit
- $97,744
- Equity at exit
- $7,756
Cash invested: $25,116 (down + closing). Projections, not guarantees.
Landlord ↔ Tenant lean methodology
- Overall (STATE)
- 87 Strongly Landlord-Friendly
- State Texas
- 87 Strongly Landlord-Friendly · R+5
- County
- — inherits STATE
- City
- — inherits STATE
ZIP-level market 79316
- Active inventory
- 92
- Price-to-rent
- 4.2×
Monthly cashflow live
- Estimated rent
- $1,800 medium interval (Pro) →
- Mortgage (P&I)
- −$470
- Tax est. 1.5%
- −$112 /mo · $1,346/yr
- Insurance
- −$37
- HOA
- −$0
- Lot rent
- −$0
- Vacancy / Maint / Mgmt
- −$378
- Net cashflow
- $802
Break-even live
Sensitivity live
| Price | -10% $864 | -5% $833 | +0% $802 | +5% $771 | +10% $740 |
|---|---|---|---|---|---|
| Rent | -10% $660 | -5% $731 | +0% $802 | +5% $873 | +10% $944 |
| Rate | -1.0pp $847 | -0.5pp $825 | base $802 | +0.5pp $779 | +1.0pp $755 |
UW: 25.0% down · 7.5% · 30yr · 1.5% tax · 5.0% vac · 8.0% maint · 8.0% mgmt
Financing live
Cash to close
- Down payment
- $22,425
- Closing costs
- $2,691
- Reserves months
- —
- Total cash needed
- —
Loan-product check · same deal, 3 products live
Conventional
25% down · 7.5% · 30yr
- Down + closing
- —
- Monthly P&I
- —
- Monthly cashflow
- —
- DSCR
- —
- Eligible?
- —
Personal DTI + credit; lowest rate.
DSCR
20% down · 8.5% · 30yr
- Down + closing
- —
- Monthly P&I
- —
- Monthly cashflow
- —
- DSCR
- —
- Eligible?
- —
No personal income docs; deal must DSCR.
Hard money
10% down · 12.0% · 12mo
- Down + closing
- —
- Monthly P&I
- —
- Monthly cashflow
- —
- DSCR
- —
- Eligible?
- —
Short-term bridge; refi at stabilization.
Rent comps 1 comps
| Address | Beds | Baths | Sqft | Rent | $/sqft | DOM | Units | Dist |
|---|---|---|---|---|---|---|---|---|
| 1707 Gillham Dr Brownfield, TX | 3.0 | 2.0 | 2064 | $1,800 | $0.87 | 46d | 1 | 1.03mi |
Listing history 22 events
-
2026-06-22days on market $89,700 Active 25 DOM
-
2026-06-21days on market $89,700 Active 24 DOM
-
2026-06-21days on market $89,700 Active 23 DOM
-
2026-06-18days on market $89,700 Active 21 DOM
-
2026-06-17days on market $89,700 Active 20 DOM
-
2026-06-16days on market $89,700 Active 19 DOM
-
2026-06-15days on market $89,700 Active 18 DOM
-
2026-06-13days on market $89,700 Active 16 DOM
-
2026-06-12pricedays on market $89,700 Active 15 DOM
-
2026-06-09days on market $99,000 Active 12 DOM
-
2026-06-08days on market $99,000 Active 11 DOM
-
2026-06-08days on market $99,000 Active 10 DOM
-
2026-06-07pricedays on market $99,000 Active 9 DOM
-
2026-06-03days on market $109,500 Active 6 DOM
-
2026-06-02days on market $109,500 Active 5 DOM
-
2026-06-01days on market $109,500 Active 4 DOM
-
2026-05-31days on market $109,500 Active 3 DOM
-
2026-05-28$109,500 Active
-
2021-01-22$118,500
-
2002-08-09soldstatus
-
2001-08-10soldstatus
-
2000-10-10soldstatus
ⓘ Source: listings_history table (triggers on properties + properties_extension) + one-shot
backfill from property_details.listing_events for pre-trigger history.
Climate risk First Street
- Flood 1/10 Low 0% chance over 30 yrs
- Wildfire 1/10 Low
- Heat 5/10 Major 7 d/yr ≥99°F today · 21 d/yr by 30 yrs out
- Wind 2/10 Low 100% chance of damaging wind over 30 yrs
- Air quality 1/10 Low 0 unhealthy d/yr today · 0 by 30 yrs out
Nearby sold comps map
Loading sold comps map…
Walkable amenities ~0.75 mi
Loading nearby amenities…
Taxation est. · year 1
- Rental income
- $21,600
- − Mortgage interest
- −$5,025
- − Property taxes
- −$1,346
- − Insurance
- −$448
- − Repairs & maintenance
- −$1,728
- − Management
- −$1,728
- − Depreciation
- −$2,609
- Taxable income
- $8,716
- Est. tax owed @ 24.0%
- −$2,092
- After-tax cash flow
- $7,533/yr
For passive investors: Depreciation is non-cash, so a rental often shows a tax loss while cash-flowing — sheltering income. Rental losses are passive: they offset passive income freely, and up to $25,000/yr can offset ordinary (W-2) income if you actively participate and your MAGI is under $100k (phasing out to $0 by $150k); unused losses carry forward. On sale, claimed depreciation is recaptured at up to 25%, and gains may owe capital-gains tax (a 1031 exchange can defer both). Figures are a year-1 estimate at your 24.0% rate — not tax advice; consult a CPA.
Schools (NCES district)
- District
- Brownfield ISD
- NCES district ID
- 4811610
- Math proficiency
- 26% ▼ -11.00%
- Reading proficiency
- 27% ▲ 1.00%
- Median HH income
- $37,385
- Composite
- 22.1/100
- National rank
- #8180
- State rank
- #704 of 826 in TX
Livability — Brownfield
- Score
- 71/100
- State rank
- #298
- US rank
- #6822
Category grades
Schools grade is shown separately in the Schools card above.
Census & demographics
- Census place
- Brownfield, TX
- Population (ZIP)
- 9,907
Population outlook (Terry County) Hauer SSP2
- Today (2025)
- 13,220 people
- By 2030
- 13,500 · +2.1%
- By 2040
- 14,327 · +8.4%
- By 2050
- 15,340 · +16.0%
- By 2075
- 18,459 · +39.6%
- By 2100
- 20,433 · +54.6%
Race, ethnicity, and origin ACS 2023
- Neighborhood character
- Majority Hispanic (57%)
- Race & ethnicity
- Hispanic / Latino 57% White 37% Two or more races 32% Black 5%
- Hispanic origin (detail)
- Mexican 47%
- Common ancestry
- Italian 2% Slovak 1% German 1%
- Foreign-born
- 8% · Canada
- Languages at home
- 63% English-only · Spanish 34% German/W. Germanic 2%
Political lean MEDSL · Terry
- 2024 margin
- Solid R (+65.2) · D 17.2% · R 82.3%
- 2008→2024 swing
- -30.1pp toward R · 2008: -35.0pp · 2024: -65.2pp
- All cycles
- 2024: R+65.2 2020: R+56.9 2016: R+49.4 2012: R+41.6 2008: R+35.0
Not yet ingested
- Civics
- —
Market trends
- HPI YoY
- ▼ -65.34%
- Current HPI
- 104.1813
- Rent YoY
- —
- Metro
- —
- State GDP YoY
- ▲ 3.95%
- F500 in state
- 110
Industry mix (Fortune 500 HQ in TX)
| Industry | F500 HQs | Revenue |
|---|---|---|
| Energy | 16 | $1,198B |
|
||
| Technology | 5 | $198B |
|
||
| Engineering / Construction | 4 | $72B |
|
||
| Energy Services | 3 | $60B |
|
||
| Utilities | 3 | $41B |
|
||
| Healthcare | 2 | $330B |
|
||
Price history
-7.6% since first listed5 events — show timeline
- 2026-05-28 Listed $109,500 LARMLS
- 2021-01-22 Listed $118,500 LARMLS
- 2002-08-09 Sold (Public Records) — Public Records
- 2001-08-10 Sold (Public Records) — Public Records
- 2000-10-10 Sold (Public Records) — Public Records
Property tax history
+10.2%/yrLatest (2025): $5,832 · +3.5% YoY. Source: county tax records.
Cash-flow waterfall
monthlySold comps — $/sqft
last 12 mo · ≤1 miLoading sold comps…