2840 Iverson St #104 · Hillcrest Heights, MD
Flood risk 1/10 · Minimal
- FEMA flood zone
- X (unshaded)
- Chance of flooding over 30 yrs
- 0.0%
- Est. flood insurance / yr
- $507 – $1,088
Fire risk 1/10 · Minimal
- Est. fire insurance / yr
- $755 – $1,403
Heat risk 7/10 · Major
- Hot days now (above 103°F)
- 7 days/yr
- Hot days in 30 yrs
- 16 days/yr
Wind risk 4/10 · Minor
- Chance of severe wind over 30 yrs
- 20.0%
Air-quality risk 3/10 · Minor
- Unhealthy air days now
- 2 days/yr
- Unhealthy air days in 30 yrs
- 3 days/yr
Risk factors via First Street. Map © Google.
Why this score? — see what drove the D grade
The composite is a weighted blend of 9 inputs, each scored 0–100. Each bar is that input's sub-score; the figure is the points it added to the 100-point composite (weight × sub-score).
- Cash flow +14.7/30.0
- 1% rule +7.9/10.0
- ARV discount +7.5/15.0
- DSCR +4.5/10.0
- Livability +3.9/5.0
- Condition / age +2.5/5.0
- Rent growth +1.8/5.0
- Schools +1.7/10.0
- Appreciation +0.0/10.0
$129,999
🖨 Deal sheet (PDF) 📄 Offer letter ✓ Due diligence
Listing remarks
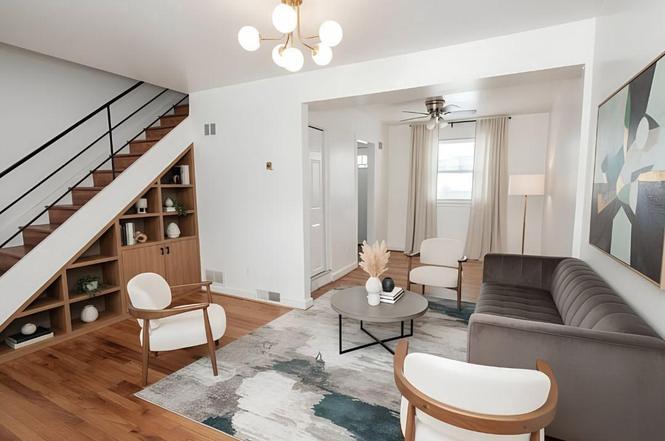
Welcome home! Whether you’re a first-time homebuyer or searching for your first investment property, this turn-key condo is a fantastic opportunity. Located in the established Iverson Square community, this charming 2-bedroom, 1-full-bath home features stainless steel appliances, an updated kitchen and bath, and fresh paint throughout. Enjoy unbeatable convenience with Iverson Mall just steps away, easy access to multiple Metro stations, nearby grocery stores, dining, and more. Seller made some worthy upgrades and is offering a home warranty!
Key facts
- $398 HOA
- Built 1950
- Listed 11 days
Neighborhood map
What this means for you Summary
Snapshot
- This is a 2-bed/1.0-bath condo listed at $130k.
Deal economics
- At list price, monthly cash flow is $34 ($402/yr) — positive.
- The deal already cash-flows at list — no discount required.
- Meets the 1% rule at list price ($2k rent vs $130k).
- Cap rate 6.6% vs local median 4.5% in Hillcrest Heights — top-decile yield for the area; either an underpriced asset or a hidden risk that comps aren't pricing in. Stress-test before assuming the spread holds.
Location & tenants
- Location reads 77/100 on livability (#79 in MD, #2,942 nationally) — a middle-class / working-renter tenant base. Strengths: commute A+, housing A+, employment B+; Watch: health & safety C-, crime F, amenities F.
- Prince George'S County Public Schools (suburban): math 8% / reading 24% proficiency, ranked #21 of 24 in MD (top 88%) — low school quality limits family demand, transient renter base, plan for 1-2y turnover.
- Zoned schools: Hillcrest Heights Elementary (math 2% / reading 2%, grade F, #826 of 860 statewide, top 100%, 406 students, 66% FRL); Benjamin Stoddert Middle (math 0% / reading 19%, grade F, #210 of 225 statewide, top 93%, 560 students, 85% FRL); Potomac High (math 8% / reading 27%, grade F, #179 of 222 statewide, top 82%, 1,253 students, 76% FRL) — zoned schools average 76% FRL vs 53% district-wide (23 pts higher); higher-poverty schools than district average — tighter screening recommended.
- Market conditions: Rents soft (-2.9%/yr); 140 active listings in the ZIP; 40 comparable units currently listed for rent nearby; rentals leasing fast (median 7d on market — plan ~1-2 weeks tenant-placement turnaround); solid renter incomes; 1,481 units permitted in Prince George's County in 2024 (0 in 5+ unit buildings).
Forward outlook
- Local home prices are declining (-3.0%/yr); year-one equity from $899 of loan paydown is wiped out by about $4k of value loss. Plan a longer hold.
- Prince George's County population projected at +18% by 2050 — long-run rental-demand tailwind backs the buy-and-hold thesis.
Negotiation context
- Only 11 days on market — expect competitive offers; lowballing is unlikely to land.
Risks & watch-outs
- Watch-outs: HOA is 24% of rent; built in 1950 — expect roof / HVAC / electrical / plumbing capex.
- Climate carrying-cost: extreme-heat days projected 7→16/yr by 2055 (HVAC capex compounding) — expect insurance premiums to compound above CPI over the hold.
Questions for the listing agent
- Built in 1950 — when were the roof, HVAC, electrical panel, plumbing, and water heater last replaced?
- What does the HOA fee cover, when was the last increase, and are there any pending special assessments or reserve-fund shortfalls?
- Any open or pending special assessments — roof, HVAC, plumbing, elevator, façade? What's the per-unit balance and payoff schedule, and is the seller paying it off at close or rolling it to the buyer?
- Is there a deadline driving the sale (1031 exchange, divorce, estate, relocation)? That informs how much negotiation room exists.
- Schools are B-rated — typically a magnet for longer-tenancy family renters. What's the average tenant stay here, and is there a school-zone premium baked into asking?
- Crime grade is F in this area — have there been break-ins, vandalism, or insurance claims at this property in the last 3 years? What carrier currently insures it and at what premium?
- The area grade is low — what's the realistic commute time and amenity access for the typical tenant pool here? Any planned neighborhood developments (good or bad) we should know about?
- What's the average days-on-market for RENTAL listings here right now (not sales)? A rising rental-DOM trend means longer vacancies and softer asking-rent achievability than the comps imply.
- What's the recent tenant-quality profile in this submarket — average credit score on applications, eviction rate, late-payment / NSF rate, and stable-employment percentage? A property-management company in the area should have these aggregated.
- How much new apartment / multifamily construction is in the pipeline within 1–3 miles? Heavy new supply (>2% of stock underway) typically softens rents 12–24 months out; light construction supports rent growth.
Investment metrics
- 1% rule
- 1.29% ✓
- Cap rate
- 6.60%
- Cash-on-cash
- 1.11%
- DSCR
- 1.05
- GRM
- 6.5
CMA / ARV
No comps found within radius.
Projected returns pro-forma
-3.0% appreciation · 0.0% rent growth · sell at horizon
- IRR
- -19.2%
- Equity multiple
- 0.35×
- Total profit
- $-23,582
- Equity at exit
- $19,383
- IRR
- -25.0%
- Equity multiple
- 0.02×
- Total profit
- $-35,710
- Equity at exit
- $11,240
Cash invested: $36,400 (down + closing). Projections, not guarantees.
Landlord ↔ Tenant lean methodology
- Overall (STATE)
- 27 Tenant-Leaning
- State Maryland
- 27 Tenant-Leaning · D+14
- County
- — inherits STATE
- City
- — inherits STATE
ZIP-level market 20748
- Rents YoY
- -2.9%
- Active inventory
- 140
- Price-to-rent
- 6.5×
Monthly cashflow live
- Estimated rent
- $1,679 high interval (Pro) →
- Mortgage (P&I)
- −$682
- Tax from tax record
- −$159 /mo · $1,906/yr
- Insurance
- −$54
- HOA
- −$398
- Vacancy / Maint / Mgmt
- −$353
- Net cashflow
- $34
Break-even live
Sensitivity live
| Price | -10% $107 | -5% $70 | +0% $34 | +5% $-3 | +10% $-40 |
|---|---|---|---|---|---|
| Rent | -10% $-99 | -5% $-33 | +0% $34 | +5% $100 | +10% $166 |
| Rate | -1.0pp $99 | -0.5pp $67 | base $34 | +0.5pp $0 | +1.0pp $-34 |
UW: 25.0% down · 7.5% · 30yr · 1.5% tax · 5.0% vac · 8.0% maint · 8.0% mgmt
Financing live
Cash to close
- Down payment
- $32,500
- Closing costs
- $3,900
- Reserves months
- —
- Total cash needed
- —
Loan-product check · same deal, 3 products live
Conventional
25% down · 7.5% · 30yr
- Down + closing
- —
- Monthly P&I
- —
- Monthly cashflow
- —
- DSCR
- —
- Eligible?
- —
Personal DTI + credit; lowest rate.
DSCR
20% down · 8.5% · 30yr
- Down + closing
- —
- Monthly P&I
- —
- Monthly cashflow
- —
- DSCR
- —
- Eligible?
- —
No personal income docs; deal must DSCR.
Hard money
10% down · 12.0% · 12mo
- Down + closing
- —
- Monthly P&I
- —
- Monthly cashflow
- —
- DSCR
- —
- Eligible?
- —
Short-term bridge; refi at stabilization.
Rent comps 40 comps
| Address | Beds | Baths | Sqft | Rent | $/sqft | DOM | Units | Dist |
|---|---|---|---|---|---|---|---|---|
| 2772 Iverson St #81 Temple Hills, MD | 2.0 | 1.0 | 768 | $1,650 | $2.15 | 1d | 1 | 0.07mi |
| 3840 28th Ave Hillcrest Heights, MD | 2.0 | 1.0 | 768 | $1,745 | $2.27 | 1d | 1 | 0.12mi |
| 3827 28th Ave #23 Temple Hills, MD | 2.0 | 1.0 | 768 | $1,695 | $2.21 | 5d | 1 | 0.13mi |
| 2816 Keating St #164 Temple Hills, MD | 2.0 | 1.0 | 768 | $1,500 | $1.95 | 26d | 1 | 0.14mi |
| 3846 26th Ave Temple Hills, MD | 2.0 | 1.5 | 710 | $1,875 | $2.64 | 46d | 1 | 0.17mi |
| 3840 26th Ave Temple Hills, MD | 2.0 | 1.0 | 710 | $1,700 | $2.39 | 19d | 1 | 0.17mi |
| 3861 26th Ave Temple Hills, MD | 2.0 | 1.0 | 768 | $1,700 | $2.21 | 26d | 1 | 0.20mi |
| 3861 26th Ave Temple Hills, MD | 2.0 | 1.0 | 768 | $1,700 | $2.21 | 7d | 1 | 0.20mi |
| 3841 26th Ave Temple Hills, MD | 2.0 | 1.0 | 768 | $1,725 | $2.25 | 1d | 1 | 0.23mi |
| 2528 Iverson St Temple Hills, MD | 2.0 | 1.0 | 768 | $1,675 | $2.18 | 13d | 1 | 0.28mi |
| 2900 Saint Clair Dr Temple Hills, MD | 1.0–2.0 | 1.0 | 765 | $1,425 | $1.86 | 20d | 1 | 0.29mi |
| 3909 25th Ave Hillcrest Heights, MD | 2.0 | 1.0 | 768 | $1,500 | $1.95 | 6d | 1 | 0.33mi |
| 3903 25th Ave Hillcrest Heights, MD | 2.0 | 1.0 | 768 | $1,500 | $1.95 | 6d | 1 | 0.33mi |
| 4003 25th Ave Temple Hills, MD | 2.0 | 1.0 | 792 | $1,795 | $2.27 | 15d | 1 | 0.34mi |
| 3843 St Barnabas Rd Apt 104 Suitland, MD | 2.0 | 2.0 | 998 | $1,750 | $1.75 | 7d | 1 | 0.42mi |
| 3827 Saint Barnabas Rd Unit T103 Suitland, MD | 2.0 | 1.0 | 979 | $1,800 | $1.84 | 17d | 1 | 0.46mi |
| 3807 St Barnabas Rd #104 Suitland, MD | 2.0 | 1.0 | 1000 | $1,999 | $2.00 | 46d | 1 | 0.50mi |
| 3851 St Barnabas Rd Apt 201 Suitland, MD | 2.0 | 1.0 | 1000 | $2,295 | $2.29 | 7d | 1 | 0.53mi |
| 3825 Saint Barnabas Rd Unit T-202 Suitland, MD | 2.0 | 1.0 | 1034 | $1,800 | $1.74 | 46d | 1 | 0.54mi |
| 3827 St Barnabas Rd Unit T Suitland, MD | 2.0 | 1.0 | 992 | $1,600 | $1.61 | 5d | 1 | 0.54mi |
| 4129 Atmore Pl Temple Hills, MD | 1.0 | 1.0 | 610 | $1,500 | $2.46 | 46d | 1 | 0.55mi |
| 4221 28th Ave Marlow Heights, MD | 1.0–2.0 | 1.0 | 698 | $1,300 | $1.86 | 46d | 1 | 0.57mi |
| 3416 Curtis Dr Suitland, MD | 1.0–3.0 | 1.0–1.5 | 779 | $1,603 | $2.06 | 1d | 25 | 0.59mi |
| 3613 Silver Park Dr Suitland, MD | 1.0–3.0 | 1.0–2.0 | 1087 | $1,895 | $1.74 | 5d | 10 | 0.65mi |
| 4301 23rd Pkwy Temple Hills, MD | 3.0 | 1.0–2.0 | 850 | $1,741 | $2.05 | 0d | 17 | 0.74mi |
| 3103 Good Hope Ave Hillcrest Heights, MD | 3.0 | 1.0–2.0 | 851 | $2,303 | $2.71 | 1d | 13 | 0.74mi |
| 3501 Terrace Dr Hillcrest Heights, MD | 1.0–2.0 | 1.0 | 800 | $1,678 | $2.10 | 1d | 16 | 0.76mi |
| 2309 Olson St #203 Temple Hills, MD | 1.0 | 1.0 | 948 | $1,695 | $1.79 | 7d | 1 | 0.76mi |
| 3506 Silver Park Dr Suitland, MD | 1.0–2.0 | 1.0 | 949 | $1,944 | $2.05 | 1d | 9 | 0.79mi |
| 4503 Raleigh Rd Temple Hills, MD | 3.0 | 1.0 | 1040 | $1,895 | $1.82 | 46d | 1 | 0.80mi |
| 4513 23rd Pkwy Temple Hills, MD | 1.0–2.0 | 1.0 | 908 | $1,880 | $2.07 | 1d | 11 | 0.81mi |
| 4431 23rd Pkwy Temple Hills, MD | 1.0–2.0 | 1.0 | 775 | $1,600 | $2.06 | 1d | 11 | 0.82mi |
| 4637 Dallas Pl Temple Hills, MD | 1.0–2.0 | 1.0 | 838 | $1,519 | $1.81 | 0d | 27 | 0.84mi |
| 3009 Southern Ave SE Temple Hills, MD | 3.0 | 1.0 | 909 | $1,650 | $1.82 | 46d | 1 | 1.06mi |
| 2603 Southern Ave SE Hillcrest Heights, MD | 1.0–2.0 | 1.0 | 646 | $1,375 | $2.13 | 3d | 7 | 1.08mi |
| 3001 Branch Ave Temple Hills, MD | 2.0 | 1.0 | 769 | $2,043 | $2.66 | 1d | 40 | 1.10mi |
| 3415 Parkway Terrace Dr Hillcrest Heights, MD | 1.0–2.0 | 1.0 | 730 | $1,680 | $2.30 | 46d | 1 | 1.10mi |
| 3158 Buena Vista Ter SE Unit 1 Washington, DC | 3.0 | 1.0 | 800 | $2,900 | $3.62 | 26d | 1 | 1.14mi |
| 3111 Naylor Rd SE #301 Washington, DC | 1.0 | 1.0 | 800 | $1,350 | $1.69 | 26d | 1 | 1.16mi |
| 3109 Naylor Rd SE Washington, DC | 2.0 | 1.0 | 655 | $1,904 | $2.91 | 9d | 1 | 1.17mi |
HOA detail condo
- Monthly dues
- $398 · $4,776/yr
- Assessments
- None detected in remarks — confirm with the listing agent.
Listing history 6 events
-
2026-02-23status Pending
-
2026-02-13$129,999 Active
-
2026-02-10historical $129,999
-
2006-03-20soldstatus $243,000
-
2006-02-01soldstatus $125,000
-
1973-09-24soldstatus $18,450
ⓘ Source: listings_history table (triggers on properties + properties_extension) + one-shot
backfill from property_details.listing_events for pre-trigger history.
Tax reassessment forecast MD · Partial reset (capped growth)
- Current annual tax
- $1,906 · $159/mo
- Projected year-2 tax
- $1,906 · $159/mo
- Expected delta
- $0/yr ($0/mo · 0.0%)
ⓘ Screening estimate from a state-policy table — verify with the county assessor before closing.
Climate risk First Street
- Flood 1/10 Low FEMA zone X (unshaded) · 0% chance over 30 yrs
- Wildfire 1/10 Low
- Heat 7/10 Severe 7 d/yr ≥103°F today · 16 d/yr by 30 yrs out
- Wind 4/10 Moderate 20% chance of damaging wind over 30 yrs
- Air quality 3/10 Moderate 2 unhealthy d/yr today · 3 by 30 yrs out
Nearby sold comps map
Loading sold comps map…
Walkable amenities ~0.75 mi
Loading nearby amenities…
Taxation est. · year 1
- Rental income
- $20,145
- − Mortgage interest
- −$7,282
- − Property taxes
- −$1,906
- − Insurance
- −$650
- − Repairs & maintenance
- −$1,612
- − Management
- −$1,612
- − HOA
- −$4,776
- − Depreciation
- −$3,782
- Taxable loss
- −$1,473
- Est. tax savings @ 24.0%
- +$354
- After-tax cash flow
- $756/yr
For passive investors: Depreciation is non-cash, so a rental often shows a tax loss while cash-flowing — sheltering income. Rental losses are passive: they offset passive income freely, and up to $25,000/yr can offset ordinary (W-2) income if you actively participate and your MAGI is under $100k (phasing out to $0 by $150k); unused losses carry forward. On sale, claimed depreciation is recaptured at up to 25%, and gains may owe capital-gains tax (a 1031 exchange can defer both). Figures are a year-1 estimate at your 24.0% rate — not tax advice; consult a CPA.
Schools (NCES district)
- District
- Prince George'S County Public Schools
- NCES district ID
- 2400510
- Math proficiency
- 8% ▼ -11.00%
- Reading proficiency
- 24% ▼ -9.00%
- Median HH income
- $73,967
- Composite
- 16.82/100
- National rank
- #9151
- State rank
- #21 of 24 in MD
Livability — Hillcrest Heights
- Score
- 77/100
- State rank
- #79
- US rank
- #2942
Category grades
Schools grade is shown separately in the Schools card above.
Census & demographics
- Census place
- Hillcrest Heights, MD
- County
- Prince Georges County · 919,866 people
- Metro
- Washington-Arlington-Alexandria, DC-VA-MD-WV
- Population (ZIP)
- 40,338
- Household income
- $83,162
- Rent vs Own
- Severe rent burden
- 1929.0
Population outlook (Prince George's County) Hauer SSP2
- Today (2025)
- 1,005,426 people
- By 2030
- 1,048,416 · +4.3%
- By 2040
- 1,123,425 · +11.7%
- By 2050
- 1,183,220 · +17.7%
- By 2075
- 1,306,202 · +29.9%
- By 2100
- 1,408,179 · +40.1%
Race, ethnicity, and origin ACS 2023
- Neighborhood character
- Predominantly Black (81%)
- Race & ethnicity
- Black 81% Hispanic / Latino 11% White 5% Two or more races 4% Asian 1%
- Hispanic origin (detail)
- Mexican 3%
- Foreign-born
- 10% · Canada
- Languages at home
- 87% English-only · Spanish 10% French/Haitian/Cajun 1% Tagalog/Filipino 1%
Political lean MEDSL · Prince George's
- 2024 margin
- Solid D (+75.2) · D 86.3% · R 11.2% · Other 2.5%
- 2008→2024 swing
- -3.3pp toward R · 2008: 78.5pp · 2024: 75.2pp
- All cycles
- 2024: D+75.2 2020: D+80.5 2016: D+81.0 2012: D+80.9 2008: D+78.5
Not yet ingested
- Civics
- —
Market trends
- HPI YoY
- ▼ -215.06%
- Current HPI
- 307.2658
- Rent YoY
- ▼ -2.87%
- Metro
- Washington-Arlington-Alexandria, DC-VA-MD-WV
- State GDP YoY
- ▲ 2.97%
- F500 in state
- 12
Industry mix (Fortune 500 HQ in MD)
| Industry | F500 HQs | Revenue |
|---|---|---|
| Aerospace / Defense | 1 | $71B |
|
||
| Utilities | 1 | $25B |
|
||
| Hotels | 1 | $24B |
|
||
| Consumer Goods | 1 | $7B |
|
||
| Real Estate | 1 | $6B |
|
||
| Chemicals | 1 | $2B |
|
||
Price history
+604.6% since first listed6 events — show timeline
- 2026-02-23 Pending — BRIGHT MLS
- 2026-02-13 Listed $129,999 BRIGHT MLS
- 2026-02-10 Coming Soon $129,999 BRIGHT MLS
- 2006-03-20 Sold (Public Records) $243,000 Public Records
- 2006-02-01 Sold (Public Records) $125,000 Public Records
- 1973-09-24 Sold (Public Records) $18,450 Public Records
Property tax history
+3.3%/yrLatest (2025): $1,906 · +11.7% YoY. Source: county tax records.
Cash-flow waterfall
monthlySold comps — $/sqft
last 12 mo · ≤1 miLoading sold comps…