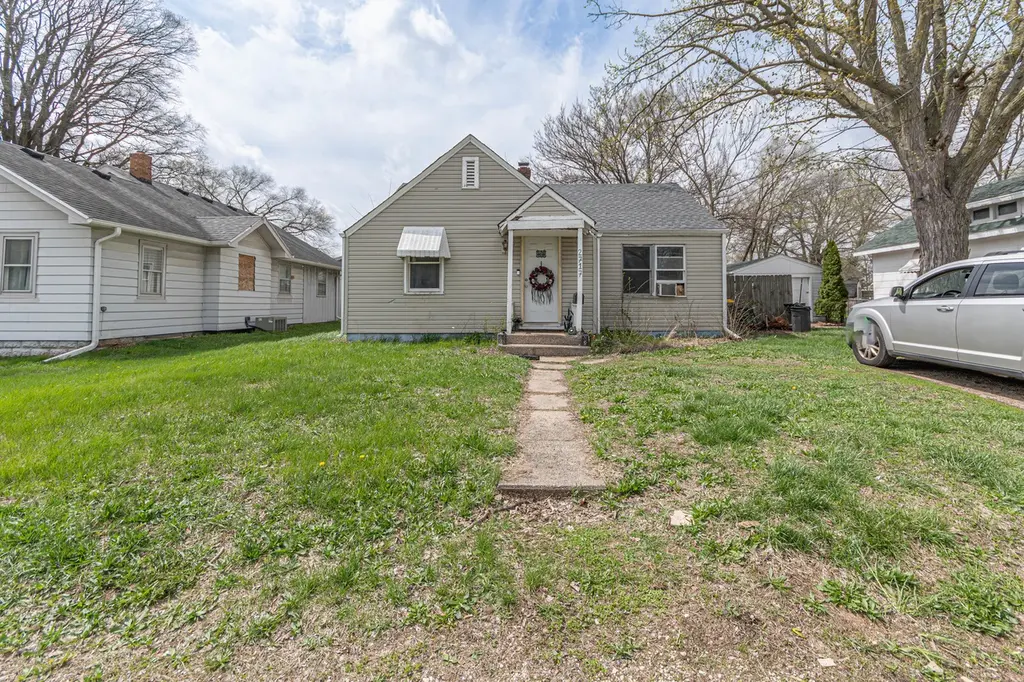
2717 Kinsey St · Rockford, IL
Flood risk 1/10 · Minimal
- FEMA flood zone
- X (unshaded)
- Chance of flooding over 30 yrs
- 0.0%
- Est. flood insurance / yr
- $473 – $860
Fire risk 1/10 · Minimal
- Est. fire insurance / yr
- $804 – $1,492
Heat risk 3/10 · Minor
- Hot days now (above 101°F)
- 7 days/yr
- Hot days in 30 yrs
- 15 days/yr
Wind risk 2/10 · Minimal
- Chance of severe wind over 30 yrs
- —
Air-quality risk 2/10 · Minimal
- Unhealthy air days now
- 1 days/yr
- Unhealthy air days in 30 yrs
- 2 days/yr
Risk factors via First Street. Map © Google.
Why this score? — see what drove the C- grade
The composite is a weighted blend of 9 inputs, each scored 0–100. Each bar is that input's sub-score; the figure is the points it added to the 100-point composite (weight × sub-score).
- Cash flow +24.9/30.0
- DSCR +8.1/10.0
- 1% rule +7.6/10.0
- ARV discount +3.9/15.0
- Livability +3.1/5.0
- Rent growth +2.5/5.0
- Condition / age +2.5/5.0
- Schools +1.2/10.0
- Appreciation +0.0/10.0
$84,900
🖨 Deal sheet 📄 Offer letter ✓ Due diligence
Listing remarks MLS
Investment Opportunity: 2-bedroom, 1-bath home currently tenant-occupied on a month-to-month lease, generating $900/month with tenant paying all utilities. Offers a strong value-add opportunity with potential for cosmetic improvements. Features include a 1-car garage and functional living space. Ideal for investors seeking immediate cash flow with upside potential. Great starter home as well.
Key facts
- Garage
- Built 1940
- Listed 26 days
Property features AI
Finance
- Other: Property located in Rockford corporate limits; Directions: Southeast of Harrison Ave & 11th St
- HOA & community: No master association fee required
Exterior
- Parking: Detached garage (1 garage space, 1 total parking space)
- Utilities: Public sewer
- Home design: Detached single-family home; One-story; Fee simple ownership; Estimated living area; Built before 1978
- Construction: Vinyl siding exterior
- Exterior features: Lot dimensions roughly 50 x 50 x 127 x 127; Lot under 0.25 acre
Interior
- Kitchen: Kitchen on main level (approx. 10 x 15)
- Bedrooms: 2 bedrooms; Master bedroom on main level (approx. 10 x 10); Additional bedroom on main level (approx. 10 x 10)
- Bathrooms: 1 full bathroom
- Heating & cooling: Natural gas heating
- Interior features: Unfinished full basement; 4 total rooms
- Laundry & utility: Laundry room
Neighborhood map
What this means for you Summary
Snapshot
- This is a 2-bed/1.0-bath single-family listed at $85k.
Deal economics
- At list price, monthly cash flow is $182 ($2k/yr) — positive.
- The deal already cash-flows at list — no discount required.
- Meets the 1% rule at list price ($1k rent vs $85k).
- Recommended offer: $84k (1.5% below list) — sets the bar for market timing.
- Cap rate 8.9% vs local median 6.1% in Rockford — top-decile yield for the area; either an underpriced asset or a hidden risk that comps aren't pricing in. Stress-test before assuming the spread holds.
Location & tenants
- Location reads 62/100 on livability (#876 in IL) — a middle-class / working-renter tenant base. Strengths: cost of living A+, housing A+, health & safety A+; Watch: schools F, crime F, amenities F.
- Rockford SD 205 (urban): math 12% / reading 16% proficiency, ranked #533 of 620 in IL (top 86%) — low school quality limits family demand, transient renter base, plan for 1-2y turnover; 73% free/reduced lunch — lower-income household profile, screen leases tightly.
- Market conditions: 84 active listings in the ZIP; 13 comparable units currently listed for rent nearby; rentals lingering (median 44d on market — plan ~5-8 weeks vacancy on turnover, expect pricing pressure); 77% of comp listings sitting > 30 days — soft ceiling on asking rent; 285 units permitted in Winnebago County in 2024 (0 in 5+ unit buildings).
Forward outlook
- Local home prices are declining (-3.0%/yr); year-one equity from $587 of loan paydown is wiped out by about $3k of value loss. Plan a longer hold.
- Winnebago County population projected at -20% by 2050 — secular population decline; favor cash flow + early exit over multi-decade hold.
Negotiation context
- It's been on market 26 days — a 2% lower offer ($84k) is reasonable based on typical stale-listing flexibility.
- 4 sale attempts since 9y ago with the ask held roughly flat each time — persistent listings suggest the price (not the market) is what's stuck; bring a comps-based counter.
- Current owner paid $72k; 18% above their basis — modest negotiation headroom, anchor on the comps not their cost.
Risks & watch-outs
- Watch-outs: property tax is 2.5% of price; built in 1940 — expect roof / HVAC / electrical / plumbing capex.
Questions for the listing agent
- Built in 1940 — when were the roof, HVAC, electrical panel, plumbing, and water heater last replaced?
- Property tax is high relative to price — has the assessment been appealed recently, and will the sale trigger a re-assessment?
- Is there a deadline driving the sale (1031 exchange, divorce, estate, relocation)? That informs how much negotiation room exists.
- Schools are F-rated, which usually means shorter tenancies and higher turnover. Who's the typical renter profile here, and what's been the actual vacancy rate?
- Crime grade is F in this area — have there been break-ins, vandalism, or insurance claims at this property in the last 3 years? What carrier currently insures it and at what premium?
- What's the average days-on-market for RENTAL listings here right now (not sales)? A rising rental-DOM trend means longer vacancies and softer asking-rent achievability than the comps imply.
- What's the recent tenant-quality profile in this submarket — average credit score on applications, eviction rate, late-payment / NSF rate, and stable-employment percentage? A property-management company in the area should have these aggregated.
- How much new for-sale + rental construction is in the pipeline within 1–3 miles? Heavy new supply typically softens prices + rents 12–24 months out; constrained supply supports both.
Investment metrics
- 1% rule
- 1.26% ✓
- Cap rate
- 8.87%
- Cash-on-cash
- 9.21%
- DSCR
- 1.41
- GRM
- 6.6
CMA / ARV
- ARV (median comp)
- $78,617
- List price
- $84,900
- Delta
- 7.99%
- Verdict
- FAIR
- Comps
- 20 within 1.0 mi
Show comp detail 12 sales within ~0.75 mi
| Address | Dist | Beds/Ba | Sqft | Sold | Price | $/sf | Match |
|---|---|---|---|---|---|---|---|
| 2930 11th St | 0.28mi | 2/1.0 | 832 (+1%) | 1mo | $120,000 | $144 | 84 |
| 2837 10th St | 0.26mi | 2/1.0 | 816 (-1%) | 5mo | $30,000 | $37 | 82 |
| 2822 Sewell St | 0.27mi | 1/1.0 (-1) | 850 (+3%) | 7mo | $74,900 | $88 | 71 |
| 1742 Pershing Ave | 0.47mi | 2/1.0 | 780 (-5%) | 6mo | $95,000 | $122 | 64 |
| 2817 9th St | 0.34mi | 3/2.0 (+1) | 874 (+6%) | 1mo | $149,900 | $172 | 64 |
| 3129 Lapey St | 0.55mi | 2/1.0 | 776 (-6%) | 3mo | $80,000 | $103 | 62 |
| 1733 Pershing Ave | 0.49mi | 2/1.0 | 792 (-4%) | 12mo | $82,000 | $104 | 61 |
| 2846 8th St | 0.46mi | 3/1.0 (+1) | 805 (-2%) | 12mo | $127,500 | $158 | 60 |
| 3016 7th St | 0.65mi | 3/1.0 (+1) | 836 (+2%) | 4mo | $128,000 | $153 | 59 |
| 2641 Marshall St | 0.28mi | 2/1.0 | 720 (-12%) | 15mo | $55,000 | $76 | 54 |
| 3110 Horton St | 0.59mi | 3/1.0 (+1) | 914 (+11%) | 11mo | $117,000 | $128 | 39 |
| 3138 Horton St | 0.65mi | 3/1.0 (+1) | 912 (+11%) | 18mo | $55,000 | $60 | 32 |
Match score weights: distance 35% · size 25% · config 20% · recency 20%. Top-matched comps best support the ARV.
Projected returns pro-forma
-3.0% appreciation · 3.0% rent growth · sell at horizon
- IRR
- -2.3%
- Equity multiple
- 0.91×
- Total profit
- $-2,081
- Equity at exit
- $12,659
- IRR
- 7.4%
- Equity multiple
- 1.56×
- Total profit
- $13,393
- Equity at exit
- $7,341
Cash invested: $23,772 (down + closing). Projections, not guarantees.
Landlord ↔ Tenant lean methodology
- Overall (STATE)
- 43 Moderately Tenant-Leaning
- State Illinois
- 43 Moderately Tenant-Leaning · D+7
- County
- — inherits STATE
- City
- — inherits STATE
ZIP-level market 61109
- Home prices YoY
- -19.7%
- Active inventory
- 84
- Price-to-rent
- 6.6×
Monthly cashflow live
- Estimated rent
- $1,067 high interval (Pro) →
- Mortgage (P&I)
- −$445
- Tax from tax record
- −$180 /mo · $2,158/yr
- Insurance
- −$35
- HOA
- −$0
- Vacancy / Maint / Mgmt
- −$224
- Net cashflow
- $182
Break-even live
UW: 25.0% down · 7.5% · 30yr · 1.5% tax · 5.0% vac · 8.0% maint · 8.0% mgmt
Financing live
Cash to close
- Down payment
- $21,225
- Closing costs
- $2,547
- Reserves months
- —
- Total cash needed
- —
Loan-product check · same deal, 3 products live
Conventional
25% down · 7.5% · 30yr
- Down + closing
- —
- Monthly P&I
- —
- Monthly cashflow
- —
- DSCR
- —
- Eligible?
- —
Personal DTI + credit; lowest rate.
DSCR
20% down · 8.5% · 30yr
- Down + closing
- —
- Monthly P&I
- —
- Monthly cashflow
- —
- DSCR
- —
- Eligible?
- —
No personal income docs; deal must DSCR.
Hard money
10% down · 12.0% · 12mo
- Down + closing
- —
- Monthly P&I
- —
- Monthly cashflow
- —
- DSCR
- —
- Eligible?
- —
Short-term bridge; refi at stabilization.
Rent comps 13 comps
| Address | Beds | Baths | Sqft | Rent | $/sqft | DOM | Units | Dist |
|---|---|---|---|---|---|---|---|---|
| 2846 Lapey St Rockford, IL | 1.0 | 1.0 | 700 | $800 | $1.14 | 43d | 1 | 0.20mi |
| 1418 22nd Ave Rockford, IL | 2.0 | 1.0 | 950 | $1,200 | $1.26 | 43d | 1 | 0.56mi |
| 1420 22nd Ave Rockford, IL | 2.0 | 1.0 | 950 | $1,200 | $1.26 | 43d | 1 | 0.56mi |
| 1211 21st Pl Rockford, IL | 2.0 | 1.0 | 1040 | $1,350 | $1.30 | 43d | 1 | 0.69mi |
| 1209 21st Pl Rockford, IL | 2.0 | 1.0 | 1040 | $1,350 | $1.30 | 43d | 1 | 0.69mi |
| 914 18th Ave Rockford, IL | 2.0 | 1.0 | 1123 | $900 | $0.80 | 43d | 1 | 1.09mi |
| 2010 Kishwaukee St Unit 20102-N Rockford, IL | 1.0 | 1.0 | 1000 | $875 | $0.88 | 43d | 1 | 1.12mi |
| 1524 Broadway Unit 1526-8 Rockford, IL | 1.0 | 1.0 | 700 | $850 | $1.21 | 43d | 1 | 1.21mi |
| 1530 Broadway Unit 1532-1 Rockford, IL | 1.0 | 1.0 | 700 | $875 | $1.25 | 21d | 1 | 1.22mi |
| 810 15th Ave Unit 810-1 Rockford, IL | 2.0 | 1.0 | 1000 | $995 | $0.99 | 43d | 1 | 1.33mi |
| 810 15th Ave Unit 810-3 Rockford, IL | 2.0 | 1.0 | 1000 | $995 | $0.99 | 21d | 1 | 1.33mi |
| 611 15th Ave Unit 2 Rockford, IL | 2.0 | 1.0 | 806 | $1,350 | $1.67 | 43d | 1 | 1.41mi |
| 2208 Christina St Rockford, IL | 2.0 | 1.0 | 700 | $1,300 | $1.86 | 21d | 1 | 1.50mi |
Listing history 12 events
-
2026-05-14status Pending 395-char remark
Show marketing remark (395 chars)
Investment Opportunity: 2-bedroom, 1-bath home currently tenant-occupied on a month-to-month lease, generating $900/month with tenant paying all utilities. Offers a strong value-add opportunity with potential for cosmetic improvements. Features include a 1-car garage and functional living space. Ideal for investors seeking immediate cash flow with upside potential. Great starter home as well.
-
2026-04-25$84,900 Active
-
2026-04-20$84,900 Active 395-char remark
Show marketing remark (395 chars)
Investment Opportunity: 2-bedroom, 1-bath home currently tenant-occupied on a month-to-month lease, generating $900/month with tenant paying all utilities. Offers a strong value-add opportunity with potential for cosmetic improvements. Features include a 1-car garage and functional living space. Ideal for investors seeking immediate cash flow with upside potential. Great starter home as well.
-
2024-12-26soldstatus $72,000
-
2017-10-11status Pending
Show marketing remark (236 chars)
Step-saver ranch, cheaper than rent and close to shopping and bus route! Ceramic entry; some wood laminate flooring; two bedrooms; full basement; low-maintenance exterior; two-car detached garage. This is a Fannie Mae HomePath property.
-
2017-09-29soldstatus $17,000 Closed Sale
Show marketing remark (236 chars)
Step-saver ranch, cheaper than rent and close to shopping and bus route! Ceramic entry; some wood laminate flooring; two bedrooms; full basement; low-maintenance exterior; two-car detached garage. This is a Fannie Mae HomePath property.
-
2017-09-29soldstatus $17,000
Show marketing remark (236 chars)
Step-saver ranch, cheaper than rent and close to shopping and bus route! Ceramic entry; some wood laminate flooring; two bedrooms; full basement; low-maintenance exterior; two-car detached garage. This is a Fannie Mae HomePath property.
-
2017-08-31price $19,900
Show marketing remark (236 chars)
Step-saver ranch, cheaper than rent and close to shopping and bus route! Ceramic entry; some wood laminate flooring; two bedrooms; full basement; low-maintenance exterior; two-car detached garage. This is a Fannie Mae HomePath property.
-
2017-07-31price $24,500
Show marketing remark (236 chars)
Step-saver ranch, cheaper than rent and close to shopping and bus route! Ceramic entry; some wood laminate flooring; two bedrooms; full basement; low-maintenance exterior; two-car detached garage. This is a Fannie Mae HomePath property.
-
2017-07-03$27,500 New
Show marketing remark (236 chars)
Step-saver ranch, cheaper than rent and close to shopping and bus route! Ceramic entry; some wood laminate flooring; two bedrooms; full basement; low-maintenance exterior; two-car detached garage. This is a Fannie Mae HomePath property.
-
2017-06-29$19,900
-
2000-04-05soldstatus $49,000
ⓘ Source: listings_history table (triggers on properties + properties_extension) + one-shot
backfill from property_details.listing_events for pre-trigger history.
Tax reassessment forecast IL · Partial reset (capped growth)
- Current annual tax
- $2,158 · $180/mo
- Projected year-2 tax
- $2,158 · $180/mo
- Expected delta
- $0/yr ($0/mo · 0.0%)
ⓘ Screening estimate from a state-policy table — verify with the county assessor before closing.
Climate risk First Street
- Flood 1/10 Low FEMA zone X (unshaded) · 0% chance over 30 yrs
- Wildfire 1/10 Low
- Heat 3/10 Moderate 7 d/yr ≥101°F today · 15 d/yr by 30 yrs out
- Wind 2/10 Low
- Air quality 2/10 Low 1 unhealthy d/yr today · 2 by 30 yrs out
Nearby sold comps map
Loading sold comps map…
Walkable amenities ~0.75 mi
Loading nearby amenities…
Taxation est. · year 1
- Rental income
- $12,802
- − Mortgage interest
- −$4,756
- − Property taxes
- −$2,158
- − Insurance
- −$424
- − Repairs & maintenance
- −$1,024
- − Management
- −$1,024
- − Depreciation
- −$2,470
- Taxable income
- $946
- Est. tax owed @ 24.0%
- −$227
- After-tax cash flow
- $1,961/yr
For passive investors: Depreciation is non-cash, so a rental often shows a tax loss while cash-flowing — sheltering income. Rental losses are passive: they offset passive income freely, and up to $25,000/yr can offset ordinary (W-2) income if you actively participate and your MAGI is under $100k (phasing out to $0 by $150k); unused losses carry forward. On sale, claimed depreciation is recaptured at up to 25%, and gains may owe capital-gains tax (a 1031 exchange can defer both). Figures are a year-1 estimate at your 24.0% rate — not tax advice; consult a CPA.
Schools (NCES district)
- District
- Rockford SD 205
- NCES district ID
- 1734510
- Math proficiency
- 12% ▼ -2.00%
- Reading proficiency
- 16% ▼ -3.00%
- Median HH income
- $42,533
- Composite
- 12.21/100
- National rank
- #9649
- State rank
- #533 of 620 in IL
Livability — Rockford
- Score
- 62/100
- State rank
- #876
- US rank
- #17035
Category grades
Schools grade is shown separately in the Schools card above.
Census & demographics
- Census place
- Rockford, IL
- County
- Winnebago County · 147,297 people
- City population
- 147,297
- Metro
- Rockford, IL
- Population (ZIP)
- 26,768
- Household income
- $62,973
- Rent vs Own
- Severe rent burden
- 941.0
Population outlook (Winnebago County) Hauer SSP2
- Today (2025)
- 271,080 people
- By 2030
- 260,684 · -3.8%
- By 2040
- 238,405 · -12.1%
- By 2050
- 216,129 · -20.3%
- By 2075
- 172,882 · -36.2%
- By 2100
- 135,336 · -50.1%
Race, ethnicity, and origin ACS 2023
- Neighborhood character
- Diverse neighborhood (Simpson 0.62)
- Race & ethnicity
- White 57% Hispanic / Latino 21% Black 13% Two or more races 11% Asian 5%
- Hispanic origin (detail)
- Mexican 17% Puerto Rican 1%
- Common ancestry
- Romanian 3% Slovak 2% Portuguese 2%
- Foreign-born
- 13% · Canada, Philippines, China
- Languages at home
- 79% English-only · Spanish 16% Other Asian/Pacific 2% Russian/Polish/Slavic 1%
Political lean MEDSL · Winnebago
- 2024 margin
- Toss-up / Even · D 49.5% · R 49.0% · Other 1.5%
- 2008→2024 swing
- -12.2pp toward R · 2008: 12.8pp · 2024: 0.6pp
- All cycles
- 2024: D+0.6 2020: D+2.5 2016: R+1.2 2012: D+5.7 2008: D+12.8
Not yet ingested
- Civics
- —
Market trends
- HPI YoY
- ▼ -72.42%
- Current HPI
- 296.0019
- Rent YoY
- —
- Metro
- Rockford, IL
- State GDP YoY
- ▲ 1.59%
- F500 in state
- 60
Industry mix (Fortune 500 HQ in IL)
| Industry | F500 HQs | Revenue |
|---|---|---|
| Insurance | 4 | $201B |
|
||
| Consumer Goods | 4 | $87B |
|
||
| Industrial Machinery | 3 | $64B |
|
||
| Healthcare | 2 | $55B |
|
||
| Retail / Pharmacy | 1 | $148B |
|
||
| Agriculture / Food | 1 | $86B |
|
||
Price history
+73.3% since first listed13 events — show timeline
- 2026-05-21 Pending — MRED as Distributed by MLS Grid
- 2026-05-14 Pending — NWIAR
- 2026-04-25 Listed $84,900 MRED as Distributed by MLS Grid
- 2026-04-20 Listed $84,900 NWIAR
- 2024-12-26 Sold (Public Records) $72,000 Public Records
- 2017-10-11 Pending — MRED as Distributed by MLS Grid
- 2017-09-29 Sold (MLS) $17,000 MRED as Distributed by MLS Grid
- 2017-09-29 Sold (MLS) $17,000 NWIAR
- 2017-08-31 Price Changed $19,900 MRED as Distributed by MLS Grid
- 2017-07-31 Price Changed $24,500 MRED as Distributed by MLS Grid
- 2017-07-03 Listed $27,500 MRED as Distributed by MLS Grid
- 2017-06-29 Listed $19,900 NWIAR
- 2000-04-05 Sold (Public Records) $49,000 Public Records
Property tax history
+2.0%/yrLatest (2025): $2,158 · +25.5% YoY. Source: county tax records.
Cash-flow waterfall
monthlySold comps — $/sqft
last 12 mo · ≤1 miLoading sold comps…