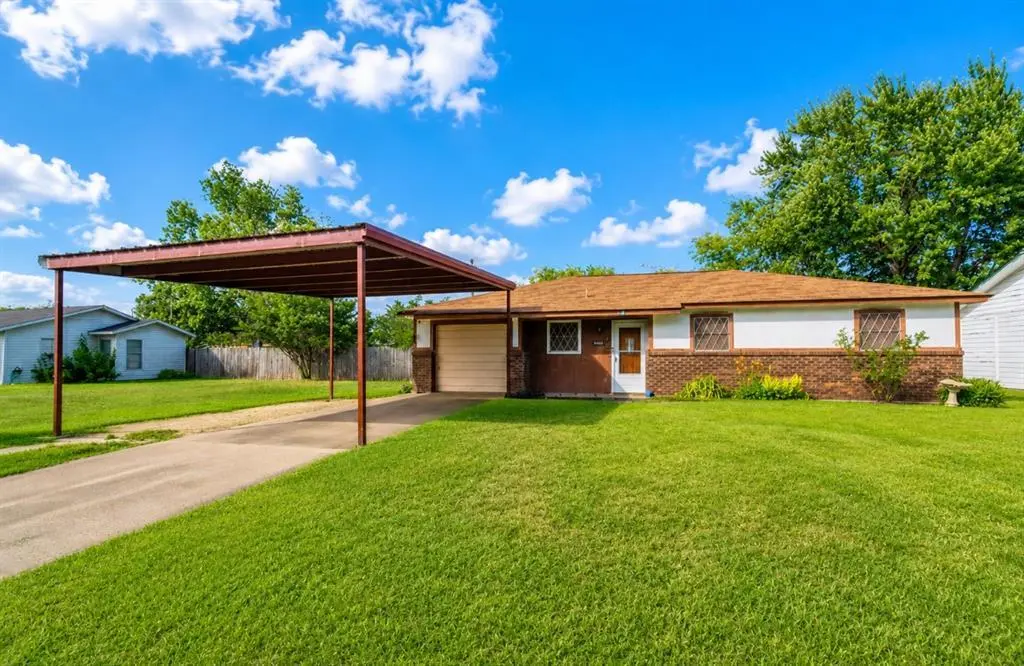
204 N Texas St · Whitney, TX
Flood risk 1/10 · Minimal
- FEMA flood zone
- X (unshaded)
- Chance of flooding over 30 yrs
- 0.0%
- Est. flood insurance / yr
- $507 – $1,088
Fire risk 7/10 · Major
- Est. fire insurance / yr
- $1,222 – $2,270
Heat risk 7/10 · Major
- Hot days now (above 109°F)
- 7 days/yr
- Hot days in 30 yrs
- 25 days/yr
Wind risk 6/10 · Moderate
- Chance of severe wind over 30 yrs
- 27.0%
Air-quality risk 2/10 · Minimal
- Unhealthy air days now
- 1 days/yr
- Unhealthy air days in 30 yrs
- 2 days/yr
Risk factors via First Street. Map © Google.
Why this score? — see what drove the C grade
The composite is a weighted blend of 9 inputs, each scored 0–100. Each bar is that input's sub-score; the figure is the points it added to the 100-point composite (weight × sub-score).
- Cash flow +20.7/30.0
- ARV discount +12.3/15.0
- DSCR +6.6/10.0
- 1% rule +5.5/10.0
- Livability +3.6/5.0
- Schools +3.5/10.0
- Rent growth +2.5/5.0
- Condition / age +2.5/5.0
- Appreciation +0.0/10.0
$145,000
🖨 Deal sheet 📄 Offer letter ✓ Due diligence
Listing remarks
PRICED TO SELL! Opportunities like this are becoming harder to find, especially for a home that may qualify for FHA and VA financing under $150,000. Full of charm, character, and timeless appeal, this well-maintained home offers a wonderful opportunity to add your personal touches while enjoying a property that has been cared for over the years. Featuring 3 bedrooms and 1.5 bathrooms, this inviting home offers comfortable living spaces, a functional layout, and plenty of potential to make it your own. Outside, you’ll find a beautifully maintained fenced yard, providing space for pets, gardening, outdoor entertaining, or simply relaxing. Additional features include a covered carport, s
Key facts
- Fenced yard
- Covered carport
- 0.26 acre lot
Tags
Property features AI
Finance
- Other: TV antenna listed as other equipment
- Financial info: Accepts Cash, Conventional, FHA and VA financing; No second mortgage reported
- HOA & community: No homeowners association
Exterior
- Parking: Attached carport; Carport with space for 2 vehicles; Covered parking for 3 vehicles; Garage (garage faces front); Attached garage with 1 garage space
- Utilities: City water; City sewer; Electricity available; Not in a municipal utility district
- Home design: Single-family residence; One story; Residential property; Not attached to another property; Subdivision: Y Add
- Construction: Brick and wood construction; Composition roof; Slab foundation; Year built not specified
- Exterior features: Covered porch(es); Wood and other fencing
Interior
- Kitchen: No appliances listed
- Bedrooms: 3 bedrooms (primary bedroom on main level)
- Bathrooms: 1 full bathroom; 1 half bathroom
- Heating & cooling: Central heating; Central air conditioning
- Interior features: High-speed internet available; One living area; One dining area; Two total rooms (per listing)
- Laundry & utility: No laundry appliances listed
Neighborhood map
What this means for you Summary
Snapshot
- This is a 3-bed/1.0-bath single-family listed at $145k.
Deal economics
- At list price, monthly cash flow is $197 ($2k/yr) — positive.
- The deal already cash-flows at list — no discount required.
- Meets the 1% rule at list price ($2k rent vs $145k).
- Cap rate 7.9% vs local median 3.0% in Whitney — top-decile yield for the area; either an underpriced asset or a hidden risk that comps aren't pricing in. Stress-test before assuming the spread holds.
Location & tenants
- Location reads 71/100 on livability (#282 in TX) — a middle-class / working-renter tenant base. Strengths: cost of living A+, housing A+, health & safety A-; Watch: amenities F, commute F, employment D-.
- Whitney ISD (rural): math 42% / reading 41% proficiency, ranked #378 of 826 in TX (top 46%) — families likely to look elsewhere, expect single-tenant / working-renter base with shorter leases.
- Zoned schools: Whitney El (393 students, 74% FRL) — zoned schools average 74% FRL vs 55% district-wide (19 pts higher); higher-poverty schools than district average — tighter screening recommended.
- Market conditions: 638 active listings in the ZIP; 3 comparable units currently listed for rent nearby; rentals at typical pace (median 21d on market — plan ~3-4 weeks tenant-placement turnaround); 65 units permitted in Hill County in 2024 (0 in 5+ unit buildings).
Forward outlook
- Local home prices are declining (-3.0%/yr); year-one equity from $1k of loan paydown is wiped out by about $4k of value loss. Plan a longer hold.
- Hill County population projected at -12% by 2050 — secular population decline; favor cash flow + early exit over multi-decade hold.
Negotiation context
- Only 9 days on market — expect competitive offers; lowballing is unlikely to land.
Risks & watch-outs
- Climate carrying-cost: major wind risk, 27% chance of damaging wind over 30y; major wildfire risk; extreme-heat days projected 7→25/yr by 2055 (HVAC capex compounding) — expect insurance premiums to compound above CPI over the hold.
Questions for the listing agent
- Is there a deadline driving the sale (1031 exchange, divorce, estate, relocation)? That informs how much negotiation room exists.
- Schools are D-rated, which usually means shorter tenancies and higher turnover. Who's the typical renter profile here, and what's been the actual vacancy rate?
- What's the average days-on-market for RENTAL listings here right now (not sales)? A rising rental-DOM trend means longer vacancies and softer asking-rent achievability than the comps imply.
- What's the recent tenant-quality profile in this submarket — average credit score on applications, eviction rate, late-payment / NSF rate, and stable-employment percentage? A property-management company in the area should have these aggregated.
- How much new for-sale + rental construction is in the pipeline within 1–3 miles? Heavy new supply typically softens prices + rents 12–24 months out; constrained supply supports both.
Investment metrics
- 1% rule
- 1.05% ✓
- Cap rate
- 7.92%
- Cash-on-cash
- 5.82%
- DSCR
- 1.26
- GRM
- 8.0
CMA / ARV
- ARV (on-the-fly)
- $162,180
- Comps found
- 6
Show comp detail 6 sales within ~0.75 mi
| Address | Dist | Beds/Ba | Sqft | Sold | Price | $/sf | Match |
|---|---|---|---|---|---|---|---|
| 214 N Preston St | 0.13mi | 2/1.0 (-1) | 1,050 (+3%) | 4mo | $65,000 | $62 | 81 |
| 806 E Beth St | 0.07mi | 2/1.0 (-1) | 970 (-5%) | 12mo | $130,000 | $134 | 74 |
| 207 N Pearl St | 0.10mi | 2/1.0 (-1) | 1,120 (+10%) | 1mo | $30,000 | $27 | 73 |
| 922 Dee Ave | 0.16mi | 2/2.0 (-1) | 1,019 (-0%) | 20mo | $213,900 | $210 | 67 |
| 921 E Beth St | 0.11mi | 3/2.0 | 1,161 (+14%) | 15mo | $185,000 | $159 | 56 |
| 911 E Chad St | 0.15mi | 2/2.0 (-1) | 1,131 (+11%) | 14mo | $212,900 | $188 | 54 |
Match score weights: distance 35% · size 25% · config 20% · recency 20%. Top-matched comps best support the ARV.
Projected returns pro-forma
-3.0% appreciation · 3.0% rent growth · sell at horizon
- IRR
- -7.3%
- Equity multiple
- 0.73×
- Total profit
- $-10,939
- Equity at exit
- $21,620
- IRR
- 2.3%
- Equity multiple
- 1.17×
- Total profit
- $6,709
- Equity at exit
- $12,537
Cash invested: $40,600 (down + closing). Projections, not guarantees.
Landlord ↔ Tenant lean methodology
- Overall (STATE)
- 87 Strongly Landlord-Friendly
- State Texas
- 87 Strongly Landlord-Friendly · R+5
- County
- — inherits STATE
- City
- — inherits STATE
ZIP-level market 76692
- Home prices YoY
- -6.5%
- Active inventory
- 638
- Price-to-rent
- 8.0×
Monthly cashflow live
- Estimated rent
- $1,519 medium interval (Pro) →
- Mortgage (P&I)
- −$760
- Tax from tax record
- −$182 /mo · $2,184/yr
- Insurance
- −$60
- HOA
- −$0
- Vacancy / Maint / Mgmt
- −$319
- Net cashflow
- $197
Break-even live
UW: 25.0% down · 7.5% · 30yr · 1.5% tax · 5.0% vac · 8.0% maint · 8.0% mgmt
Financing live
Cash to close
- Down payment
- $36,250
- Closing costs
- $4,350
- Reserves months
- —
- Total cash needed
- —
Loan-product check · same deal, 3 products live
Conventional
25% down · 7.5% · 30yr
- Down + closing
- —
- Monthly P&I
- —
- Monthly cashflow
- —
- DSCR
- —
- Eligible?
- —
Personal DTI + credit; lowest rate.
DSCR
20% down · 8.5% · 30yr
- Down + closing
- —
- Monthly P&I
- —
- Monthly cashflow
- —
- DSCR
- —
- Eligible?
- —
No personal income docs; deal must DSCR.
Hard money
10% down · 12.0% · 12mo
- Down + closing
- —
- Monthly P&I
- —
- Monthly cashflow
- —
- DSCR
- —
- Eligible?
- —
Short-term bridge; refi at stabilization.
Rent comps 3 comps
| Address | Beds | Baths | Sqft | Rent | $/sqft | DOM | Units | Dist |
|---|---|---|---|---|---|---|---|---|
| 915 E Dee St Whitney, TX | 2.0 | 2.0 | 1064 | $1,540 | $1.45 | 20d | 1 | 0.10mi |
| 301 N Guadalupe St Whitney, TX | 3.0 | 1.0 | 1409 | $1,500 | $1.06 | 12d | 1 | 0.87mi |
| 512 S Colorado St Whitney, TX | 3.0 | 1.0 | 1176 | $1,300 | $1.11 | 20d | 1 | 1.00mi |
Listing history 8 events
-
2026-06-18days on market $145,000 Active 9 DOM
-
2026-06-17days on market $145,000 Active 8 DOM
-
2026-06-16days on market $145,000 Active 7 DOM
-
2026-06-15days on market $145,000 Active 6 DOM
-
2026-06-15days on market $145,000 Active 5 DOM
-
2026-06-13days on market $145,000 Active 4 DOM
-
2026-06-12remarks 693-char remark
-
2026-06-12$145,000 Active 3 DOM
ⓘ Source: listings_history table (triggers on properties + properties_extension) + one-shot
backfill from property_details.listing_events for pre-trigger history.
Tax reassessment forecast TX · Resets to sale price
- Current annual tax
- $2,184 · $182/mo
- Projected year-2 tax
- $2,654 · $221/mo
- Expected delta
- +$469/yr (+$39/mo · 21.5%)
ⓘ Screening estimate from a state-policy table — verify with the county assessor before closing.
Climate risk First Street
- Flood 1/10 Low FEMA zone X (unshaded) · 0% chance over 30 yrs
- Wildfire 7/10 Severe
- Heat 7/10 Severe 7 d/yr ≥109°F today · 25 d/yr by 30 yrs out
- Wind 6/10 Major 27% chance of damaging wind over 30 yrs
- Air quality 2/10 Low 1 unhealthy d/yr today · 2 by 30 yrs out
Nearby sold comps map
Loading sold comps map…
Walkable amenities ~0.75 mi
Loading nearby amenities…
Taxation est. · year 1
- Rental income
- $18,222
- − Mortgage interest
- −$8,122
- − Property taxes
- −$2,184
- − Insurance
- −$725
- − Repairs & maintenance
- −$1,458
- − Management
- −$1,458
- − Depreciation
- −$4,218
- Taxable income
- $57
- Est. tax owed @ 24.0%
- −$14
- After-tax cash flow
- $2,348/yr
For passive investors: Depreciation is non-cash, so a rental often shows a tax loss while cash-flowing — sheltering income. Rental losses are passive: they offset passive income freely, and up to $25,000/yr can offset ordinary (W-2) income if you actively participate and your MAGI is under $100k (phasing out to $0 by $150k); unused losses carry forward. On sale, claimed depreciation is recaptured at up to 25%, and gains may owe capital-gains tax (a 1031 exchange can defer both). Figures are a year-1 estimate at your 24.0% rate — not tax advice; consult a CPA.
Schools (NCES district)
- District
- Whitney ISD
- NCES district ID
- 4845720
- Math proficiency
- 42% ▬ 0.00%
- Reading proficiency
- 41% ▲ 3.00%
- Median HH income
- $41,861
- Composite
- 34.97/100
- National rank
- #5060
- State rank
- #378 of 826 in TX
Livability — Whitney
- Score
- 71/100
- State rank
- #282
- US rank
- #6568
Category grades
Schools grade is shown separately in the Schools card above.
Census & demographics
- Census place
- Whitney, TX
- Population (ZIP)
- 9,662
Population outlook (Hill County) Hauer SSP2
- Today (2025)
- 34,013 people
- By 2030
- 33,289 · -2.1%
- By 2040
- 31,688 · -6.8%
- By 2050
- 30,100 · -11.5%
- By 2075
- 26,818 · -21.2%
- By 2100
- 22,918 · -32.6%
Race, ethnicity, and origin ACS 2023
- Neighborhood character
- Predominantly White (83%)
- Race & ethnicity
- White 83% Hispanic / Latino 12% Two or more races 4% Black 2%
- Hispanic origin (detail)
- Mexican 11%
- Common ancestry
- Italian 3% Lithuanian 2% Romanian 2%
- Foreign-born
- 4% · Canada, Vietnam
- Languages at home
- 90% English-only · Spanish 9%
Political lean MEDSL · Hill
- 2024 margin
- Solid R (+64.4) · D 17.5% · R 81.8%
- 2008→2024 swing
- -23.0pp toward R · 2008: -41.4pp · 2024: -64.4pp
- All cycles
- 2024: R+64.4 2020: R+60.7 2016: R+58.4 2012: R+53.0 2008: R+41.4
Not yet ingested
- Civics
- —
Market trends
- HPI YoY
- ▼ -17.72%
- Current HPI
- 252.9827
- Rent YoY
- —
- Metro
- —
- State GDP YoY
- ▲ 3.95%
- F500 in state
- 110
Industry mix (Fortune 500 HQ in TX)
| Industry | F500 HQs | Revenue |
|---|---|---|
| Energy | 16 | $1,198B |
|
||
| Technology | 5 | $198B |
|
||
| Engineering / Construction | 4 | $72B |
|
||
| Energy Services | 3 | $60B |
|
||
| Utilities | 3 | $41B |
|
||
| Healthcare | 2 | $330B |
|
||
Price history
3 events — show timeline
- 2026-06-09 Listed $145,000 NTREIS
- 2000-01-03 Sold (Public Records) — Public Records
- 1995-09-01 Sold (Public Records) — Public Records
Property tax history
+4.6%/yrLatest (2025): $2,184 · +6.6% YoY. Source: county tax records.
Cash-flow waterfall
monthlySold comps — $/sqft
last 12 mo · ≤1 miLoading sold comps…