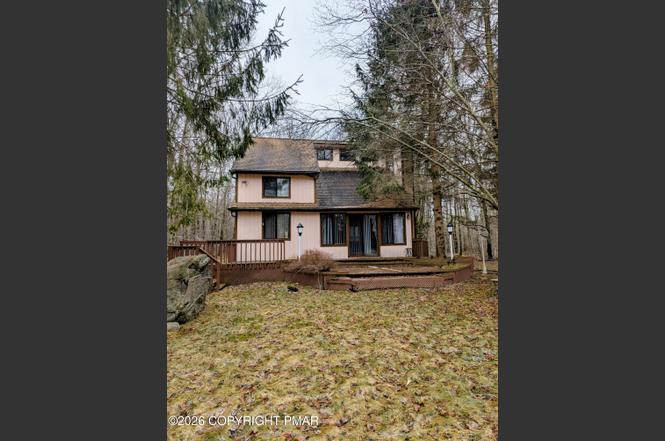
36 Big Bass Dr Unit B311 · Big Bass Lake, PA
Flood risk 1/10 · Minimal
- FEMA flood zone
- X (unshaded)
- Chance of flooding over 30 yrs
- 0.0%
- Est. flood insurance / yr
- $473 – $860
Fire risk 1/10 · Minimal
- Est. fire insurance / yr
- $511 – $949
Heat risk 1/10 · Minimal
- Hot days now (above 88°F)
- 7 days/yr
- Hot days in 30 yrs
- 16 days/yr
Wind risk 3/10 · Minor
- Chance of severe wind over 30 yrs
- 5.0%
Air-quality risk 2/10 · Minimal
- Unhealthy air days now
- 1 days/yr
- Unhealthy air days in 30 yrs
- 2 days/yr
Risk factors via First Street. Map © Google.
Why this score? — see what drove the C grade
The composite is a weighted blend of 9 inputs, each scored 0–100. Each bar is that input's sub-score; the figure is the points it added to the 100-point composite (weight × sub-score).
- ARV discount +15.0/15.0
- Cash flow +12.8/30.0
- Appreciation +9.2/10.0
- 1% rule +5.1/10.0
- Schools +5.0/10.0
- DSCR +3.8/10.0
- Livability +3.5/5.0
- Rent growth +2.5/5.0
- Condition / age +2.5/5.0
$175,000
🖨 Deal sheet 📄 Offer letter ✓ Due diligence
Listing remarks
GREAT LOCATION JUST A SHORT DISTANCE FROM THE BIG BASS LAKE BEACH! THE 3 BEDROOM, 1.5 BATH HOME FEATURES CATHEDRAL CEILINGS, TILED BATHS, & A PAVED DRIVEWAY. ENJOY THE COMMUNITY AMENITIES INCLUDING 3 LAKES, INDOOR POOL COMPLEX, OUTDOOR POOL, TENNIS AND PICKLEBALL COURTS TO NAME A FEW. CONVENIENTLY LOCATED CLOSE TO INTERSTATE HIGHWAYS, MOUNT AIRY CASINO, TRIPLE A YANKEE BASEBALL AND THE GREAT POCONO MOUNTAINS!
Key facts
- Outdoor pool
- Indoor pool complex
- Cathedral ceilings
Tags
Neighborhood map
What this means for you Summary
Snapshot
- This is a 3-bed/1.5-bath single-family listed at $175k.
Deal economics
- At list price, monthly cash flow is $-16 ($-197/yr) — negative.
- To cash-flow at today's rent, offer at most $173k (1.4% below list).
- Meets the 1% rule at list price ($2k rent vs $175k).
- Recommended offer: $173k (1.4% below list) — sets the bar for cash-flow.
- Cap rate 6.2% vs local median 3.8% in Big Bass Lake — top-decile yield for the area; either an underpriced asset or a hidden risk that comps aren't pricing in. Stress-test before assuming the spread holds.
Location & tenants
- Location reads 70/100 on livability (#763 in PA) — a middle-class / working-renter tenant base. Strengths: crime A+, cost of living A+, housing B+; Watch: schools D-, amenities F, commute F.
- North Pocono SD (rural): math 45% / reading 71% proficiency, ranked #82 of 539 in PA (top 15%) — acceptable for families but not a draw, mixed tenant base, ~2y average lease.
- Market conditions: 299 active listings in the ZIP; 251 units permitted in Lackawanna County in 2024 (0 in 5+ unit buildings).
Forward outlook
- In year one you build about $16k of equity ($1k loan paydown + $15k appreciation (8.4% local appreciation)).
- Lackawanna County population projected to shrink 4% by 2050 — rents likely to lag national; underwrite the cash flow, not the appreciation.
- At projected returns (8.4% appreciation + 3.0% rent growth), your $49k cash investment doubles in ~3 years — after that, you're playing with house money.
- By year 3, paydown + projected appreciation supports a ~$40k cash-out refi (75% LTV) — recoverable capital for the next deal without selling this one.
Negotiation context
- Only 8 days on market — expect competitive offers; lowballing is unlikely to land.
- 5 sale attempts since 2y ago with the ask held roughly flat each time — persistent listings suggest the price (not the market) is what's stuck; bring a comps-based counter.
Questions for the listing agent
- What do current leases actually rent for vs. the listed asking? Can we see a recent rent roll and the last 12 months of T-12 income?
- What does the HOA fee cover, when was the last increase, and are there any pending special assessments or reserve-fund shortfalls?
- Is there a deadline driving the sale (1031 exchange, divorce, estate, relocation)? That informs how much negotiation room exists.
- Schools are D-rated, which usually means shorter tenancies and higher turnover. Who's the typical renter profile here, and what's been the actual vacancy rate?
- What's the average days-on-market for RENTAL listings here right now (not sales)? A rising rental-DOM trend means longer vacancies and softer asking-rent achievability than the comps imply.
- What's the recent tenant-quality profile in this submarket — average credit score on applications, eviction rate, late-payment / NSF rate, and stable-employment percentage? A property-management company in the area should have these aggregated.
- How much new for-sale + rental construction is in the pipeline within 1–3 miles? Heavy new supply typically softens prices + rents 12–24 months out; constrained supply supports both.
Investment metrics
- 1% rule
- 1.01% ✓
- Cap rate
- 6.18%
- Cash-on-cash
- -0.40%
- DSCR
- 0.98
- GRM
- 8.3
CMA / ARV
- ARV (on-the-fly)
- $346,788
- Comps found
- 7
Show comp detail 7 sales within ~0.75 mi
| Address | Dist | Beds/Ba | Sqft | Sold | Price | $/sf | Match |
|---|---|---|---|---|---|---|---|
| 11 Lake Dr E Unit B327 | 0.06mi | 3/2.0 | 1,386 (-1%) | 1mo | $650,000 | $469 | 92 |
| 87 Livingston Ln | 0.61mi | 3/2.0 | 1,396 (-1%) | 14mo | $345,000 | $247 | 57 |
| 87 W Creek View Dr | 0.38mi | 3/2.0 | 1,455 (+4%) | 24mo | $305,000 | $210 | 54 |
| 1915 Livingston Ln | 0.65mi | 3/2.0 | 1,500 (+7%) | 6mo | $305,000 | $203 | 51 |
| 8 Ridge Rd | 0.43mi | 3/2.0 | 1,500 (+7%) | 19mo | $330,000 | $220 | 50 |
| 191 Pa-435 | 0.75mi | 3/2.0 | 1,366 (-3%) | 12mo | $375,000 | $275 | 49 |
| 140 Cardinal Dr | 0.71mi | 3/2.0 | 1,300 (-7%) | 21mo | $369,000 | $284 | 35 |
Match score weights: distance 35% · size 25% · config 20% · recency 20%. Top-matched comps best support the ARV.
Projected returns pro-forma
8.45% appreciation · 3.0% rent growth · sell at horizon
- IRR
- 20.7%
- Equity multiple
- 2.56×
- Total profit
- $76,324
- Equity at exit
- $138,407
- IRR
- 19.1%
- Equity multiple
- 5.55×
- Total profit
- $222,875
- Equity at exit
- $280,108
Cash invested: $49,000 (down + closing). Projections, not guarantees.
Landlord ↔ Tenant lean methodology
- Overall (STATE)
- 62 Landlord-Friendly
- State Pennsylvania
- 62 Landlord-Friendly · EVEN
- County
- — inherits STATE
- City
- — inherits STATE
ZIP-level market 18424
- Home prices YoY
- 2.2%
- Active inventory
- 299
- Price-to-rent
- 8.3×
Monthly cashflow live
- Estimated rent
- $1,766 medium interval (Pro) →
- Mortgage (P&I)
- −$918
- Tax est. 1.5%
- −$219 /mo · $2,625/yr
- Insurance
- −$73
- HOA
- −$202
- Vacancy / Maint / Mgmt
- −$371
- Net cashflow
- $-16
Break-even live
UW: 25.0% down · 7.5% · 30yr · 1.5% tax · 5.0% vac · 8.0% maint · 8.0% mgmt
Financing live
Cash to close
- Down payment
- $43,750
- Closing costs
- $5,250
- Reserves months
- —
- Total cash needed
- —
Loan-product check · same deal, 3 products live
Conventional
25% down · 7.5% · 30yr
- Down + closing
- —
- Monthly P&I
- —
- Monthly cashflow
- —
- DSCR
- —
- Eligible?
- —
Personal DTI + credit; lowest rate.
DSCR
20% down · 8.5% · 30yr
- Down + closing
- —
- Monthly P&I
- —
- Monthly cashflow
- —
- DSCR
- —
- Eligible?
- —
No personal income docs; deal must DSCR.
Hard money
10% down · 12.0% · 12mo
- Down + closing
- —
- Monthly P&I
- —
- Monthly cashflow
- —
- DSCR
- —
- Eligible?
- —
Short-term bridge; refi at stabilization.
HOA detail
- Monthly dues
- $202 · $2,424/yr
- Likely covers
- pool
Listing history 11 events
-
2026-03-21status Pending
-
2026-03-10$175,000 Active
-
2025-11-29historical
-
2025-11-26status Active
-
2025-11-11status Pending
-
2025-10-23price $225,000
-
2025-08-28$249,999 Active
-
2025-04-26historical
-
2025-01-16price $260,000
-
2024-11-30status Active
-
2024-08-14$275,000 Active
ⓘ Source: listings_history table (triggers on properties + properties_extension) + one-shot
backfill from property_details.listing_events for pre-trigger history.
Climate risk First Street
- Flood 1/10 Low FEMA zone X (unshaded) · 0% chance over 30 yrs
- Wildfire 1/10 Low
- Heat 1/10 Low 7 d/yr ≥88°F today · 16 d/yr by 30 yrs out
- Wind 3/10 Moderate 5% chance of damaging wind over 30 yrs
- Air quality 2/10 Low 1 unhealthy d/yr today · 2 by 30 yrs out
Nearby sold comps map
Loading sold comps map…
Walkable amenities ~0.75 mi
Loading nearby amenities…
Taxation est. · year 1
- Rental income
- $21,190
- − Mortgage interest
- −$9,803
- − Property taxes
- −$2,625
- − Insurance
- −$875
- − Repairs & maintenance
- −$1,695
- − Management
- −$1,695
- − HOA
- −$2,424
- − Depreciation
- −$5,091
- Taxable loss
- −$3,018
- Est. tax savings @ 24.0%
- +$724
- After-tax cash flow
- $528/yr
For passive investors: Depreciation is non-cash, so a rental often shows a tax loss while cash-flowing — sheltering income. Rental losses are passive: they offset passive income freely, and up to $25,000/yr can offset ordinary (W-2) income if you actively participate and your MAGI is under $100k (phasing out to $0 by $150k); unused losses carry forward. On sale, claimed depreciation is recaptured at up to 25%, and gains may owe capital-gains tax (a 1031 exchange can defer both). Figures are a year-1 estimate at your 24.0% rate — not tax advice; consult a CPA.
Schools (NCES district)
- District
- North Pocono SD
- NCES district ID
- 4217310
- Math proficiency
- 45% ▼ -9.00%
- Reading proficiency
- 71% ▼ -2.00%
- Median HH income
- $59,555
- Composite
- 50.23/100
- National rank
- #1894
- State rank
- #82 of 539 in PA
Livability — Big Bass Lake
- Score
- 70/100
- State rank
- #763
- US rank
- #7622
Category grades
Schools grade is shown separately in the Schools card above.
Census & demographics
- Census place
- Big Bass Lake, PA
- Population (ZIP)
- 5,076
Population outlook (Lackawanna County) Hauer SSP2
- Today (2025)
- 210,652 people
- By 2030
- 208,623 · -1.0%
- By 2040
- 203,980 · -3.2%
- By 2050
- 201,069 · -4.5%
- By 2075
- 205,026 · -2.7%
- By 2100
- 210,851 · +0.1%
Race, ethnicity, and origin ACS 2023
- Neighborhood character
- Predominantly White (89%)
- Race & ethnicity
- White 89% Two or more races 6% Hispanic / Latino 5% Black 1%
- Hispanic origin (detail)
- Puerto Rican 2% Dominican 1% Salvadoran 1%
- Common ancestry
- Romanian 11% Iranian 6% Scotch-Irish 3%
- Foreign-born
- 3% · Canada, Dominican Republic
- Languages at home
- 97% English-only · Spanish 2% Other Indo-European 1%
Political lean MEDSL · Lackawanna
- 2024 margin
- Toss-up / Even · D 51.0% · R 48.3%
- 2008→2024 swing
- -23.2pp toward R · 2008: 26.0pp · 2024: 2.8pp
- All cycles
- 2024: D+2.8 2020: D+8.4 2016: D+3.4 2012: D+27.4 2008: D+26.0
Not yet ingested
- Civics
- —
Market trends
- HPI YoY
- ▲ 8.45%
- Current HPI
- 399.903
- Rent YoY
- —
- Metro
- —
- State GDP YoY
- ▲ 1.68%
- F500 in state
- 34
Industry mix (Fortune 500 HQ in PA)
| Industry | F500 HQs | Revenue |
|---|---|---|
| Healthcare | 2 | $309B |
|
||
| Insurance | 2 | $27B |
|
||
| Telecommunications / Media | 1 | $124B |
|
||
| Industrial Distribution | 1 | $22B |
|
||
| Financial Services | 1 | $20B |
|
||
| Chemicals / Materials | 1 | $18B |
|
||
Price history
-36.4% since first listed11 events — show timeline
- 2026-03-21 Pending — PMAR
- 2026-03-10 Listed $175,000 PMAR
- 2025-11-29 Delisted — PMAR
- 2025-11-26 Relisted — PMAR
- 2025-11-11 Pending — PMAR
- 2025-10-23 Price Changed $225,000 PMAR
- 2025-08-28 Listed $249,999 PMAR
- 2025-04-26 Delisted — PMAR
- 2025-01-16 Price Changed $260,000 PMAR
- 2024-11-30 Relisted — PMAR
- 2024-08-14 Listed $275,000 PMAR
Cash-flow waterfall
monthlySold comps — $/sqft
last 12 mo · ≤1 miLoading sold comps…