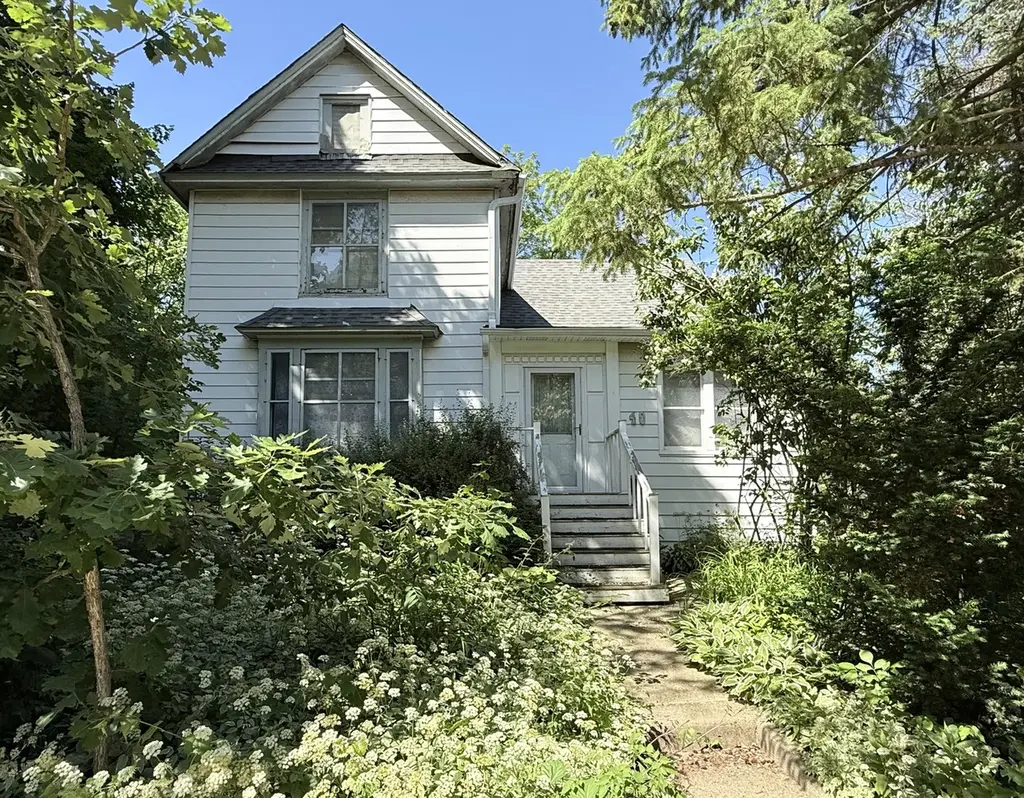
40 E Hattendorf Ave · Roselle, IL
Flood risk No data
- FEMA flood zone
- —
- Chance of flooding over 30 yrs
- —
- Est. flood insurance / yr
- —
Fire risk No data
- Est. fire insurance / yr
- —
Heat risk No data
- Hot days now (above threshold)
- —
- Hot days in 30 yrs
- —
Wind risk No data
- Chance of severe wind over 30 yrs
- —
Air-quality risk No data
- Unhealthy air days now
- —
- Unhealthy air days in 30 yrs
- —
Risk factors via First Street. Map © Google.
Why this score? — see what drove the D+ grade
The composite is a weighted blend of 9 inputs, each scored 0–100. Each bar is that input's sub-score; the figure is the points it added to the 100-point composite (weight × sub-score).
- ARV discount +15.0/15.0
- Cash flow +14.0/30.0
- DSCR +4.2/10.0
- 1% rule +3.9/10.0
- Livability +3.8/5.0
- Schools +3.6/10.0
- Rent growth +2.5/5.0
- Condition / age +2.5/5.0
- Appreciation +0.0/10.0
$300,000
🖨 Deal sheet (PDF) 📄 Offer letter ✓ Due diligence
Listing remarks
A rare opportunity to own a piece of downtown Roselle. This property is being sold strictly as-is with value in the land, offering the ultimate foundation for buyers, investors, or builders. Zoned R-3, accommodating single-family homes, duplexes, and multi-family units. Enjoy a coveted location just steps from local happenings and the newly renovated Turner Park and pond. Complete with top-tier schools (Spring Hills, Roselle Middle, and Lake Park High) and effortless commuting via the Metra and I-390. An exceptional blend of downtown footprint, property potential, and community living.
Key facts
- 0.31 acre lot
- 2 garage spots
- Built 1908
Property features AI
Finance
- HOA & community: No master association fee required
Exterior
- Parking: 2-car garage (detached, owned); Assigned parking; Additional parking in parking lot — total 3 parking spaces
- Utilities: Public water; Public sewer; Electric with fuses
- Home design: Detached single-family home; 2 stories; Fee simple ownership; Over 100 years old; Property offers commuter train and interstate access
- Construction: Aluminum siding and plaster exterior; Asphalt roof; Concrete perimeter foundation; Built before 1978
- Exterior features: Enclosed porch (16 x 9); Sidewalks; Street lights; Paved streets
Interior
- Kitchen: Range; Microwave; Refrigerator
- Bedrooms: 4 bedrooms; Master bedroom on second floor (19 x 14); Bedroom on second floor (15 x 13); Bedroom on second floor (12 x 9); Bedroom on main level (15 x 9)
- Flooring: Hardwood; Carpet; Wood
- Bathrooms: 1 full bathroom
- Heating & cooling: Natural gas heating; Window air conditioning units
- Interior features: Built-in features; Coffered ceilings; Beamed ceilings; 7 total rooms; Unfinished concrete full basement
- Laundry & utility: Laundry area in basement; Dryer; Sump pump
Neighborhood map
What this means for you Summary
Snapshot
- This is a 3-bed/1.0-bath single-family listed at $300k.
Deal economics
- At list price, monthly cash flow is $38 ($451/yr) — positive.
- The deal already cash-flows at list — no discount required.
- To meet the 1% rule (rent ≥ 1% of price), the offer needs to be $267k (10.9% below list).
- Recommended offer: $267k (10.9% below list) — sets the bar for 1% rule.
- Cap rate 6.4% vs local median 3.3% in Roselle — top-decile yield for the area; either an underpriced asset or a hidden risk that comps aren't pricing in. Stress-test before assuming the spread holds.
Location & tenants
- Location reads 76/100 on livability (#196 in IL, #3,636 nationally) — a middle-class / working-renter tenant base. Strengths: employment A+, housing A+, crime A-; Watch: health & safety D+, amenities F, commute F.
- Lake Park Chsd 108 (suburban): math 37% / reading 43% proficiency, ranked #128 of 620 in IL (top 21%) — families likely to look elsewhere, expect single-tenant / working-renter base with shorter leases.
- Zoned schools: Spring Hills Elem School (math 52% / reading 37%, grade F, #267 of 2,056 statewide, top 15%, 458 students, 0% FRL); Roselle Middle School (math 52% / reading 62%, grade B, #30 of 665 statewide, top 5%, 242 students, 0% FRL); Lake Park High School (math 37% / reading 43%, grade F, #85 of 693 statewide, top 12%, 2,560 students, 0% FRL).
- Market conditions: 52 active listings in the ZIP; 13 comparable units currently listed for rent nearby; rentals at typical pace (median 19d on market — plan ~3-4 weeks tenant-placement turnaround); high-income renter base; 1,378 units permitted in DuPage County in 2024 (594 in 5+ unit buildings).
Forward outlook
- Local home prices are declining (-3.0%/yr); year-one equity from $2k of loan paydown is wiped out by about $9k of value loss. Plan a longer hold.
Negotiation context
- It's been on market 16 days — a 2% lower offer ($296k) is reasonable based on typical stale-listing flexibility.
Risks & watch-outs
- Watch-outs: built in 1908 — expect roof / HVAC / electrical / plumbing capex.
Questions for the listing agent
- Built in 1908 — when were the roof, HVAC, electrical panel, plumbing, and water heater last replaced?
- Is there a deadline driving the sale (1031 exchange, divorce, estate, relocation)? That informs how much negotiation room exists.
- Schools are B-rated — typically a magnet for longer-tenancy family renters. What's the average tenant stay here, and is there a school-zone premium baked into asking?
- The area grade is low — what's the realistic commute time and amenity access for the typical tenant pool here? Any planned neighborhood developments (good or bad) we should know about?
- What's the average days-on-market for RENTAL listings here right now (not sales)? A rising rental-DOM trend means longer vacancies and softer asking-rent achievability than the comps imply.
- What's the recent tenant-quality profile in this submarket — average credit score on applications, eviction rate, late-payment / NSF rate, and stable-employment percentage? A property-management company in the area should have these aggregated.
- How much new for-sale + rental construction is in the pipeline within 1–3 miles? Heavy new supply typically softens prices + rents 12–24 months out; constrained supply supports both.
Investment metrics
- 1% rule
- 0.89% ✗
- Cap rate
- 6.44%
- Cash-on-cash
- 0.54%
- DSCR
- 1.02
- GRM
- 9.4
CMA / ARV
- ARV (on-the-fly)
- $424,095
- Comps found
- 12
Show comp detail 12 sales within ~0.75 mi
| Address | Dist | Beds/Ba | Sqft | Sold | Price | $/sf | Match |
|---|---|---|---|---|---|---|---|
| 26 W Glenlake Ave | 0.22mi | 3/1.5 | 1,632 (-6%) | 0mo | $415,000 | $254 | 78 |
| 122 S Prospect St | 0.31mi | 4/1.5 (+1) | 1,651 (-5%) | 14mo | $360,000 | $218 | 59 |
| 33 E Woodworth Pl | 0.50mi | 3/1.5 | 1,616 (-7%) | 15mo | $384,900 | $238 | 52 |
| 59 W Maple Ave | 0.43mi | 4/2.0 (+1) | 1,634 (-6%) | 12mo | $425,000 | $260 | 51 |
| 455 E Granville Ave | 0.47mi | 3/2.0 | 1,941 (+12%) | 3mo | $475,000 | $245 | 51 |
| 51 W Granville Ave | 0.28mi | 3/1.5 | 1,539 (-11%) | 19mo | $360,000 | $234 | 50 |
| 55 W Devon Ave | 0.38mi | 3/2.0 | 1,584 (-8%) | 16mo | $350,000 | $221 | 50 |
| 321 E Ardmore Ave | 0.65mi | 2/2.0 (-1) | 1,631 (-6%) | 5mo | $349,900 | $215 | 47 |
| 326 Catalpa Ave | 0.70mi | 3/2.0 | 1,608 (-7%) | 11mo | $451,000 | $280 | 42 |
| 345 Catalpa Ave | 0.68mi | 3/2.0 | 1,529 (-12%) | 10mo | $405,000 | $265 | 36 |
| 550 Seward St | 0.68mi | 3/2.5 | 1,600 (-8%) | 16mo | $470,000 | $294 | 36 |
| 101 Claria Dr | 0.40mi | 4/3.0 (+1) | 1,957 (+13%) | 21mo | $440,000 | $225 | 29 |
Match score weights: distance 35% · size 25% · config 20% · recency 20%. Top-matched comps best support the ARV.
Projected returns pro-forma
-3.0% appreciation · 3.0% rent growth · sell at horizon
- IRR
- -15.4%
- Equity multiple
- 0.45×
- Total profit
- $-46,177
- Equity at exit
- $44,731
- IRR
- -6.9%
- Equity multiple
- 0.56×
- Total profit
- $-36,961
- Equity at exit
- $25,939
Cash invested: $84,000 (down + closing). Projections, not guarantees.
Landlord ↔ Tenant lean methodology
- Overall (STATE)
- 43 Moderately Tenant-Leaning
- State Illinois
- 43 Moderately Tenant-Leaning · D+7
- County
- — inherits STATE
- City
- — inherits STATE
ZIP-level market 60172
- Active inventory
- 52
- Price-to-rent
- 9.4×
Monthly cashflow live
- Estimated rent
- $2,672 high interval (Pro) →
- Mortgage (P&I)
- −$1,573
- Tax est. 1.5%
- −$375 /mo · $4,500/yr
- Insurance
- −$125
- HOA
- −$0
- Vacancy / Maint / Mgmt
- −$561
- Net cashflow
- $38
Break-even live
Sensitivity live
| Price | -10% $245 | -5% $141 | +0% $38 | +5% $-66 | +10% $-170 |
|---|---|---|---|---|---|
| Rent | -10% $-173 | -5% $-68 | +0% $38 | +5% $143 | +10% $249 |
| Rate | -1.0pp $189 | -0.5pp $114 | base $38 | +0.5pp $-40 | +1.0pp $-119 |
UW: 25.0% down · 7.5% · 30yr · 1.5% tax · 5.0% vac · 8.0% maint · 8.0% mgmt
Financing live
Cash to close
- Down payment
- $75,000
- Closing costs
- $9,000
- Reserves months
- —
- Total cash needed
- —
Loan-product check · same deal, 3 products live
Conventional
25% down · 7.5% · 30yr
- Down + closing
- —
- Monthly P&I
- —
- Monthly cashflow
- —
- DSCR
- —
- Eligible?
- —
Personal DTI + credit; lowest rate.
DSCR
20% down · 8.5% · 30yr
- Down + closing
- —
- Monthly P&I
- —
- Monthly cashflow
- —
- DSCR
- —
- Eligible?
- —
No personal income docs; deal must DSCR.
Hard money
10% down · 12.0% · 12mo
- Down + closing
- —
- Monthly P&I
- —
- Monthly cashflow
- —
- DSCR
- —
- Eligible?
- —
Short-term bridge; refi at stabilization.
Rent comps 13 comps
| Address | Beds | Baths | Sqft | Rent | $/sqft | DOM | Units | Dist |
|---|---|---|---|---|---|---|---|---|
| 225 Main St #214 Roselle, IL | 2.0 | 2.0 | 1704 | $2,800 | $1.64 | 21d | 1 | 0.31mi |
| 523 Club House Cir Roselle, IL | 3.0 | 2.5 | 1605 | $2,800 | $1.74 | 17d | 1 | 0.63mi |
| 1623 Indian Hill Dr Roselle, IL | 3.0 | 1.5 | 1800 | $3,050 | $1.69 | 22d | 1 | 0.76mi |
| 280 Springhill Dr Roselle, IL | 2.0 | 2.0 | 1196 | $1,865 | $1.56 | 26d | 1 | 0.92mi |
| 280 Springhill Dr Roselle, IL | 2.0 | 2.0 | 1196 | $1,865 | $1.56 | 0d | 1 | 0.92mi |
| 790 E Irving Park Rd Unit 3E Roselle, IL | 2.0 | 2.0 | 1325 | $2,387 | $1.80 | 26d | 1 | 0.96mi |
| 840 E Irving Park Rd Roselle, IL | 2.0 | 2.0 | 1277 | $2,666 | $2.09 | 0d | 13 | 0.98mi |
| 841 Cross Creek Ct Unit C Roselle, IL | 2.0 | 2.0 | 1250 | $2,249 | $1.80 | 26d | 1 | 1.19mi |
| 1298 Leonard Dr Unit 1298 Schaumburg, IL | 3.0 | 2.5 | 2000 | $3,150 | $1.57 | 21d | 1 | 1.25mi |
| 521 Cumberland Trl Apt D Roselle, IL | 3.0 | 2.0 | 1350 | $2,500 | $1.85 | 19d | 1 | 1.30mi |
| 676 Cumberland Trl Unit A2 Roselle, IL | 3.0 | 2.0 | 1200 | $2,599 | $2.17 | 3d | 1 | 1.36mi |
| 305 Cambia Dr Schaumburg, IL | 1.0–3.0 | 1.0–1.5 | 850 | $1,838 | $2.16 | 1d | 20 | 1.38mi |
| 242 Nantucket Hbr Schaumburg, IL | 2.0 | 1.5 | 1100 | $2,300 | $2.09 | 7d | 1 | 1.42mi |
Listing history 11 events
-
2026-06-21days on market $300,000 Coming Soon 16 DOM
-
2026-06-18days on market $300,000 Coming Soon 13 DOM
-
2026-06-17days on market $300,000 Coming Soon 12 DOM
-
2026-06-16days on market $300,000 Coming Soon 11 DOM
-
2026-06-15days on market $300,000 Coming Soon 10 DOM
-
2026-06-13days on market $300,000 Coming Soon 8 DOM
-
2026-06-13days on market $300,000 Coming Soon 7 DOM
-
2026-06-09days on market $300,000 Coming Soon 4 DOM
-
2026-06-08days on market $300,000 Coming Soon 3 DOM
-
2026-06-07remarks 592-char remark
-
2026-06-07$300,000 Coming Soon 2 DOM
ⓘ Source: listings_history table (triggers on properties + properties_extension) + one-shot
backfill from property_details.listing_events for pre-trigger history.
Nearby sold comps map
Loading sold comps map…
Walkable amenities ~0.75 mi
Loading nearby amenities…
Taxation est. · year 1
- Rental income
- $32,064
- − Mortgage interest
- −$16,805
- − Property taxes
- −$4,500
- − Insurance
- −$1,500
- − Repairs & maintenance
- −$2,565
- − Management
- −$2,565
- − Depreciation
- −$8,727
- Taxable loss
- −$4,599
- Est. tax savings @ 24.0%
- +$1,104
- After-tax cash flow
- $1,555/yr
For passive investors: Depreciation is non-cash, so a rental often shows a tax loss while cash-flowing — sheltering income. Rental losses are passive: they offset passive income freely, and up to $25,000/yr can offset ordinary (W-2) income if you actively participate and your MAGI is under $100k (phasing out to $0 by $150k); unused losses carry forward. On sale, claimed depreciation is recaptured at up to 25%, and gains may owe capital-gains tax (a 1031 exchange can defer both). Figures are a year-1 estimate at your 24.0% rate — not tax advice; consult a CPA.
Schools (NCES district)
- District
- Lake Park Chsd 108
- NCES district ID
- 1721840
- Math proficiency
- 37% ▼ -16.00%
- Reading proficiency
- 43% ▼ -6.00%
- Median HH income
- $69,790
- Composite
- 36.37/100
- National rank
- #4684
- State rank
- #128 of 620 in IL
Livability — Roselle
- Score
- 76/100
- State rank
- #196
- US rank
- #3636
Category grades
Schools grade is shown separately in the Schools card above.
Census & demographics
- Census place
- Roselle, IL
- County
- DuPage County · 904,569 people
- City population
- 24,141
- Metro
- Chicago-Naperville-Elgin, IL-IN-WI
- Population (ZIP)
- 24,141
- Household income
- $110,750
- Rent vs Own
- Severe rent burden
- 320.0
Population outlook (DuPage County) Hauer SSP2
- Today (2025)
- 960,187 people
- By 2030
- 965,850 · +0.6%
- By 2040
- 965,812 · +0.6%
- By 2050
- 954,890 · -0.6%
- By 2075
- 910,185 · -5.2%
- By 2100
- 816,255 · -15.0%
Race, ethnicity, and origin ACS 2023
- Neighborhood character
- Predominantly White (78%)
- Race & ethnicity
- White 78% Hispanic / Latino 10% Asian 9% Two or more races 8% Black 1%
- Hispanic origin (detail)
- Mexican 8%
- Common ancestry
- Romanian 24% French 2% Portuguese 1%
- Foreign-born
- 22% · Canada, China
- Languages at home
- 68% English-only · Russian/Polish/Slavic 16% Other Indo-European 6% Spanish 5%
Political lean MEDSL · DuPage
- 2024 margin
- D (+13.3) · D 55.9% · R 42.5% · Other 1.6%
- 2008→2024 swing
- +2.5pp toward D · 2008: 10.8pp · 2024: 13.3pp
- All cycles
- 2024: D+13.3 2020: D+18.1 2016: D+14.1 2012: D+1.0 2008: D+10.8
Not yet ingested
- Civics
- —
Market trends
- HPI YoY
- ▼ -249.61%
- Current HPI
- 207.1221
- Rent YoY
- —
- Metro
- Chicago-Naperville-Elgin, IL-IN-WI
- State GDP YoY
- ▲ 1.59%
- F500 in state
- 60
Industry mix (Fortune 500 HQ in IL)
| Industry | F500 HQs | Revenue |
|---|---|---|
| Insurance | 4 | $201B |
|
||
| Consumer Goods | 4 | $87B |
|
||
| Industrial Machinery | 3 | $64B |
|
||
| Healthcare | 2 | $55B |
|
||
| Retail / Pharmacy | 1 | $148B |
|
||
| Agriculture / Food | 1 | $86B |
|
||
Cash-flow waterfall
monthlySold comps — $/sqft
last 12 mo · ≤1 miLoading sold comps…