400 Butter Rd · Bonneau Beach, SC
Flood risk 1/10 · Minimal
- FEMA flood zone
- X (unshaded)
- Chance of flooding over 30 yrs
- 0.0%
- Est. flood insurance / yr
- $507 – $1,088
Fire risk 6/10 · Moderate
- Est. fire insurance / yr
- $783 – $1,453
Heat risk 8/10 · Major
- Hot days now (above 109°F)
- 7 days/yr
- Hot days in 30 yrs
- 18 days/yr
Wind risk 8/10 · Major
- Chance of severe wind over 30 yrs
- 80.0%
Air-quality risk 3/10 · Minor
- Unhealthy air days now
- 3 days/yr
- Unhealthy air days in 30 yrs
- 3 days/yr
Risk factors via First Street. Map © Google.
Why this score? — see what drove the C+ grade
The composite is a weighted blend of 9 inputs, each scored 0–100. Each bar is that input's sub-score; the figure is the points it added to the 100-point composite (weight × sub-score).
- Cash flow +17.9/30.0
- ARV discount +15.0/15.0
- Appreciation +10.0/10.0
- DSCR +5.6/10.0
- 1% rule +4.8/10.0
- Schools +3.6/10.0
- Livability +3.1/5.0
- Rent growth +2.5/5.0
- Condition / age +2.2/5.0
$199,900
🖨 Deal sheet 📄 Offer letter ✓ Due diligence
Listing remarks MLS
Bank owned home - sold as is. Property is in need of repairs. Located in between two wooded lots for privacy.
Key facts
- Laminate floors
- Soaking tub
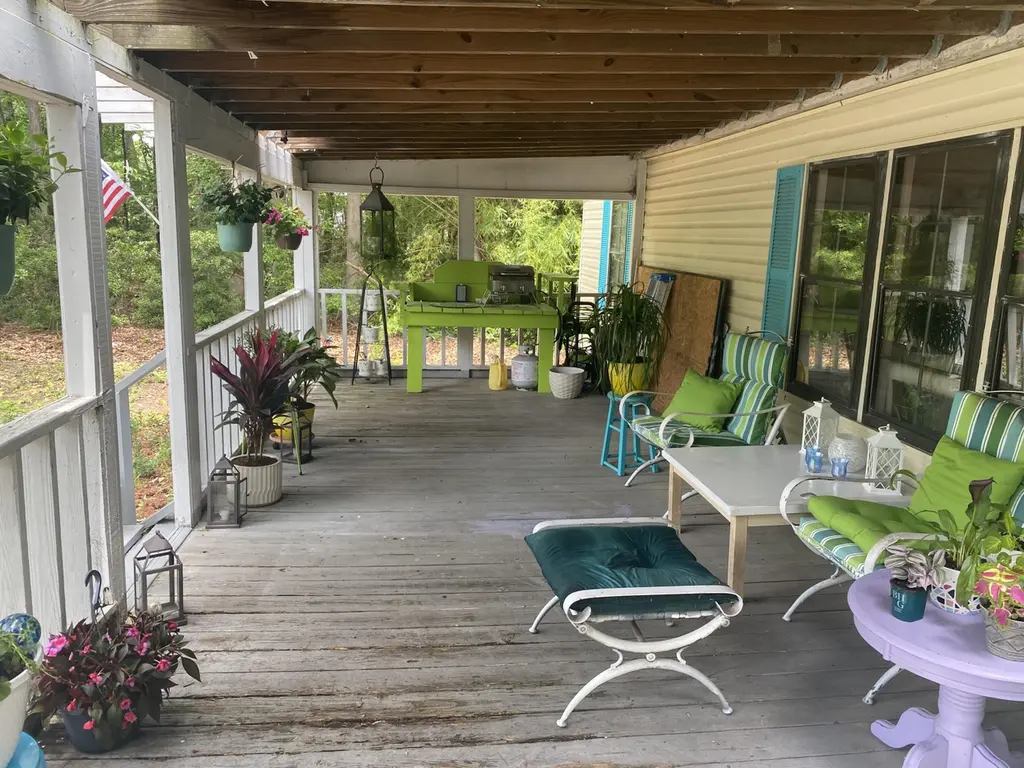
- Front porch
Tags
Property features AI
Exterior
- Parking: Other parking (unspecified)
- Utilities: Septic tank; Santee Cooper electric service
- Home design: Manufactured/mobile home (double wide); Single-story; Residential property
- Construction: Asphalt roof; One-level construction
- Exterior features: Partial fencing; Level lot; Satellite dish; Community dock facilities; Community park; Community trash service
Interior
- Kitchen: Electric range
- Bedrooms: 3 bedrooms; Primary bedroom on lower level
- Flooring: Carpet; Ceramic tile; Laminate
- Bathrooms: 2 bathrooms
- Heating & cooling: Heat pump heating; Central air conditioning
- Interior features: Beamed ceilings; Cathedral/vaulted ceilings; High ceilings; Ceiling fans; Entrance foyer; Great room; Open living/dining area
- Laundry & utility: Laundry room with washer hookup
Neighborhood map
What this means for you Summary
Snapshot
- This is a 3-bed/2.0-bath manufactured listed at $200k. Condition is rated fair.
Deal economics
- At list price, monthly cash flow is $167 ($2k/yr) — positive.
- The deal already cash-flows at list — no discount required.
- To meet the 1% rule (rent ≥ 1% of price), the offer needs to be $196k (1.9% below list).
- Recommended offer: $194k (3.0% below list) — sets the bar for market timing.
Location & tenants
- Location reads 61/100 on livability (#219 in SC) — a middle-class / working-renter tenant base. Strengths: crime A+, cost of living A+, housing A+; Watch: employment D+, amenities F, commute F.
- Berkeley 01 (suburban): math 35% / reading 48% proficiency, ranked #30 of 80 in SC (top 38%) — families likely to look elsewhere, expect single-tenant / working-renter base with shorter leases.
- Zoned schools: Henry E. Bonner Elementary (math 38% / reading 40%, grade F, #301 of 597 statewide, top 51%, 828 students, 100% FRL); Macedonia Middle (math 23% / reading 43%, grade F, #116 of 229 statewide, top 51%, 383 students, 100% FRL); Timberland High (math 17% / reading 72%, grade F, #166 of 196 statewide, top 87%, 704 students, 100% FRL) — zoned schools average 100% FRL vs 48% district-wide (52 pts higher); higher-poverty schools than district average — tighter screening recommended.
- Market conditions: 30 active listings in the ZIP; 2 comparable units currently listed for rent nearby; 3,183 units permitted in Berkeley County in 2024 (580 in 5+ unit buildings).
Forward outlook
- In year one you build about $21k of equity ($1k loan paydown + $20k appreciation (10.0% local appreciation)).
- Berkeley County population projected at +48% by 2050 — long-run rental-demand tailwind backs the buy-and-hold thesis.
- At projected returns (10.0% appreciation + 3.0% rent growth), your $56k cash investment doubles in ~3 years — after that, you're playing with house money.
- By year 2, paydown + projected appreciation supports a ~$34k cash-out refi (75% LTV) — recoverable capital for the next deal without selling this one.
Negotiation context
- It's been on market 42 days — a 3% lower offer ($194k) is reasonable based on typical stale-listing flexibility.
- 2 sale attempts since 16y ago; this cycle's ask has dropped $30k (13%) from the opening price — seller is motivated, your offer sets the floor, not the list.
- Current owner paid $42k; list at $200k implies a 376% gain — meaningful room to come down on a strong offer.
Risks & watch-outs
- Climate carrying-cost: severe wind risk, 80% chance of damaging wind over 30y; major wildfire risk; extreme-heat days projected 7→18/yr by 2055 (HVAC capex compounding) — expect insurance premiums to compound above CPI over the hold.
Questions for the listing agent
- It's been on market 42 days. Have you received any prior offers? Is the seller open to a 3% concession, seller financing, or rate buy-down credit?
- Have any recent inspections been done? Can we get a copy of the seller's disclosures and any deferred-maintenance estimates?
- Is there a deadline driving the sale (1031 exchange, divorce, estate, relocation)? That informs how much negotiation room exists.
- Schools are F-rated, which usually means shorter tenancies and higher turnover. Who's the typical renter profile here, and what's been the actual vacancy rate?
- What's the average days-on-market for RENTAL listings here right now (not sales)? A rising rental-DOM trend means longer vacancies and softer asking-rent achievability than the comps imply.
- What's the recent tenant-quality profile in this submarket — average credit score on applications, eviction rate, late-payment / NSF rate, and stable-employment percentage? A property-management company in the area should have these aggregated.
- How much new for-sale + rental construction is in the pipeline within 1–3 miles? Heavy new supply typically softens prices + rents 12–24 months out; constrained supply supports both.
Investment metrics
- 1% rule
- 0.98% ✗
- Cap rate
- 7.30%
- Cash-on-cash
- 3.58%
- DSCR
- 1.16
- GRM
- 8.5
CMA / ARV
- ARV (on-the-fly)
- $273,728
- Comps found
- 8
Show comp detail 8 sales within ~0.75 mi
| Address | Dist | Beds/Ba | Sqft | Sold | Price | $/sf | Match |
|---|---|---|---|---|---|---|---|
| 406 Butter Rd | 0.06mi | 3/2.0 | 1,568 (+8%) | 1mo | $242,000 | $154 | 84 |
| 546 Pauline Dr | 0.49mi | 4/2.0 (+1) | 1,456 (0%) | 0mo | $286,000 | $196 | 72 |
| 114 Buck Ln | 0.27mi | 4/2.0 (+1) | 1,624 (+12%) | 13mo | $316,000 | $195 | 52 |
| 103 Bush Dr | 0.61mi | 3/2.0 | 1,325 (-9%) | 6mo | $271,000 | $205 | 52 |
| 212 Pooshee Plantation Way | 0.46mi | 3/2.0 | 1,300 (-11%) | 11mo | $145,000 | $112 | 52 |
| 454 Pooshee Plantation Way | 0.72mi | 4/2.0 (+1) | 1,440 (-1%) | 12mo | $270,000 | $188 | 50 |
| 663 Barn Rd | 0.43mi | 3/2.0 | 1,674 (+15%) | 8mo | $209,000 | $125 | 48 |
| 632 Barn Rd | 0.40mi | 3/2.0 | 1,248 (-14%) | 14mo | $225,000 | $180 | 45 |
Match score weights: distance 35% · size 25% · config 20% · recency 20%. Top-matched comps best support the ARV.
Projected returns pro-forma
10.0% appreciation · 3.0% rent growth · sell at horizon
- IRR
- 26.9%
- Equity multiple
- 3.14×
- Total profit
- $119,549
- Equity at exit
- $180,086
- IRR
- 23.5%
- Equity multiple
- 7.14×
- Total profit
- $343,736
- Equity at exit
- $388,362
Cash invested: $55,972 (down + closing). Projections, not guarantees.
Landlord ↔ Tenant lean methodology
- Overall (STATE)
- 90 Strongly Landlord-Friendly
- State South Carolina
- 90 Strongly Landlord-Friendly · R+6
- County
- — inherits STATE
- City
- — inherits STATE
ZIP-level market 29431
- Home prices YoY
- 5.6%
- Active inventory
- 30
- Price-to-rent
- 8.5×
Monthly cashflow live
- Estimated rent
- $1,960 medium interval (Pro) →
- Mortgage (P&I)
- −$1,048
- Tax est. 1.5%
- −$250 /mo · $2,998/yr
- Insurance
- −$83
- HOA
- −$0
- Vacancy / Maint / Mgmt
- −$412
- Net cashflow
- $167
Break-even live
UW: 25.0% down · 7.5% · 30yr · 1.5% tax · 5.0% vac · 8.0% maint · 8.0% mgmt
Financing live
Cash to close
- Down payment
- $49,975
- Closing costs
- $5,997
- Reserves months
- —
- Total cash needed
- —
Loan-product check · same deal, 3 products live
Conventional
25% down · 7.5% · 30yr
- Down + closing
- —
- Monthly P&I
- —
- Monthly cashflow
- —
- DSCR
- —
- Eligible?
- —
Personal DTI + credit; lowest rate.
DSCR
20% down · 8.5% · 30yr
- Down + closing
- —
- Monthly P&I
- —
- Monthly cashflow
- —
- DSCR
- —
- Eligible?
- —
No personal income docs; deal must DSCR.
Hard money
10% down · 12.0% · 12mo
- Down + closing
- —
- Monthly P&I
- —
- Monthly cashflow
- —
- DSCR
- —
- Eligible?
- —
Short-term bridge; refi at stabilization.
Rent comps 2 comps
| Address | Beds | Baths | Sqft | Rent | $/sqft | DOM | Units | Dist |
|---|---|---|---|---|---|---|---|---|
| 103 Hammond St Bonneau, SC | 3.0 | 2.0 | 1456 | $1,950 | $1.34 | 11d | 1 | 0.40mi |
| 206 Canal St Bonneau, SC | 4.0 | 2.0 | 1560 | $2,000 | $1.28 | 23d | 1 | 1.44mi |
Listing history 18 events
-
2026-06-18days on market $199,900 Active 42 DOM
-
2026-06-17days on market $199,900 Active 41 DOM
-
2026-06-16days on market $199,900 Active 40 DOM
-
2026-06-15days on market $199,900 Active 39 DOM
-
2026-06-13days on market $199,900 Active 37 DOM
-
2026-06-13days on market $199,900 Active 36 DOM
-
2026-06-10pricedays on market $199,900 Active 34 DOM
-
2026-06-09days on market $230,000 Active 33 DOM
-
2026-06-08days on market $230,000 Active 32 DOM
-
2026-06-07days on market $230,000 Active 31 DOM
-
2026-06-05days on market $230,000 Active 28 DOM
-
2026-06-03days on market $230,000 Active 27 DOM
-
2026-06-03days on market $230,000 Active 26 DOM
-
2026-06-01days on market $230,000 Active 25 DOM
-
2026-05-31days on market $230,000 Active 24 DOM
-
2026-05-07$230,000 Active
-
2010-04-29soldstatus $42,000 109-char remark
Show marketing remark (109 chars)
Bank owned home - sold as is. Property is in need of repairs. Located in between two wooded lots for privacy.
-
2010-04-01$42,000 109-char remark
Show marketing remark (109 chars)
Bank owned home - sold as is. Property is in need of repairs. Located in between two wooded lots for privacy.
ⓘ Source: listings_history table (triggers on properties + properties_extension) + one-shot
backfill from property_details.listing_events for pre-trigger history.
Climate risk First Street
- Flood 1/10 Low FEMA zone X (unshaded) · 0% chance over 30 yrs
- Wildfire 6/10 Major
- Heat 8/10 Severe 7 d/yr ≥109°F today · 18 d/yr by 30 yrs out
- Wind 8/10 Severe 80% chance of damaging wind over 30 yrs
- Air quality 3/10 Moderate 3 unhealthy d/yr today · 3 by 30 yrs out
Nearby sold comps map
Loading sold comps map…
Walkable amenities ~0.75 mi
Loading nearby amenities…
Taxation est. · year 1
- Rental income
- $23,524
- − Mortgage interest
- −$11,198
- − Property taxes
- −$2,998
- − Insurance
- −$1,000
- − Repairs & maintenance
- −$1,882
- − Management
- −$1,882
- − Depreciation
- −$5,815
- Taxable loss
- −$1,251
- Est. tax savings @ 24.0%
- +$300
- After-tax cash flow
- $2,306/yr
For passive investors: Depreciation is non-cash, so a rental often shows a tax loss while cash-flowing — sheltering income. Rental losses are passive: they offset passive income freely, and up to $25,000/yr can offset ordinary (W-2) income if you actively participate and your MAGI is under $100k (phasing out to $0 by $150k); unused losses carry forward. On sale, claimed depreciation is recaptured at up to 25%, and gains may owe capital-gains tax (a 1031 exchange can defer both). Figures are a year-1 estimate at your 24.0% rate — not tax advice; consult a CPA.
Condition & rehab AI · 12 photos
This manufactured home requires moderate renovations to improve its condition and increase its value. The kitchen and bathrooms are in poor condition and need major repairs. A new front porch would also significantly improve the home's curb appeal.
Repairs flagged
- Major kitchen cabinets — dated and in poor condition
- Major kitchen countertops — outdated and in poor condition
- Major kitchen appliances — outdated and in poor condition
- Major bathroom fixtures — dated and in poor condition
- Major bathroom tile — dated and in poor condition
- Major front porch — weathered and in need of repair
Value-add opportunities
- Resale new kitchen cabinets, countertops, and appliances — modernizing the kitchen would significantly increase its appeal
- Resale new bathroom fixtures and tile — modernizing the bathrooms would significantly increase its appeal
- Both new front porch — a new front porch would improve curb appeal and increase both resale and rental value
Renovation cost estimate screening
| Repair item | Severity | Est. cost |
|---|---|---|
| kitchen cabinets · dated and in poor condition | Major | $15,000–50,000 |
| kitchen countertops · outdated and in poor condition | Major | $15,000–50,000 |
| kitchen appliances · outdated and in poor condition | Major | $15,000–50,000 |
| bathroom fixtures · dated and in poor condition | Major | $15,000–50,000 |
| bathroom tile · dated and in poor condition | Major | $15,000–50,000 |
| front porch · weathered and in need of repair | Major | $15,000–50,000 |
| Total estimated repair cost · 6 items | $90,000–300,000 |
Value-add ROI direction
- Resale new kitchen cabinets, countertops, and appliances — modernizing the kitchen would significantly increase its appeal ↑
- Resale new bathroom fixtures and tile — modernizing the bathrooms would significantly increase its appeal ↑
- Both new front porch — a new front porch would improve curb appeal and increase both resale and rental value ↑
ⓘ Cost ranges are severity-bucket heuristics (US national rule-of-thumb). Get contractor quotes + a written scope before underwriting a rehab budget.
Schools (NCES district)
- District
- Berkeley 01
- NCES district ID
- 4501170
- Math proficiency
- 35% ▼ -8.00%
- Reading proficiency
- 48% ▼ -2.00%
- Median HH income
- $52,724
- Composite
- 35.95/100
- National rank
- #4799
- State rank
- #30 of 80 in SC
Livability — Bonneau Beach
- Score
- 61/100
- State rank
- #219
- US rank
- #18448
Category grades
Schools grade is shown separately in the Schools card above.
Census & demographics
- Census place
- Bonneau Beach, SC
- Population (ZIP)
- 7,376
Population outlook (Berkeley County) Hauer SSP2
- Today (2025)
- 254,184 people
- By 2030
- 279,677 · +10.0%
- By 2040
- 329,379 · +29.6%
- By 2050
- 375,557 · +47.8%
- By 2075
- 476,740 · +87.6%
- By 2100
- 535,945 · +110.8%
Race, ethnicity, and origin ACS 2023
- Neighborhood character
- Predominantly White (80%)
- Race & ethnicity
- White 80% Black 10% Two or more races 7% Asian 2% Hispanic / Latino 1%
- Common ancestry
- Lithuanian 2% Romanian 1% Slovak 1%
- Foreign-born
- 1% · South Korea
- Languages at home
- 99% English-only · Spanish 1% Chinese 1%
Political lean MEDSL · Berkeley
- 2024 margin
- R (+16.3) · D 41.1% · R 57.4% · Other 1.4%
- 2008→2024 swing
- -3.2pp toward R · 2008: -13.1pp · 2024: -16.3pp
- All cycles
- 2024: R+16.3 2020: R+11.7 2016: R+17.4 2012: R+18.9 2008: R+13.1
Not yet ingested
- Civics
- —
Market trends
- HPI YoY
- ▲ 19.49%
- Current HPI
- 369.104
- Rent YoY
- —
- Metro
- —
- State GDP YoY
- ▲ 4.51%
- F500 in state
- 2
Industry mix (Fortune 500 HQ in SC)
| Industry | F500 HQs | Revenue |
|---|---|---|
| Packaging | 1 | $7B |
|
||
Price history
+447.6% since first listed3 events — show timeline
- 2026-05-07 Listed $230,000 Charleston Trident MLS
- 2010-04-29 Sold (MLS) $42,000 Charleston Trident MLS
- 2010-04-01 Listed $42,000 Charleston Trident MLS
Cash-flow waterfall
monthlySold comps — $/sqft
last 12 mo · ≤1 miLoading sold comps…