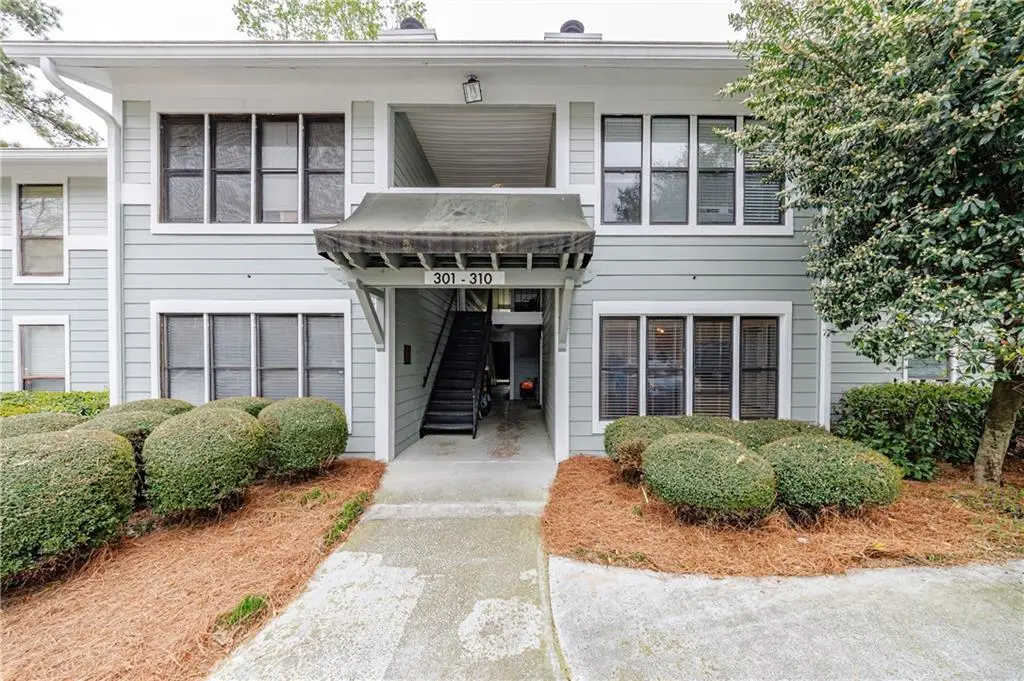
303 Summit North Dr NE · Atlanta, GA
Flood risk 1/10 · Minimal
- FEMA flood zone
- X (unshaded)
- Chance of flooding over 30 yrs
- 0.0%
- Est. flood insurance / yr
- $507 – $1,088
Fire risk 1/10 · Minimal
- Est. fire insurance / yr
- $963 – $1,789
Heat risk 5/10 · Moderate
- Hot days now (above 104°F)
- 7 days/yr
- Hot days in 30 yrs
- 18 days/yr
Wind risk 4/10 · Minor
- Chance of severe wind over 30 yrs
- 21.0%
Air-quality risk 4/10 · Minor
- Unhealthy air days now
- 5 days/yr
- Unhealthy air days in 30 yrs
- 7 days/yr
Risk factors via First Street. Map © Google.
Why this score? — see what drove the D grade
The composite is a weighted blend of 9 inputs, each scored 0–100. Each bar is that input's sub-score; the figure is the points it added to the 100-point composite (weight × sub-score).
- ARV discount +13.9/15.0
- Cash flow +9.0/30.0
- Livability +4.2/5.0
- 1% rule +3.8/10.0
- Schools +2.7/10.0
- DSCR +2.5/10.0
- Rent growth +2.5/5.0
- Condition / age +2.5/5.0
- Appreciation +0.0/10.0
$175,000
🖨 Deal sheet (PDF) 📄 Offer letter ✓ Due diligence
Listing remarks MLS
Gated Buckhead community with all the amenities. Move-in condition. NO STEPS! Park your car less than forty feet from your front door. MARTA, shopping, PATH 400 nearby. Premier location in the community.
Key facts
- Gated community
- Move-in condition
- Premier location
Tags
Neighborhood map
What this means for you Summary
Snapshot
- This is a 1-bed/1.0-bath condo listed at $175k.
Deal economics
- At list price, monthly cash flow is $-137 ($-2k/yr) — negative.
- To cash-flow at today's rent, offer at most $151k (13.8% below list).
- To meet the 1% rule (rent ≥ 1% of price), the offer needs to be $154k (12.2% below list).
- Recommended offer: $151k (13.8% below list) — sets the bar for cash-flow.
- Cap rate 5.4% vs local median 3.1% in Atlanta — top-decile yield for the area; either an underpriced asset or a hidden risk that comps aren't pricing in. Stress-test before assuming the spread holds.
Location & tenants
- Location reads 83/100 on livability (#6 in GA, #919 nationally) — a professional / high-income tenant draw. Strengths: amenities A+, commute A+, housing A+; Watch: schools C-, cost of living C-.
- Atlanta Public Schools (urban): math 28% / reading 35% proficiency, ranked #80 of 174 in GA (top 46%) — families likely to look elsewhere, expect single-tenant / working-renter base with shorter leases; 71% free/reduced lunch — lower-income household profile, screen leases tightly.
- Market conditions: Rents flat; 328 active listings in the ZIP; 40 comparable units currently listed for rent nearby; rentals leasing fast (median 3d on market — plan ~1-2 weeks tenant-placement turnaround); solid renter incomes; 11,565 units permitted in Fulton County in 2024 (8,159 in 5+ unit buildings).
Forward outlook
- Local home prices are declining (-3.0%/yr); year-one equity from $1k of loan paydown is wiped out by about $5k of value loss. Plan a longer hold.
- Fulton County population projected at +38% by 2050 — long-run rental-demand tailwind backs the buy-and-hold thesis.
Negotiation context
- It's been on market 86 days — a 6% lower offer ($164k) is reasonable based on typical stale-listing flexibility.
- 3 sale attempts since 13y ago; this cycle's ask has dropped $20k (10%) from the opening price — seller is motivated, your offer sets the floor, not the list.
- Current owner paid $55k; list at $175k implies a 218% gain — meaningful room to come down on a strong offer.
Risks & watch-outs
- Watch-outs: HOA is 20% of rent.
- Climate carrying-cost: extreme-heat days projected 7→18/yr by 2055 (HVAC capex compounding) — expect insurance premiums to compound above CPI over the hold.
Questions for the listing agent
- What do current leases actually rent for vs. the listed asking? Can we see a recent rent roll and the last 12 months of T-12 income?
- It's been on market 86 days. Have you received any prior offers? Is the seller open to a 14% concession, seller financing, or rate buy-down credit?
- What does the HOA fee cover, when was the last increase, and are there any pending special assessments or reserve-fund shortfalls?
- Any open or pending special assessments — roof, HVAC, plumbing, elevator, façade? What's the per-unit balance and payoff schedule, and is the seller paying it off at close or rolling it to the buyer?
- Why hasn't it sold? Are there any deal-killer items the seller is aware of (foundation, flood, title, zoning, code violations)?
- Is there a deadline driving the sale (1031 exchange, divorce, estate, relocation)? That informs how much negotiation room exists.
- The area grade is low — what's the realistic commute time and amenity access for the typical tenant pool here? Any planned neighborhood developments (good or bad) we should know about?
- What's the average days-on-market for RENTAL listings here right now (not sales)? A rising rental-DOM trend means longer vacancies and softer asking-rent achievability than the comps imply.
- What's the recent tenant-quality profile in this submarket — average credit score on applications, eviction rate, late-payment / NSF rate, and stable-employment percentage? A property-management company in the area should have these aggregated.
- How much new apartment / multifamily construction is in the pipeline within 1–3 miles? Heavy new supply (>2% of stock underway) typically softens rents 12–24 months out; light construction supports rent growth.
Investment metrics
- 1% rule
- 0.88% ✗
- Cap rate
- 5.35%
- Cash-on-cash
- -3.35%
- DSCR
- 0.85
- GRM
- 9.5
CMA / ARV
- ARV (median comp)
- $203,975
- List price
- $175,000
- Delta
- -14.21%
- Verdict
- UNDERPRICED
- Comps
- 20 within 1.0 mi
Projected returns pro-forma
-3.0% appreciation · 0.04% rent growth · sell at horizon
- IRR
- -25.6%
- Equity multiple
- 0.15×
- Total profit
- $-41,416
- Equity at exit
- $26,093
- IRR
- -37.8%
- Equity multiple
- -0.31×
- Total profit
- $-64,041
- Equity at exit
- $15,131
Cash invested: $49,000 (down + closing). Projections, not guarantees.
Landlord ↔ Tenant lean methodology
- Overall (STATE)
- 90 Strongly Landlord-Friendly
- State Georgia
- 90 Strongly Landlord-Friendly · R+3
- County
- — inherits STATE
- City
- — inherits STATE
ZIP-level market 30324
- Rents YoY
- 0.0%
- Active inventory
- 328
- Price-to-rent
- 9.5×
Monthly cashflow live
- Estimated rent
- $1,537 high interval (Pro) →
- Mortgage (P&I)
- −$918
- Tax from tax record
- −$52 /mo · $628/yr
- Insurance
- −$73
- HOA
- −$308
- Vacancy / Maint / Mgmt
- −$323
- Net cashflow
- $-137
Break-even live
Sensitivity live
| Price | -10% $-38 | -5% $-87 | +0% $-137 | +5% $-186 | +10% $-236 |
|---|---|---|---|---|---|
| Rent | -10% $-258 | -5% $-198 | +0% $-137 | +5% $-76 | +10% $-16 |
| Rate | -1.0pp $-49 | -0.5pp $-92 | base $-137 | +0.5pp $-182 | +1.0pp $-228 |
UW: 25.0% down · 7.5% · 30yr · 1.5% tax · 5.0% vac · 8.0% maint · 8.0% mgmt
Financing live
Cash to close
- Down payment
- $43,750
- Closing costs
- $5,250
- Reserves months
- —
- Total cash needed
- —
Loan-product check · same deal, 3 products live
Conventional
25% down · 7.5% · 30yr
- Down + closing
- —
- Monthly P&I
- —
- Monthly cashflow
- —
- DSCR
- —
- Eligible?
- —
Personal DTI + credit; lowest rate.
DSCR
20% down · 8.5% · 30yr
- Down + closing
- —
- Monthly P&I
- —
- Monthly cashflow
- —
- DSCR
- —
- Eligible?
- —
No personal income docs; deal must DSCR.
Hard money
10% down · 12.0% · 12mo
- Down + closing
- —
- Monthly P&I
- —
- Monthly cashflow
- —
- DSCR
- —
- Eligible?
- —
Short-term bridge; refi at stabilization.
Rent comps 40 comps
| Address | Beds | Baths | Sqft | Rent | $/sqft | DOM | Units | Dist |
|---|---|---|---|---|---|---|---|---|
| — Atlanta, GA | 1.0 | 1.0 | 611 | $1,400 | $2.29 | 0d | 1 | 0.02mi |
| 740 Sidney Marcus Blvd NE Atlanta, GA | 1.0–2.0 | 1.0–2.0 | 882 | $1,299 | $1.47 | 0d | 22 | 0.11mi |
| 2700 Pine Tree Rd NE #1115 Atlanta, GA | 1.0 | 1.0 | 784 | $1,695 | $2.16 | 5d | 1 | 0.17mi |
| 2500 Pine Tree Rd NE Atlanta, GA | 1.0–2.0 | 1.0–2.0 | 875 | $1,309 | $1.50 | 25d | 1 | 0.23mi |
| 925 Canterbury Rd NE Atlanta, GA | 1.0–3.0 | 1.0–2.0 | 1331 | $1,369 | $1.03 | 0d | 27 | 0.31mi |
| 2591 Piedmont Rd NE Atlanta, GA | 1.0–2.0 | 1.0–2.0 | 1019 | $1,398 | $1.37 | 0d | 21 | 0.36mi |
| 970 Sidney Marcus Blvd NE #1206 Atlanta, GA | 1.0 | 1.0 | 840 | $1,500 | $1.79 | 5d | 1 | 0.37mi |
| 761 Morosgo Dr NE Atlanta, GA | 2.0 | 1.0–2.0 | 980 | $1,792 | $1.83 | 0d | 18 | 0.39mi |
| 741 Morosgo Dr NE Atlanta, GA | 2.0 | 1.0–2.0 | 965 | $1,789 | $1.85 | 0d | 18 | 0.41mi |
| 711 Cosmopolitan Dr NE Atlanta, GA | 1.0–2.0 | 1.5–2.5 | 1177 | $1,650 | $1.40 | 23d | 4 | 0.46mi |
| 711 Cosmopolitan Dr NE Atlanta, GA | 1.0–2.0 | 1.5–2.0 | 941 | $1,950 | $2.07 | 13d | 2 | 0.46mi |
| 711 Cosmopolitan Dr NE Atlanta, GA | 1.0–2.0 | 1.5–2.0 | 941 | $1,950 | $2.07 | 0d | 2 | 0.46mi |
| 658 Lindbergh Dr NE Atlanta, GA | 1.0–2.0 | 1.0–2.0 | 1022 | $1,756 | $1.72 | 4d | 22 | 0.50mi |
| 207 Lenox Rd NE Unit 207 Atlanta, GA | 2.0 | 2.0 | 1105 | $2,250 | $2.04 | 25d | 1 | 0.50mi |
| 2657 Lenox Rd NE #110 Atlanta, GA | 2.0 | 2.0 | 949 | $1,850 | $1.95 | 25d | 1 | 0.50mi |
| 2657 Lenox Rd NE Atlanta, GA | 2.0 | 2.0 | 949 | $1,850 | $1.95 | 5d | 2 | 0.52mi |
| 2572 Lenox Rd NE Atlanta, GA | 1.0–3.0 | 1.0–2.0 | 936 | $1,175 | $1.26 | 25d | 1 | 0.54mi |
| 2921 Lenox Rd NE Atlanta, GA | 1.0–2.0 | 1.0–2.0 | 1177 | $1,850 | $1.57 | 23d | 2 | 0.55mi |
| 2921 Lenox Rd NE #407 Atlanta, GA | 1.0 | 1.0 | 1000 | $2,000 | $2.00 | 18d | 1 | 0.55mi |
| 2567 Lenox Rd NE Unit 165 L Atlanta, GA | 1.0 | 1.0 | 650 | $1,400 | $2.15 | 25d | 1 | 0.56mi |
| 2399 Parkland Dr NE Atlanta, GA | 2.0 | 1.0–2.0 | 935 | $1,602 | $1.71 | 0d | 52 | 0.57mi |
| 2400 Parkland Dr NE Atlanta, GA | 1.0–3.0 | 1.0–2.0 | 1027 | $1,459 | $1.42 | 0d | 16 | 0.60mi |
| 508 Main St NE Atlanta, GA | 1.0–2.0 | 1.0–2.0 | 871 | $1,419 | $1.63 | 0d | 25 | 0.60mi |
| 2380 Strathmore Dr NE Atlanta, GA | 2.0 | 1.0 | 1116 | $2,400 | $2.15 | 25d | 1 | 0.64mi |
| 2450 Camellia Ln NE Atlanta, GA | 1.0–2.0 | 1.0–2.0 | 911 | $1,254 | $1.38 | 0d | 29 | 0.68mi |
| 24307 Plantation Dr NE Atlanta, GA | 1.0 | 1.0 | 816 | $1,995 | $2.44 | 16d | 1 | 0.68mi |
| 2323 Piedmont Rd NE Atlanta, GA | 1.0–2.0 | 1.0–2.0 | 984 | $1,649 | $1.67 | 0d | 30 | 0.69mi |
| 2430 Cheshire Bridge Rd NE Atlanta, GA | 2.0 | 1.0–2.0 | 1001 | $2,060 | $2.06 | 0d | 10 | 0.74mi |
| 485 Lindbergh Pl NE Atlanta, GA | 2.0 | 1.0–2.0 | 918 | $1,635 | $1.78 | 0d | 30 | 0.74mi |
| 505 Pharr Rd NE Atlanta, GA | 1.0–2.0 | 1.0–2.0 | 720 | $1,058 | $1.47 | 25d | 9 | 0.81mi |
| 505 Pharr Rd NE Atlanta, GA | 1.0–2.0 | 1.0–2.0 | 720 | $1,199 | $1.67 | 4d | 4 | 0.81mi |
| 2716 Buford Hwy NE Atlanta, GA | 2.0 | 1.0 | 595 | $1,500 | $2.52 | 25d | 1 | 0.89mi |
| 400 Pharr Rd NE Atlanta, GA | 2.0 | 1.0–2.0 | 906 | $1,918 | $2.12 | 0d | 17 | 0.92mi |
| 530 E Paces Ferry Rd NE Atlanta, GA | 3.0 | 1.0–2.5 | 1193 | $2,306 | $1.93 | 0d | 28 | 0.94mi |
| 1680 Chantilly Dr NE Atlanta, GA | 1.0–2.0 | 1.0–2.0 | 800 | $1,077 | $1.35 | 0d | 19 | 0.94mi |
| 350 Peachtree Hills Ave NE Atlanta, GA | 1.0–2.0 | 1.0–2.0 | 950 | $1,400 | $1.47 | 0d | 27 | 0.94mi |
| 395 Pharr Rd NE #308 Atlanta, GA | 1.0 | 1.0 | 750 | $1,600 | $2.13 | 0d | 1 | 0.97mi |
| 370 Peachtree Hills Ave NE Atlanta, GA | 2.0 | 1.0 | 950 | $1,322 | $1.39 | 4d | 4 | 0.97mi |
| 3097 Maple Dr NE Atlanta, GA | 2.0 | 1.0–2.0 | 880 | $1,804 | $2.05 | 0d | 17 | 0.98mi |
| 1155 Lavista Rd NE Atlanta, GA | 2.0–3.0 | 2.0 | 1180 | $2,038 | $1.73 | 3d | 16 | 0.98mi |
HOA detail condo
- Monthly dues
- $308 · $3,696/yr
- Likely covers
- security
- Assessments
- None detected in remarks — confirm with the listing agent.
Listing history 25 events
-
2026-06-21days on market $175,000 Active 86 DOM
-
2026-06-18days on market $175,000 Active 83 DOM
-
2026-06-17days on market $175,000 Active 82 DOM
-
2026-06-16days on market $175,000 Active 81 DOM
-
2026-06-15days on market $175,000 Active 80 DOM
-
2026-06-13days on market $175,000 Active 78 DOM
-
2026-06-13days on market $175,000 Active 77 DOM
-
2026-06-09days on market $175,000 Active 74 DOM
-
2026-06-08days on market $175,000 Active 73 DOM
-
2026-06-07days on market $175,000 Active 72 DOM
-
2026-06-04days on market $175,000 Active 69 DOM
-
2026-06-03days on market $175,000 Active 68 DOM
-
2026-06-02days on market $175,000 Active 67 DOM
-
2026-06-02price $175,000 Active 66 DOM
-
2026-06-01days on market $195,000 Active 66 DOM
-
2026-05-31days on market $195,000 Active 65 DOM
-
2026-03-27$195,000 New 203-char remark
Show marketing remark (203 chars)
Gated Buckhead community with all the amenities. Move-in condition. NO STEPS! Park your car less than forty feet from your front door. MARTA, shopping, PATH 400 nearby. Premier location in the community.
-
2026-03-27$195,000 Active 203-char remark
Show marketing remark (203 chars)
Gated Buckhead community with all the amenities. Move-in condition. NO STEPS! Park your car less than forty feet from your front door. MARTA, shopping, PATH 400 nearby. Premier location in the community.
-
2013-05-29price $50,000
-
2013-05-22soldstatus $55,000
-
2013-05-14soldstatus $55,000 Sold
-
2013-05-14price $55,000
-
2013-02-27historical Pending Approval
-
2013-02-19$50,000 New
-
2001-12-03soldstatus $110,233
ⓘ Source: listings_history table (triggers on properties + properties_extension) + one-shot
backfill from property_details.listing_events for pre-trigger history.
Tax reassessment forecast GA · Resets to sale price
- Current annual tax
- $628 · $52/mo
- Projected year-2 tax
- $1,610 · $134/mo
- Expected delta
- +$982/yr (+$82/mo · 156.5%)
ⓘ Screening estimate from a state-policy table — verify with the county assessor before closing.
Climate risk First Street
- Flood 1/10 Low FEMA zone X (unshaded) · 0% chance over 30 yrs
- Wildfire 1/10 Low
- Heat 5/10 Major 7 d/yr ≥104°F today · 18 d/yr by 30 yrs out
- Wind 4/10 Moderate 21% chance of damaging wind over 30 yrs
- Air quality 4/10 Moderate 5 unhealthy d/yr today · 7 by 30 yrs out
Nearby sold comps map
Loading sold comps map…
Walkable amenities ~0.75 mi
Loading nearby amenities…
Taxation est. · year 1
- Rental income
- $18,440
- − Mortgage interest
- −$9,803
- − Property taxes
- −$628
- − Insurance
- −$875
- − Repairs & maintenance
- −$1,475
- − Management
- −$1,475
- − HOA
- −$3,696
- − Depreciation
- −$5,091
- Taxable loss
- −$4,603
- Est. tax savings @ 24.0%
- +$1,105
- After-tax cash flow
- $-539/yr
For passive investors: Depreciation is non-cash, so a rental often shows a tax loss while cash-flowing — sheltering income. Rental losses are passive: they offset passive income freely, and up to $25,000/yr can offset ordinary (W-2) income if you actively participate and your MAGI is under $100k (phasing out to $0 by $150k); unused losses carry forward. On sale, claimed depreciation is recaptured at up to 25%, and gains may owe capital-gains tax (a 1031 exchange can defer both). Figures are a year-1 estimate at your 24.0% rate — not tax advice; consult a CPA.
Schools (NCES district)
- District
- Atlanta Public Schools
- NCES district ID
- 1300120
- Math proficiency
- 28% ▼ -6.00%
- Reading proficiency
- 35% ▼ -2.00%
- Median HH income
- $48,306
- Composite
- 27.27/100
- National rank
- #7006
- State rank
- #80 of 174 in GA
Livability — Atlanta
- Score
- 83/100
- State rank
- #6
- US rank
- #919
Category grades
Schools grade is shown separately in the Schools card above.
Census & demographics
- Census place
- Atlanta, GA
- County
- Fulton County · 1,094,430 people
- City population
- 629,525
- Metro
- Atlanta-Sandy Springs-Alpharetta, GA
- Population (ZIP)
- 29,073
- Household income
- $92,122
- Rent vs Own
- Severe rent burden
- 2749.0
Population outlook (Fulton County) Hauer SSP2
- Today (2025)
- 1,203,707 people
- By 2030
- 1,299,706 · +8.0%
- By 2040
- 1,488,256 · +23.6%
- By 2050
- 1,664,580 · +38.3%
- By 2075
- 2,036,072 · +69.2%
- By 2100
- 2,222,402 · +84.6%
Race, ethnicity, and origin ACS 2023
- Neighborhood character
- Diverse neighborhood (Simpson 0.66)
- Race & ethnicity
- White 51% Black 24% Asian 12% Two or more races 9% Hispanic / Latino 8%
- Hispanic origin (detail)
- Mexican 3% Puerto Rican 1%
- Common ancestry
- Lithuanian 3% Italian 2% Serbian 2%
- Foreign-born
- 17% · Canada, China, Jamaica
- Languages at home
- 80% English-only · Spanish 5% Other Indo-European 4% Other Asian/Pacific 3%
Political lean MEDSL · Fulton
- 2024 margin
- Solid D (+44.9) · D 71.9% · R 27.0% · Other 1.1%
- 2008→2024 swing
- +9.8pp toward D · 2008: 35.0pp · 2024: 44.9pp
- All cycles
- 2024: D+44.9 2020: D+46.4 2016: D+42.1 2012: D+29.6 2008: D+35.0
Not yet ingested
- Civics
- —
Market trends
- HPI YoY
- ▼ -476.16%
- Current HPI
- 187.7587
- Rent YoY
- ▬ 0.04%
- Metro
- Atlanta-Sandy Springs-Alpharetta, GA
- State GDP YoY
- ▲ 2.66%
- F500 in state
- 28
Industry mix (Fortune 500 HQ in GA)
| Industry | F500 HQs | Revenue |
|---|---|---|
| Paper / Packaging | 2 | $29B |
|
||
| Retail | 1 | $160B |
|
||
| Transportation / Logistics | 1 | $91B |
|
||
| Airlines | 1 | $62B |
|
||
| Consumer Goods | 1 | $47B |
|
||
| Utilities | 1 | $25B |
|
||
Price history
+76.9% since first listed9 events — show timeline
- 2026-03-27 Listed $195,000 FMLS
- 2026-03-27 Listed $195,000 GAMLS
- 2013-05-29 Price Changed $50,000 GAMLS
- 2013-05-22 Sold (Public Records) $55,000 Public Records
- 2013-05-14 Sold (MLS) $55,000 GAMLS
- 2013-05-14 Price Changed $55,000 GAMLS
- 2013-02-27 Contingent — GAMLS
- 2013-02-19 Listed $50,000 GAMLS
- 2001-12-03 Sold (Public Records) $110,233 Public Records
Property tax history
-3.3%/yrLatest (2025): $628 · -17.9% YoY. Source: county tax records.
Cash-flow waterfall
monthlySold comps — $/sqft
last 12 mo · ≤1 miLoading sold comps…