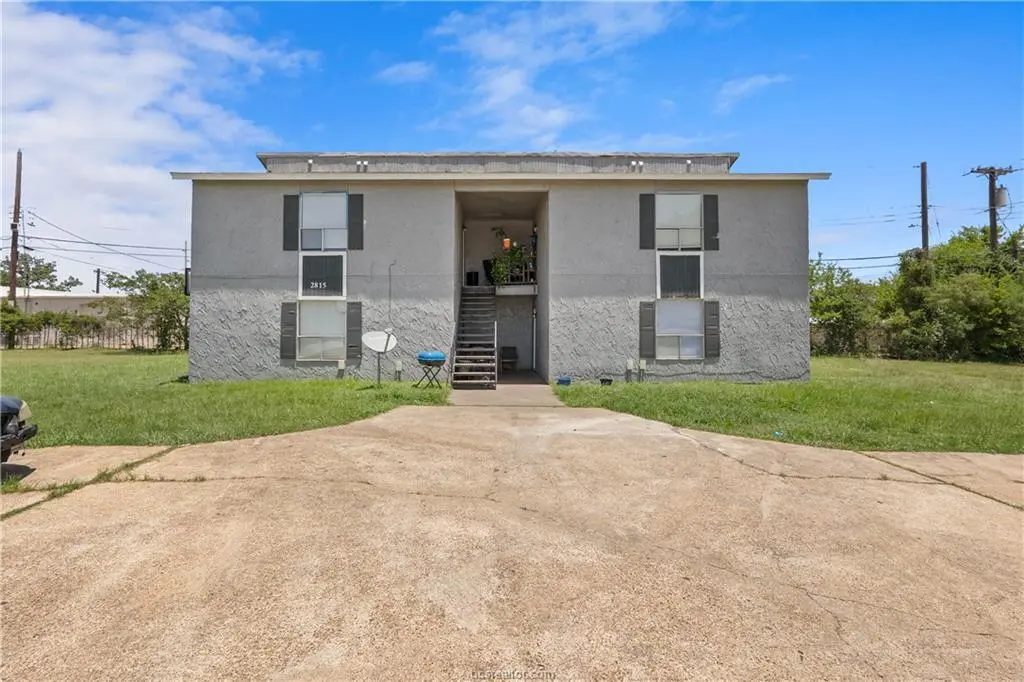
 Fourplex
2815 Cypress Bend Cir · Bryan, TX
Flood risk 1/10 · Minimal
- FEMA flood zone
- X (unshaded)
- Chance of flooding over 30 yrs
- 0.0%
- Est. flood insurance / yr
- $507 – $1,088
Fire risk 4/10 · Minor
- Est. fire insurance / yr
- $1,222 – $2,270
Heat risk 8/10 · Major
- Hot days now (above 110°F)
- 7 days/yr
- Hot days in 30 yrs
- 24 days/yr
Wind risk 8/10 · Major
- Chance of severe wind over 30 yrs
- 80.0%
Air-quality risk 1/10 · Minimal
- Unhealthy air days now
- 0 days/yr
- Unhealthy air days in 30 yrs
- 0 days/yr
Risk factors via First Street. Map © Google.
Why this score? — see what drove the C+ grade
The composite is a weighted blend of 9 inputs, each scored 0–100. Each bar is that input's sub-score; the figure is the points it added to the 100-point composite (weight × sub-score).
- Cash flow +26.4/30.0
- DSCR +9.0/10.0
- ARV discount +8.1/15.0
- 1% rule +7.3/10.0
- Livability +3.8/5.0
- Rent growth +2.7/5.0
- Schools +2.6/10.0
- Condition / age +2.5/5.0
- Appreciation +0.0/10.0
$337,500
🖨 Deal sheet 📄 Offer letter ✓ Due diligence
Multi-family units
County records classify this as Multi-Family (2-4 Unit). Listing-text estimate: 4 units. confirmed
Listing remarks MLS
Attention Investors! Come check out this fourplex that has great rental potential. Only one unit currently vacant and has been made ready/updated and are listed for lease. Only blocks from the neighborhood park and schools and easy access to Harvey Mitchell Parkway and Villa Maria. Washer and dryer connections in-unit. Owner maintains the lawn.
Key facts
- Updated units
- Neighborhood park
- 0.26 acre lot
Tags
Neighborhood map
What this means for you Summary
Snapshot
- This is a 4 × 2-bed/1.0-bath units multifamily listed at $338k.
Deal economics
- At list price, monthly cash flow is $882 ($11k/yr) — positive. Per door: $221/mo.
- The deal already cash-flows at list — no discount required.
- Meets the 1% rule at list price ($4k rent vs $338k).
- Recommended offer: $297k (12.0% below list) — sets the bar for market timing.
- Cap rate 9.4% vs local median 4.0% in Bryan — top-decile yield for the area; either an underpriced asset or a hidden risk that comps aren't pricing in. Stress-test before assuming the spread holds.
Location & tenants
- Location reads 76/100 on livability (#99 in TX, #3,341 nationally) — a middle-class / working-renter tenant base. Strengths: cost of living A+, housing A+, health & safety A+; Watch: schools C-, crime C-, amenities C-.
- Bryan ISD (urban): math 30% / reading 32% proficiency, ranked #608 of 826 in TX (top 74%) — families likely to look elsewhere, expect single-tenant / working-renter base with shorter leases; 68% free/reduced lunch — lower-income household profile, screen leases tightly.
- Market conditions: Rents flat; 122 active listings in the ZIP; lower-income renter base — watch delinquency; 2,211 units permitted in Brazos County in 2024 (768 in 5+ unit buildings).
- At $4,140/mo this rent would consume 125% of the median local household income ($40k/yr) (locally 1465% of renters already pay >50% of income on rent) — very limited rent-growth headroom before tenants either downsize or default.
Forward outlook
- Local home prices are declining (-3.0%/yr); year-one equity from $2k of loan paydown is wiped out by about $10k of value loss. Plan a longer hold.
- Brazos County population projected at +55% by 2050 — long-run rental-demand tailwind backs the buy-and-hold thesis.
Negotiation context
- It's been on market 275 days — a 12% lower offer ($297k) is reasonable based on typical stale-listing flexibility.
- 8 sale attempts since 13y ago with the ask held roughly flat each time — persistent listings suggest the price (not the market) is what's stuck; bring a comps-based counter.
Risks & watch-outs
- Climate carrying-cost: severe wind risk, 80% chance of damaging wind over 30y; extreme-heat days projected 7→24/yr by 2055 (HVAC capex compounding) — expect insurance premiums to compound above CPI over the hold.
Questions for the listing agent
- It's been on market 275 days. Have you received any prior offers? Is the seller open to a 12% concession, seller financing, or rate buy-down credit?
- Can we see the unit-by-unit rent roll, current vacancy, and any below-market leases? What's the average tenancy length?
- What capital expenditures (roof, boiler, parking lot, exteriors) have been made in the last 5 years, and what's planned in the next 2?
- Built in 1979 — when were the roof, HVAC, electrical panel, plumbing, and water heater last replaced?
- Why hasn't it sold? Are there any deal-killer items the seller is aware of (foundation, flood, title, zoning, code violations)?
- Is there a deadline driving the sale (1031 exchange, divorce, estate, relocation)? That informs how much negotiation room exists.
- What's the average days-on-market for RENTAL listings here right now (not sales)? A rising rental-DOM trend means longer vacancies and softer asking-rent achievability than the comps imply.
- What's the recent tenant-quality profile in this submarket — average credit score on applications, eviction rate, late-payment / NSF rate, and stable-employment percentage? A property-management company in the area should have these aggregated.
- How much new apartment / multifamily construction is in the pipeline within 1–3 miles? Heavy new supply (>2% of stock underway) typically softens rents 12–24 months out; light construction supports rent growth.
Investment metrics
- 1% rule
- 1.23% ✓
- Cap rate
- 9.43%
- Cash-on-cash
- 11.20%
- DSCR
- 1.50
- GRM
- 6.8
CMA / ARV
- ARV (median comp)
- $342,086
- List price
- $337,500
- Delta
- -1.34%
- Verdict
- FAIR
- Comps
- 4 within 1.0 mi
Show comp detail 2 sales within ~0.75 mi
| Address | Dist | Beds/Ba | Sqft | Sold | Price | $/sf | Match |
|---|---|---|---|---|---|---|---|
| 2702 Evergreen Cir | 0.20mi | 8/4.0 | 3,156 (0%) | 2mo | $310,000 | $98 | 89 |
| 2705 Evergreen Cir | 0.15mi | 8/1.0 | 3,156 (0%) | 20mo | $338,500 | $107 | 64 |
Match score weights: distance 35% · size 25% · config 20% · recency 20%. Top-matched comps best support the ARV.
Projected returns pro-forma
-3.0% appreciation · 0.99% rent growth · sell at horizon
- IRR
- -1.9%
- Equity multiple
- 0.93×
- Total profit
- $-6,604
- Equity at exit
- $50,322
- IRR
- 5.5%
- Equity multiple
- 1.37×
- Total profit
- $34,654
- Equity at exit
- $29,181
Cash invested: $94,500 (down + closing). Projections, not guarantees.
Landlord ↔ Tenant lean methodology
- Overall (STATE)
- 87 Strongly Landlord-Friendly
- State Texas
- 87 Strongly Landlord-Friendly · R+5
- County
- — inherits STATE
- City
- — inherits STATE
ZIP-level market 77801
- Home prices YoY
- -16.8%
- Rents YoY
- 1.0%
- Active inventory
- 122
- Price-to-rent
- 27.2×
Monthly cashflow live
- Estimated rent
- $4,140 high interval (Pro) →
- Mortgage (P&I)
- −$1,770
- Tax from tax record
- −$478 /mo · $5,733/yr
- Insurance
- −$141
- HOA
- −$0
- Vacancy / Maint / Mgmt
- −$869
- Net cashflow
- $882
Break-even live
4-unit breakdown (identical units grouped — click to expand)
| Units | Beds | Baths | Est. rent |
|---|---|---|---|
| 4× units | 2 | 1 | $4,140 |
| #1 | 2 | 1 | $1,035 |
| #2 | 2 | 1 | $1,035 |
| #3 | 2 | 1 | $1,035 |
| #4 | 2 | 1 | $1,035 |
| Total (4 units) | $4,140 | ||
UW: 25.0% down · 7.5% · 30yr · 1.5% tax · 5.0% vac · 8.0% maint · 8.0% mgmt
Financing live
Cash to close
- Down payment
- $84,375
- Closing costs
- $10,125
- Reserves months
- —
- Total cash needed
- —
Loan-product check · same deal, 3 products live
Conventional
25% down · 7.5% · 30yr
- Down + closing
- —
- Monthly P&I
- —
- Monthly cashflow
- —
- DSCR
- —
- Eligible?
- —
Personal DTI + credit; lowest rate.
DSCR
20% down · 8.5% · 30yr
- Down + closing
- —
- Monthly P&I
- —
- Monthly cashflow
- —
- DSCR
- —
- Eligible?
- —
No personal income docs; deal must DSCR.
Hard money
10% down · 12.0% · 12mo
- Down + closing
- —
- Monthly P&I
- —
- Monthly cashflow
- —
- DSCR
- —
- Eligible?
- —
Short-term bridge; refi at stabilization.
Listing history 36 events
-
2026-06-18days on market $337,500 Active 275 DOM
-
2026-06-17days on market $337,500 Active 274 DOM
-
2026-06-16days on market $337,500 Active 273 DOM
-
2026-06-15days on market $337,500 Active 272 DOM
-
2026-06-14days on market $337,500 Active 270 DOM
-
2026-06-13days on market $337,500 Active 269 DOM
-
2026-06-10days on market $337,500 Active 267 DOM
-
2026-06-09days on market $337,500 Active 266 DOM
-
2026-06-08days on market $337,500 Active 265 DOM
-
2026-06-07days on market $337,500 Active 264 DOM
-
2026-06-03days on market $337,500 Active 260 DOM
-
2026-06-02days on market $337,500 Active 259 DOM
-
2026-06-01days on market $337,500 Active 258 DOM
-
2026-05-31days on market $337,500 Active 257 DOM
-
2026-05-30days on market $337,500 Active 256 DOM
-
2025-09-16$337,500 Active 346-char remark
Show marketing remark (346 chars)
Attention Investors! Come check out this fourplex that has great rental potential. Only one unit currently vacant and has been made ready/updated and are listed for lease. Only blocks from the neighborhood park and schools and easy access to Harvey Mitchell Parkway and Villa Maria. Washer and dryer connections in-unit. Owner maintains the lawn.
-
2025-03-17soldstatus
-
2025-02-16status Active
-
2024-12-12$359,900 Active
-
2023-05-02soldstatus Closed
-
2023-04-01status Pending
-
2023-03-09status Active
-
2023-02-16status Pending
-
2023-02-08status Active
-
2023-02-02status Pending
-
2023-01-29status Active
-
2022-12-16status Pending
-
2022-12-06$256,000 Active
-
2022-07-29price $725
-
2017-11-07soldstatus
-
2014-01-24soldstatus
-
2014-01-22soldstatus
-
2013-04-18$89,900
-
2011-09-26soldstatus
-
2011-09-26soldstatus
-
2006-03-22soldstatus
ⓘ Source: listings_history table (triggers on properties + properties_extension) + one-shot
backfill from property_details.listing_events for pre-trigger history.
Tax reassessment forecast TX · Resets to sale price
- Current annual tax
- $5,733 · $478/mo
- Projected year-2 tax
- $6,176 · $515/mo
- Expected delta
- +$443/yr (+$37/mo · 7.7%)
ⓘ Screening estimate from a state-policy table — verify with the county assessor before closing.
Climate risk First Street
- Flood 1/10 Low FEMA zone X (unshaded) · 0% chance over 30 yrs
- Wildfire 4/10 Moderate
- Heat 8/10 Severe 7 d/yr ≥110°F today · 24 d/yr by 30 yrs out
- Wind 8/10 Severe 80% chance of damaging wind over 30 yrs
- Air quality 1/10 Low 0 unhealthy d/yr today · 0 by 30 yrs out
Nearby sold comps map
Loading sold comps map…
Walkable amenities ~0.75 mi
Loading nearby amenities…
Taxation est. · year 1
- Rental income
- $49,680
- − Mortgage interest
- −$18,905
- − Property taxes
- −$5,733
- − Insurance
- −$1,688
- − Repairs & maintenance
- −$3,974
- − Management
- −$3,974
- − Depreciation
- −$9,818
- Taxable income
- $5,587
- Est. tax owed @ 24.0%
- −$1,341
- After-tax cash flow
- $9,247/yr
For passive investors: Depreciation is non-cash, so a rental often shows a tax loss while cash-flowing — sheltering income. Rental losses are passive: they offset passive income freely, and up to $25,000/yr can offset ordinary (W-2) income if you actively participate and your MAGI is under $100k (phasing out to $0 by $150k); unused losses carry forward. On sale, claimed depreciation is recaptured at up to 25%, and gains may owe capital-gains tax (a 1031 exchange can defer both). Figures are a year-1 estimate at your 24.0% rate — not tax advice; consult a CPA.
Schools (NCES district)
- District
- Bryan ISD
- NCES district ID
- 4811790
- Math proficiency
- 30% ▼ -8.00%
- Reading proficiency
- 32% ▼ -3.00%
- Median HH income
- $41,895
- Composite
- 26.26/100
- National rank
- #7253
- State rank
- #608 of 826 in TX
Livability — Bryan
- Score
- 76/100
- State rank
- #99
- US rank
- #3341
Category grades
Schools grade is shown separately in the Schools card above.
Census & demographics
- Census place
- Bryan, TX
- County
- Brazos County · 233,400 people
- City population
- 101,772
- Metro
- College Station-Bryan, TX
- Population (ZIP)
- 15,461
- Household income
- $39,846
- Rent vs Own
- Severe rent burden
- 1465.0
Population outlook (Brazos County) Hauer SSP2
- Today (2025)
- 267,942 people
- By 2030
- 296,630 · +10.7%
- By 2040
- 354,560 · +32.3%
- By 2050
- 414,616 · +54.7%
- By 2075
- 562,158 · +109.8%
- By 2100
- 678,828 · +153.3%
Race, ethnicity, and origin ACS 2023
- Neighborhood character
- Diverse neighborhood (Simpson 0.68)
- Race & ethnicity
- Hispanic / Latino 41% White 34% Black 17% Two or more races 13% Asian 4% Native American 2%
- Hispanic origin (detail)
- Mexican 34%
- Common ancestry
- Slovak 2% Lithuanian 1% Italian 1%
- Foreign-born
- 16% · Canada
- Languages at home
- 68% English-only · Spanish 26% Other Indo-European 2% French/Haitian/Cajun 2%
Political lean MEDSL · Brazos
- 2024 margin
- Strong R (+24.9) · D 36.9% · R 61.7% · Other 1.4%
- 2008→2024 swing
- +4.1pp toward D · 2008: -28.9pp · 2024: -24.9pp
- All cycles
- 2024: R+24.9 2020: R+14.3 2016: R+23.7 2012: R+35.3 2008: R+28.9
Not yet ingested
- Civics
- —
Market trends
- HPI YoY
- ▼ -54.39%
- Current HPI
- 269.7483
- Rent YoY
- ▲ 0.99%
- Metro
- College Station-Bryan, TX
- State GDP YoY
- ▲ 3.95%
- F500 in state
- 110
Industry mix (Fortune 500 HQ in TX)
| Industry | F500 HQs | Revenue |
|---|---|---|
| Energy | 16 | $1,198B |
|
||
| Technology | 5 | $198B |
|
||
| Engineering / Construction | 4 | $72B |
|
||
| Energy Services | 3 | $60B |
|
||
| Utilities | 3 | $41B |
|
||
| Healthcare | 2 | $330B |
|
||
Price history
+275.4% since first listed21 events — show timeline
- 2025-09-16 Listed $337,500 BCSRMLS
- 2025-03-17 Sold (Public Records) — Public Records
- 2025-02-16 Relisted — BCSRMLS
- 2024-12-12 Listed $359,900 BCSRMLS
- 2023-05-02 Sold (MLS) — BCSRMLS
- 2023-04-01 Pending — BCSRMLS
- 2023-03-09 Relisted — BCSRMLS
- 2023-02-16 Pending — BCSRMLS
- 2023-02-08 Relisted — BCSRMLS
- 2023-02-02 Pending — BCSRMLS
- 2023-01-29 Relisted — BCSRMLS
- 2022-12-16 Pending — BCSRMLS
- 2022-12-06 Listed $256,000 BCSRMLS
- 2022-07-29 Price Changed $725 RENT.
- 2017-11-07 Sold (Public Records) — Public Records
- 2014-01-24 Sold (Public Records) — Public Records
- 2014-01-22 Sold (MLS) — BCSRMLS
- 2013-04-18 Listed $89,900 BCSRMLS
- 2011-09-26 Sold (Public Records) — Public Records
- 2011-09-26 Sold (Public Records) — Public Records
- 2006-03-22 Sold (Public Records) — Public Records
Property tax history
+9.5%/yrLatest (2025): $5,733 · +20.0% YoY. Source: county tax records.
Cash-flow waterfall
monthlySold comps — $/sqft
last 12 mo · ≤1 miLoading sold comps…