 Multi-family
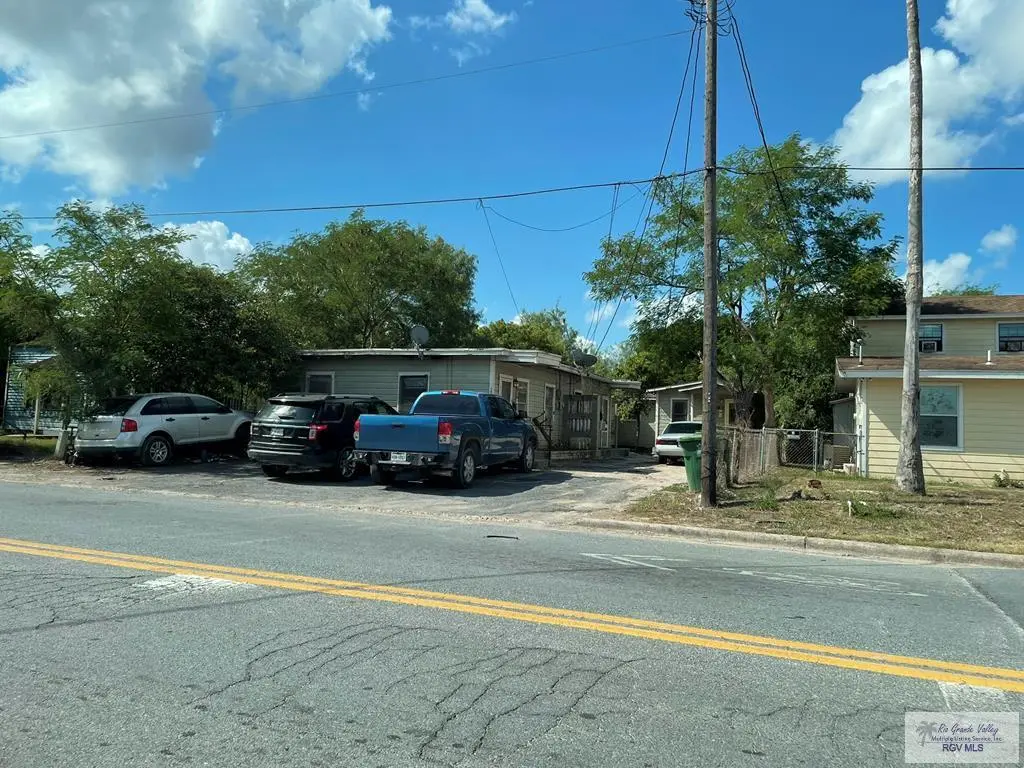
158 Hortencia Blvd #10 · Brownsville, TX
Flood risk 1/10 · Minimal
- FEMA flood zone
- X (unshaded)
- Chance of flooding over 30 yrs
- 0.0%
- Est. flood insurance / yr
- $507 – $1,088
Fire risk 1/10 · Minimal
- Est. fire insurance / yr
- $1,222 – $2,270
Heat risk 9/10 · Severe
- Hot days now (above 111°F)
- 7 days/yr
- Hot days in 30 yrs
- 26 days/yr
Wind risk 9/10 · Severe
- Chance of severe wind over 30 yrs
- 99.0%
Air-quality risk 3/10 · Minor
- Unhealthy air days now
- 2 days/yr
- Unhealthy air days in 30 yrs
- 3 days/yr
Risk factors via First Street. Map © Google.
Why this score? — see what drove the B- grade
The composite is a weighted blend of 9 inputs, each scored 0–100. Each bar is that input's sub-score; the figure is the points it added to the 100-point composite (weight × sub-score).
- Cash flow +30.0/30.0
- 1% rule +10.0/10.0
- DSCR +10.0/10.0
- ARV discount +5.8/15.0
- Rent growth +4.5/5.0
- Livability +4.0/5.0
- Schools +2.2/10.0
- Condition / age +1.0/5.0
- Appreciation +0.0/10.0
$150,000
🖨 Deal sheet 📄 Offer letter ✓ Due diligence
Multi-family units
County records classify this as Multi-Family (2-4 Unit). Listing-text estimate: 1 unit. estimate disagrees with records
Listing remarks MLS
Reduced Price. Great Investment Opportunity in Brownsville! This multi-family property features two buildings with a total of 4 units (2 units per building). All 4 apartments are currently rented, providing steady income from day one. The property is being sold AS-IS. Appliances are not included. Located in a prime area, the buildings are close to major avenues such as International Blvd and Boca Chica Blvd, with easy access to the Brownsville Airport, schools, shopping, and dining. Conveniently situated near the main road to South Padre Island and SpaceX, this location makes it highly attractive for tenants and investors alike. Don't miss your chance to own this fully occupied income-producing property in one of Brownsville's most accessible locations
Key facts
- 4 units
- Near schools
- Near shopping
Tags
Neighborhood map
What this means for you Summary
Snapshot
- This is a multifamily listed at $150k. Condition is rated poor.
Deal economics
- At list price, monthly cash flow is $3k ($32k/yr) — positive.
- The deal already cash-flows at list — no discount required.
- Meets the 1% rule at list price ($5k rent vs $150k).
- Recommended offer: $132k (12.0% below list) — sets the bar for market timing.
- Cap rate 27.7% vs local median 5.0% in Brownsville — top-decile yield for the area; either an underpriced asset or a hidden risk that comps aren't pricing in. Stress-test before assuming the spread holds.
Location & tenants
- Location reads 79/100 on livability (#62 in TX, #2,311 nationally) — a middle-class / working-renter tenant base. Strengths: commute A+, cost of living A+, housing A+; Watch: schools C-, amenities D, crime D-.
- Brownsville ISD (urban): math 20% / reading 34% proficiency, ranked #710 of 826 in TX (top 86%) — low school quality limits family demand, transient renter base, plan for 1-2y turnover; 83% free/reduced lunch — lower-income household profile, screen leases tightly.
- Market conditions: Rents rising fast (+8.2%/yr); 365 active listings in the ZIP; 1 comparable units currently listed for rent nearby; lower-income renter base — watch delinquency; 2,326 units permitted in Cameron County in 2024 (503 in 5+ unit buildings).
- At $4,702/mo this rent would consume 127% of the median local household income ($45k/yr) (locally 2682% of renters already pay >50% of income on rent) — very limited rent-growth headroom before tenants either downsize or default.
Forward outlook
- Local home prices are declining (-3.0%/yr); year-one equity from $1k of loan paydown is wiped out by about $4k of value loss. Plan a longer hold.
- Cameron County population projected at +3% by 2050 — modest demand growth; plan on rents tracking national, not racing it.
- At projected returns (-3.0% appreciation + 8.0% rent growth), your $42k cash investment doubles in ~2 years — after that, you're playing with house money.
Negotiation context
- It's been on market 270 days — a 12% lower offer ($132k) is reasonable based on typical stale-listing flexibility.
- 2 sale attempts; this cycle's ask has dropped $25k (14%) from the opening price — seller is motivated, your offer sets the floor, not the list.
Risks & watch-outs
- Climate carrying-cost: severe wind risk, 99% chance of damaging wind over 30y; extreme-heat days projected 7→26/yr by 2055 (HVAC capex compounding) — expect insurance premiums to compound above CPI over the hold.
Questions for the listing agent
- It's been on market 270 days. Have you received any prior offers? Is the seller open to a 12% concession, seller financing, or rate buy-down credit?
- Have any recent inspections been done? Can we get a copy of the seller's disclosures and any deferred-maintenance estimates?
- Built in 1970 — when were the roof, HVAC, electrical panel, plumbing, and water heater last replaced?
- Why hasn't it sold? Are there any deal-killer items the seller is aware of (foundation, flood, title, zoning, code violations)?
- Is there a deadline driving the sale (1031 exchange, divorce, estate, relocation)? That informs how much negotiation room exists.
- Crime grade is D in this area — have there been break-ins, vandalism, or insurance claims at this property in the last 3 years? What carrier currently insures it and at what premium?
- What's the average days-on-market for RENTAL listings here right now (not sales)? A rising rental-DOM trend means longer vacancies and softer asking-rent achievability than the comps imply.
- What's the recent tenant-quality profile in this submarket — average credit score on applications, eviction rate, late-payment / NSF rate, and stable-employment percentage? A property-management company in the area should have these aggregated.
- How much new apartment / multifamily construction is in the pipeline within 1–3 miles? Heavy new supply (>2% of stock underway) typically softens rents 12–24 months out; light construction supports rent growth.
Investment metrics
- 1% rule
- 3.13% ✓
- Cap rate
- 27.72%
- Cash-on-cash
- 76.51%
- DSCR
- 4.40
- GRM
- 2.7
CMA / ARV
- ARV (median comp)
- $144,547
- List price
- $150,000
- Delta
- 3.77%
- Verdict
- FAIR
- Comps
- 3 within 2.0 mi
Show comp detail 1 sale within ~0.75 mi
| Address | Dist | Beds/Ba | Sqft | Sold | Price | $/sf | Match |
|---|---|---|---|---|---|---|---|
| 1447 Lincoln Dr | 0.58mi | —/— | 2,762 (-8%) | 1mo | $109,995 | $40 | 59 |
Match score weights: distance 35% · size 25% · config 20% · recency 20%. Top-matched comps best support the ARV.
Projected returns pro-forma
-3.0% appreciation · 8.0% rent growth · sell at horizon
- IRR
- 82.1%
- Equity multiple
- 5.08×
- Total profit
- $171,174
- Equity at exit
- $22,365
- IRR
- 86.7%
- Equity multiple
- 12.48×
- Total profit
- $482,066
- Equity at exit
- $12,969
Cash invested: $42,000 (down + closing). Projections, not guarantees.
Landlord ↔ Tenant lean methodology
- Overall (STATE)
- 87 Strongly Landlord-Friendly
- State Texas
- 87 Strongly Landlord-Friendly · R+5
- County
- — inherits STATE
- City
- — inherits STATE
ZIP-level market 78521
- Home prices YoY
- -26.0%
- Rents YoY
- 8.2%
- Active inventory
- 365
- Price-to-rent
- 10.6×
Monthly cashflow live
- Estimated rent
- $4,702 high interval (Pro) →
- Mortgage (P&I)
- −$787
- Tax est. 1.5%
- −$188 /mo · $2,250/yr
- Insurance
- −$62
- HOA
- −$0
- Vacancy / Maint / Mgmt
- −$987
- Net cashflow
- $2,678
Break-even live
4-unit breakdown (identical units grouped — click to expand)
| Units | Beds | Baths | Est. rent |
|---|---|---|---|
| 4× units | 2 | 1 | $4,700 |
| #1 | 2 | 1 | $1,175 |
| #2 | 2 | 1 | $1,175 |
| #3 | 2 | 1 | $1,175 |
| #4 | 2 | 1 | $1,175 |
| Total (4 units) | $4,702 | ||
UW: 25.0% down · 7.5% · 30yr · 1.5% tax · 5.0% vac · 8.0% maint · 8.0% mgmt
Financing live
Cash to close
- Down payment
- $37,500
- Closing costs
- $4,500
- Reserves months
- —
- Total cash needed
- —
Loan-product check · same deal, 3 products live
Conventional
25% down · 7.5% · 30yr
- Down + closing
- —
- Monthly P&I
- —
- Monthly cashflow
- —
- DSCR
- —
- Eligible?
- —
Personal DTI + credit; lowest rate.
DSCR
20% down · 8.5% · 30yr
- Down + closing
- —
- Monthly P&I
- —
- Monthly cashflow
- —
- DSCR
- —
- Eligible?
- —
No personal income docs; deal must DSCR.
Hard money
10% down · 12.0% · 12mo
- Down + closing
- —
- Monthly P&I
- —
- Monthly cashflow
- —
- DSCR
- —
- Eligible?
- —
Short-term bridge; refi at stabilization.
Rent comps 1 comps
| Address | Beds | Baths | Sqft | Rent | $/sqft | DOM | Units | Dist |
|---|---|---|---|---|---|---|---|---|
| 1500 E Madison St Unit 1506 Brownsville, TX | 3.0 | 3.0 | 2313 | $2,450 | $1.06 | 13d | 1 | 1.14mi |
Listing history 28 events
-
2026-06-18days on market $150,000 Active 270 DOM
-
2026-06-17days on market $150,000 Active 269 DOM
-
2026-06-16days on market $150,000 Active 268 DOM
-
2026-06-15days on market $150,000 Active 267 DOM
-
2026-06-14days on market $150,000 Active 265 DOM
-
2026-06-13days on market $150,000 Active 264 DOM
-
2026-06-10days on market $150,000 Active 262 DOM
-
2026-06-09days on market $150,000 Active 261 DOM
-
2026-06-08days on market $150,000 Active 260 DOM
-
2026-06-07days on market $150,000 Active 259 DOM
-
2026-06-05days on market $150,000 Active 256 DOM
-
2026-06-03days on market $150,000 Active 255 DOM
-
2026-06-02days on market $150,000 Active 254 DOM
-
2026-06-01days on market $150,000 Active 253 DOM
-
2026-05-31days on market $150,000 Active 252 DOM
-
2026-05-30days on market $150,000 Active 251 DOM
-
2026-03-22status Active 762-char remark
Show marketing remark (762 chars)
Reduced Price. Great Investment Opportunity in Brownsville! This multi-family property features two buildings with a total of 4 units (2 units per building). All 4 apartments are currently rented, providing steady income from day one. The property is being sold AS-IS. Appliances are not included. Located in a prime area, the buildings are close to major avenues such as International Blvd and Boca Chica Blvd, with easy access to the Brownsville Airport, schools, shopping, and dining. Conveniently situated near the main road to South Padre Island and SpaceX, this location makes it highly attractive for tenants and investors alike. Don't miss your chance to own this fully occupied income-producing property in one of Brownsville's most accessible locations
-
2026-03-12historical 762-char remark
Show marketing remark (762 chars)
Reduced Price. Great Investment Opportunity in Brownsville! This multi-family property features two buildings with a total of 4 units (2 units per building). All 4 apartments are currently rented, providing steady income from day one. The property is being sold AS-IS. Appliances are not included. Located in a prime area, the buildings are close to major avenues such as International Blvd and Boca Chica Blvd, with easy access to the Brownsville Airport, schools, shopping, and dining. Conveniently situated near the main road to South Padre Island and SpaceX, this location makes it highly attractive for tenants and investors alike. Don't miss your chance to own this fully occupied income-producing property in one of Brownsville's most accessible locations
-
2025-10-29price $150,000 762-char remark
Show marketing remark (762 chars)
Reduced Price. Great Investment Opportunity in Brownsville! This multi-family property features two buildings with a total of 4 units (2 units per building). All 4 apartments are currently rented, providing steady income from day one. The property is being sold AS-IS. Appliances are not included. Located in a prime area, the buildings are close to major avenues such as International Blvd and Boca Chica Blvd, with easy access to the Brownsville Airport, schools, shopping, and dining. Conveniently situated near the main road to South Padre Island and SpaceX, this location makes it highly attractive for tenants and investors alike. Don't miss your chance to own this fully occupied income-producing property in one of Brownsville's most accessible locations
-
2025-09-11$175,000 Active 762-char remark
Show marketing remark (762 chars)
Reduced Price. Great Investment Opportunity in Brownsville! This multi-family property features two buildings with a total of 4 units (2 units per building). All 4 apartments are currently rented, providing steady income from day one. The property is being sold AS-IS. Appliances are not included. Located in a prime area, the buildings are close to major avenues such as International Blvd and Boca Chica Blvd, with easy access to the Brownsville Airport, schools, shopping, and dining. Conveniently situated near the main road to South Padre Island and SpaceX, this location makes it highly attractive for tenants and investors alike. Don't miss your chance to own this fully occupied income-producing property in one of Brownsville's most accessible locations
-
2025-07-17price $135,000
-
2025-02-25price $145,000
-
2025-02-17price $150,000
-
2025-01-22price $155,000
-
2024-11-14price $160,000
-
2024-01-11price $190,000
-
2023-12-05price $200,000
-
2023-11-08price $210,000
ⓘ Source: listings_history table (triggers on properties + properties_extension) + one-shot
backfill from property_details.listing_events for pre-trigger history.
Climate risk First Street
- Flood 1/10 Low FEMA zone X (unshaded) · 0% chance over 30 yrs
- Wildfire 1/10 Low
- Heat 9/10 Extreme 7 d/yr ≥111°F today · 26 d/yr by 30 yrs out
- Wind 9/10 Extreme 99% chance of damaging wind over 30 yrs
- Air quality 3/10 Moderate 2 unhealthy d/yr today · 3 by 30 yrs out
Nearby sold comps map
Loading sold comps map…
Walkable amenities ~0.75 mi
Loading nearby amenities…
Taxation est. · year 1
- Rental income
- $56,424
- − Mortgage interest
- −$8,402
- − Property taxes
- −$2,250
- − Insurance
- −$750
- − Repairs & maintenance
- −$4,514
- − Management
- −$4,514
- − Depreciation
- −$4,364
- Taxable income
- $31,630
- Est. tax owed @ 24.0%
- −$7,591
- After-tax cash flow
- $24,544/yr
For passive investors: Depreciation is non-cash, so a rental often shows a tax loss while cash-flowing — sheltering income. Rental losses are passive: they offset passive income freely, and up to $25,000/yr can offset ordinary (W-2) income if you actively participate and your MAGI is under $100k (phasing out to $0 by $150k); unused losses carry forward. On sale, claimed depreciation is recaptured at up to 25%, and gains may owe capital-gains tax (a 1031 exchange can defer both). Figures are a year-1 estimate at your 24.0% rate — not tax advice; consult a CPA.
Condition & rehab AI · 12 photos
This multi-family property requires extensive repairs and updates to improve its condition and value. Immediate attention to the roof, exterior siding, flooring, and bathrooms is necessary to prevent further damage and enhance its appeal.
Repairs flagged
- Major roof — Exposed wiring and potential water damage
- Major exterior siding — Weathered and damaged
- Major flooring — Worn and dirty tile
- Major interior walls/paint — Peeling paint and visible damage
- Major bathrooms — Visible damage and lack of maintenance
Value-add opportunities
- Both Painting and updating exterior siding — Improves curb appeal and resale value
- Both Flooring replacement — Enhances living space and rental appeal
- Both Roof repair — Prevents water damage and improves structural integrity
- Both Exterior siding repair — Enhances curb appeal and resale value
- Rental Bathroom repairs — Improves tenant satisfaction and rental appeal
Renovation cost estimate screening
| Repair item | Severity | Est. cost |
|---|---|---|
| roof · Exposed wiring and potential water damage | Major | $15,000–50,000 |
| exterior siding · Weathered and damaged | Major | $15,000–50,000 |
| flooring · Worn and dirty tile | Major | $15,000–50,000 |
| interior walls/paint · Peeling paint and visible damage | Major | $15,000–50,000 |
| bathrooms · Visible damage and lack of maintenance | Major | $15,000–50,000 |
| Total estimated repair cost · 5 items | $75,000–250,000 |
Value-add ROI direction
- Both Painting and updating exterior siding — Improves curb appeal and resale value ↑
- Both Flooring replacement — Enhances living space and rental appeal ↑
- Both Roof repair — Prevents water damage and improves structural integrity ↑
- Both Exterior siding repair — Enhances curb appeal and resale value ↑
- Rental Bathroom repairs — Improves tenant satisfaction and rental appeal ↑
ⓘ Cost ranges are severity-bucket heuristics (US national rule-of-thumb). Get contractor quotes + a written scope before underwriting a rehab budget.
Schools (NCES district)
- District
- Brownsville ISD
- NCES district ID
- 4811680
- Math proficiency
- 20% ▼ -36.00%
- Reading proficiency
- 34% ▼ -13.00%
- Median HH income
- $30,490
- Composite
- 21.8/100
- National rank
- #8249
- State rank
- #710 of 826 in TX
Livability — Brownsville
- Score
- 79/100
- State rank
- #62
- US rank
- #2311
Category grades
Schools grade is shown separately in the Schools card above.
Census & demographics
- Census place
- Brownsville, TX
- County
- Cameron County · 310,734 people
- City population
- 212,132
- Metro
- Brownsville-Harlingen, TX
- Population (ZIP)
- 87,380
- Household income
- $44,509
- Rent vs Own
- Severe rent burden
- 2682.0
Population outlook (Cameron County) Hauer SSP2
- Today (2025)
- 441,603 people
- By 2030
- 448,113 · +1.5%
- By 2040
- 456,385 · +3.3%
- By 2050
- 456,294 · +3.3%
- By 2075
- 423,851 · -4.0%
- By 2100
- 342,787 · -22.4%
Race, ethnicity, and origin ACS 2023
- Neighborhood character
- Predominantly Hispanic (97%)
- Race & ethnicity
- Hispanic / Latino 97% Two or more races 45% White 3%
- Hispanic origin (detail)
- Mexican 91%
- Foreign-born
- 30% · Canada
- Languages at home
- 12% English-only · Spanish 88%
Political lean MEDSL · Cameron
- 2024 margin
- Lean R (+5.8) · D 46.7% · R 52.5%
- 2008→2024 swing
- -34.6pp toward R · 2008: 28.8pp · 2024: -5.8pp
- All cycles
- 2024: R+5.8 2020: D+13.2 2016: D+32.5 2012: D+32.4 2008: D+28.8
Not yet ingested
- Civics
- —
Market trends
- HPI YoY
- ▼ -81.45%
- Current HPI
- 232.1072
- Rent YoY
- ▲ 8.19%
- Metro
- Brownsville-Harlingen, TX
- State GDP YoY
- ▲ 3.95%
- F500 in state
- 110
Industry mix (Fortune 500 HQ in TX)
| Industry | F500 HQs | Revenue |
|---|---|---|
| Energy | 16 | $1,198B |
|
||
| Technology | 5 | $198B |
|
||
| Engineering / Construction | 4 | $72B |
|
||
| Energy Services | 3 | $60B |
|
||
| Utilities | 3 | $41B |
|
||
| Healthcare | 2 | $330B |
|
||
Price history
-28.6% since first listed12 events — show timeline
- 2026-03-22 Relisted — RGVMLS
- 2026-03-12 Delisted — RGVMLS
- 2025-10-29 Price Changed $150,000 RGVMLS
- 2025-09-11 Listed $175,000 RGVMLS
- 2025-07-17 Price Changed $135,000 RGVMLS
- 2025-02-25 Price Changed $145,000 RGVMLS
- 2025-02-17 Price Changed $150,000 RGVMLS
- 2025-01-22 Price Changed $155,000 RGVMLS
- 2024-11-14 Price Changed $160,000 RGVMLS
- 2024-01-11 Price Changed $190,000 RGVMLS
- 2023-12-05 Price Changed $200,000 RGVMLS
- 2023-11-08 Price Changed $210,000 RGVMLS
Cash-flow waterfall
monthlySold comps — $/sqft
last 12 mo · ≤1 miLoading sold comps…