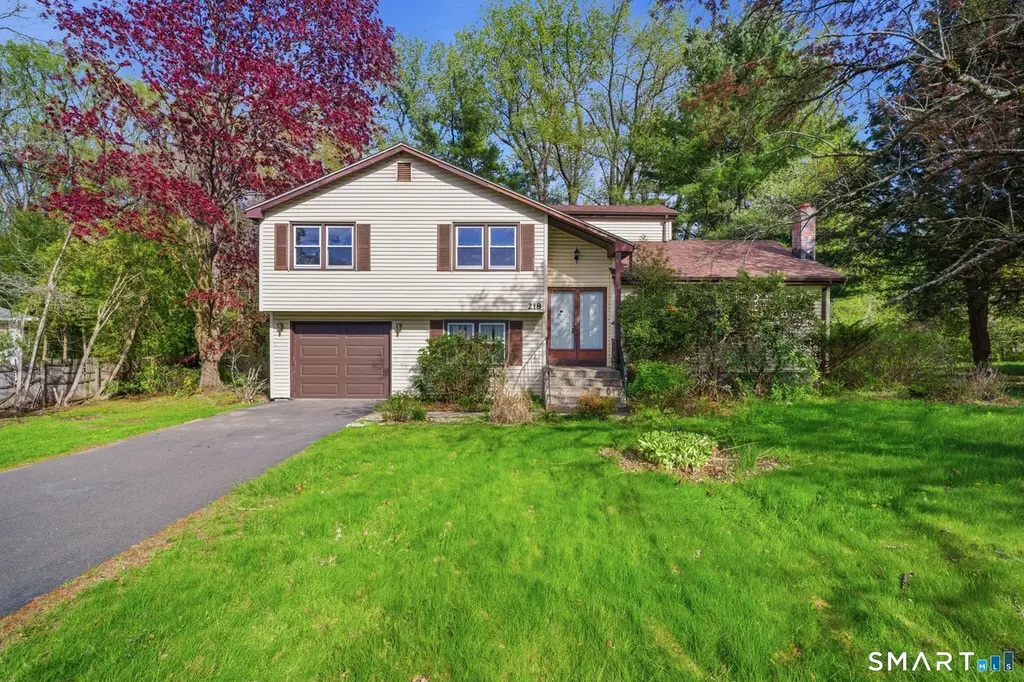
218 Woodland Ave · Blue Hills, CT
Flood risk No data
- FEMA flood zone
- —
- Chance of flooding over 30 yrs
- —
- Est. flood insurance / yr
- —
Fire risk No data
- Est. fire insurance / yr
- —
Heat risk No data
- Hot days now (above threshold)
- —
- Hot days in 30 yrs
- —
Wind risk No data
- Chance of severe wind over 30 yrs
- —
Air-quality risk No data
- Unhealthy air days now
- —
- Unhealthy air days in 30 yrs
- —
Risk factors via First Street. Map © Google.
Why this score? — see what drove the B+ grade
The composite is a weighted blend of 9 inputs, each scored 0–100. Each bar is that input's sub-score; the figure is the points it added to the 100-point composite (weight × sub-score).
- Cash flow +29.4/30.0
- ARV discount +15.0/15.0
- DSCR +10.0/10.0
- 1% rule +9.7/10.0
- Livability +4.0/5.0
- Rent growth +3.3/5.0
- Condition / age +2.5/5.0
- Schools +2.2/10.0
- Appreciation +0.0/10.0
$250,000
🖨 Deal sheet 📄 Offer letter ✓ Due diligence
Listing remarks
* HIGHEST AND BEST OFFERS DUE BY FRIDAY, 5/8 at 10AM. * Looking for a project with major upside? This 4-bedroom Bloomfield split-level is the perfect entry point for an investor or DIY enthusiast. With over 8 rooms of living space and a level 0.34-acre yard, 218 Woodland Avenue is primed for a modern transformation. The infrastructure features natural gas and public utilities, simplifying the renovation process. Located in a peaceful neighborhood, this home offers the chance to build immediate sweat equity through a total interior refresh. Sale is subject to Probate Court approval. Being sold in strictly as-is condition - bring your contractor and your vision to this high-potential estate.
Key facts
- Level yard
- Natural gas
- Public utilities
Tags
Property features AI
Exterior
- Parking: Attached garage (1 car)
- Utilities: Public water connected; Public sewer connected; Hot water: Other
- Home design: Single-family home
- Construction: Concrete foundation; Concrete construction
- Exterior features: Lightly wooded, level lot; Vinyl siding; Asphalt shingle roof
Interior
- Kitchen: Oven/Range; Range hood; Refrigerator
- Bedrooms: 4 bedrooms
- Bathrooms: 1 full bath; 1 half bath
- Heating & cooling: Hot water heat (natural gas); Window unit cooling
- Interior features: 8 total rooms; Partial, partially finished basement
- Laundry & utility: Laundry in lower level/basement
Neighborhood map
What this means for you Summary
Snapshot
- This is a 4-bed/1.5-bath single-family listed at $250k.
Deal economics
- At list price, monthly cash flow is $891 ($11k/yr) — positive.
- The deal already cash-flows at list — no discount required.
- Meets the 1% rule at list price ($4k rent vs $250k).
Location & tenants
- Location reads 81/100 on livability (#14 in CT, #1,343 nationally) — a professional / high-income tenant draw. Strengths: crime A+, commute A+, housing A+; Watch: amenities F.
- Bloomfield School District (suburban): math 16% / reading 30% proficiency, ranked #137 of 153 in CT (top 90%) — low school quality limits family demand, transient renter base, plan for 1-2y turnover.
- Zoned schools: Laurel School (307 students, 67% FRL); Bloomfield High School (math 17% / reading 47%, grade F, #129 of 194 statewide, top 69%, 525 students, 58% FRL) — zoned schools average 62% FRL vs 44% district-wide (18 pts higher); higher-poverty schools than district average — tighter screening recommended.
- Market conditions: Rents rising (+3.1%/yr); 64 active listings in the ZIP; 2 comparable units currently listed for rent nearby; solid renter incomes; 1,867 units permitted in Capitol Planning Region in 2024 (1,399 in 5+ unit buildings).
- This rent runs 45% of the median local income ($98k/yr) — at the standard rent-burdened threshold; future hikes will face affordability resistance.
Forward outlook
- Local home prices are declining (-3.0%/yr); year-one equity from $2k of loan paydown is wiped out by about $8k of value loss. Plan a longer hold.
- At projected returns (-3.0% appreciation + 3.1% rent growth), your $70k cash investment doubles in ~8 years — after that, you're playing with house money.
Negotiation context
- Only 5 days on market — expect competitive offers; lowballing is unlikely to land.
Risks & watch-outs
- Watch-outs: property tax is 2.9% of price.
Questions for the listing agent
- Built in 1973 — when were the roof, HVAC, electrical panel, plumbing, and water heater last replaced?
- Property tax is high relative to price — has the assessment been appealed recently, and will the sale trigger a re-assessment?
- Is there a deadline driving the sale (1031 exchange, divorce, estate, relocation)? That informs how much negotiation room exists.
- Schools are F-rated, which usually means shorter tenancies and higher turnover. Who's the typical renter profile here, and what's been the actual vacancy rate?
- What's the average days-on-market for RENTAL listings here right now (not sales)? A rising rental-DOM trend means longer vacancies and softer asking-rent achievability than the comps imply.
- What's the recent tenant-quality profile in this submarket — average credit score on applications, eviction rate, late-payment / NSF rate, and stable-employment percentage? A property-management company in the area should have these aggregated.
- How much new for-sale + rental construction is in the pipeline within 1–3 miles? Heavy new supply typically softens prices + rents 12–24 months out; constrained supply supports both.
Investment metrics
- 1% rule
- 1.47% ✓
- Cap rate
- 10.57%
- Cash-on-cash
- 15.27%
- DSCR
- 1.68
- GRM
- 5.7
CMA / ARV
- ARV (median comp)
- $361,947
- List price
- $250,000
- Delta
- -30.93%
- Verdict
- UNDERPRICED
- Comps
- 20 within 1.0 mi
Show comp detail 2 sales within ~0.75 mi
| Address | Dist | Beds/Ba | Sqft | Sold | Price | $/sf | Match |
|---|---|---|---|---|---|---|---|
| 216 Woodland Ave | 0.02mi | 3/1.5 (-1) | 1,234 (-12%) | 21mo | $320,000 | $259 | 56 |
| 15 Linwood Dr | 0.22mi | 3/2.0 (-1) | 1,580 (+12%) | 14mo | $270,000 | $171 | 51 |
Match score weights: distance 35% · size 25% · config 20% · recency 20%. Top-matched comps best support the ARV.
Projected returns pro-forma
-3.0% appreciation · 3.11% rent growth · sell at horizon
- IRR
- 6.2%
- Equity multiple
- 1.24×
- Total profit
- $16,845
- Equity at exit
- $37,276
- IRR
- 15.7%
- Equity multiple
- 2.29×
- Total profit
- $90,312
- Equity at exit
- $21,615
Cash invested: $70,000 (down + closing). Projections, not guarantees.
Landlord ↔ Tenant lean methodology
- Overall (STATE)
- 27 Tenant-Leaning
- State Connecticut
- 27 Tenant-Leaning · D+7
- County
- — inherits STATE
- City
- — inherits STATE
ZIP-level market 06002
- Rents YoY
- 3.1%
- Active inventory
- 64
- Price-to-rent
- 5.7×
Monthly cashflow live
- Estimated rent
- $3,674 medium interval (Pro) →
- Mortgage (P&I)
- −$1,311
- Tax from tax record
- −$596 /mo · $7,156/yr
- Insurance
- −$104
- HOA
- −$0
- Vacancy / Maint / Mgmt
- −$771
- Net cashflow
- $891
Break-even live
UW: 25.0% down · 7.5% · 30yr · 1.5% tax · 5.0% vac · 8.0% maint · 8.0% mgmt
Financing live
Cash to close
- Down payment
- $62,500
- Closing costs
- $7,500
- Reserves months
- —
- Total cash needed
- —
Loan-product check · same deal, 3 products live
Conventional
25% down · 7.5% · 30yr
- Down + closing
- —
- Monthly P&I
- —
- Monthly cashflow
- —
- DSCR
- —
- Eligible?
- —
Personal DTI + credit; lowest rate.
DSCR
20% down · 8.5% · 30yr
- Down + closing
- —
- Monthly P&I
- —
- Monthly cashflow
- —
- DSCR
- —
- Eligible?
- —
No personal income docs; deal must DSCR.
Hard money
10% down · 12.0% · 12mo
- Down + closing
- —
- Monthly P&I
- —
- Monthly cashflow
- —
- DSCR
- —
- Eligible?
- —
Short-term bridge; refi at stabilization.
Rent comps 2 comps
| Address | Beds | Baths | Sqft | Rent | $/sqft | DOM | Units | Dist |
|---|---|---|---|---|---|---|---|---|
| 55 Tunxis Ave Bloomfield, CT | 1.0–3.0 | 1.0–2.0 | 1003 | $2,850 | $2.84 | 43d | 1 | 1.26mi |
| 100 Ryefield Village Dr Bloomfield, CT | 2.0–4.0 | 2.5 | 1692 | $4,453 | $2.63 | 1d | 9 | 1.50mi |
Listing history 2 events
-
2026-05-09status Under Contract 696-char remark
-
2026-05-04$250,000 Active 696-char remark
ⓘ Source: listings_history table (triggers on properties + properties_extension) + one-shot
backfill from property_details.listing_events for pre-trigger history.
Tax reassessment forecast CT · Partial reset (capped growth)
- Current annual tax
- $7,156 · $596/mo
- Projected year-2 tax
- $7,156 · $596/mo
- Expected delta
- $0/yr ($0/mo · 0.0%)
ⓘ Screening estimate from a state-policy table — verify with the county assessor before closing.
Nearby sold comps map
Loading sold comps map…
Walkable amenities ~0.75 mi
Loading nearby amenities…
Taxation est. · year 1
- Rental income
- $44,082
- − Mortgage interest
- −$14,004
- − Property taxes
- −$7,156
- − Insurance
- −$1,250
- − Repairs & maintenance
- −$3,527
- − Management
- −$3,527
- − Depreciation
- −$7,273
- Taxable income
- $7,346
- Est. tax owed @ 24.0%
- −$1,763
- After-tax cash flow
- $8,923/yr
For passive investors: Depreciation is non-cash, so a rental often shows a tax loss while cash-flowing — sheltering income. Rental losses are passive: they offset passive income freely, and up to $25,000/yr can offset ordinary (W-2) income if you actively participate and your MAGI is under $100k (phasing out to $0 by $150k); unused losses carry forward. On sale, claimed depreciation is recaptured at up to 25%, and gains may owe capital-gains tax (a 1031 exchange can defer both). Figures are a year-1 estimate at your 24.0% rate — not tax advice; consult a CPA.
Schools (NCES district)
- District
- Bloomfield School District
- NCES district ID
- 0900330
- Math proficiency
- 16% ▼ -13.00%
- Reading proficiency
- 30% ▼ -12.00%
- Median HH income
- $71,180
- Composite
- 22.37/100
- National rank
- #8120
- State rank
- #137 of 153 in CT
Livability — Blue Hills
- Score
- 81/100
- State rank
- #14
- US rank
- #1343
Category grades
Schools grade is shown separately in the Schools card above.
Census & demographics
- County
- Hartford County · 754,208 people
- Metro
- Hartford-East Hartford-Middletown, CT
- Population (ZIP)
- 21,865
- Household income
- $98,162
- Rent vs Own
- Severe rent burden
- 692.0
Population outlook (Capitol County) Hauer SSP2
- By 2040
- 1,063,519
Race, ethnicity, and origin ACS 2023
- Neighborhood character
- Diverse neighborhood (Simpson 0.61)
- Race & ethnicity
- Black 54% White 30% Hispanic / Latino 8% Two or more races 6% Asian 4%
- Hispanic origin (detail)
- Puerto Rican 4%
- Common ancestry
- Romanian 2% Lithuanian 2% Scotch-Irish 2%
- Foreign-born
- 25% · Canada, Vietnam, China
- Languages at home
- 82% English-only · Spanish 6% Other Indo-European 2% French/Haitian/Cajun 2%
Political lean MEDSL · Capitol
- 2024 margin
- Strong D (+21.9) · D 60.1% · R 38.2% · Other 1.7%
- All cycles
- 2024: D+21.9
Not yet ingested
- Civics
- —
Market trends
- HPI YoY
- ▼ -175.76%
- Current HPI
- 198.4604
- Rent YoY
- ▲ 3.11%
- Metro
- Hartford-East Hartford-Middletown, CT
- State GDP YoY
- ▲ 1.06%
- F500 in state
- 38
Industry mix (Fortune 500 HQ in CT)
| Industry | F500 HQs | Revenue |
|---|---|---|
| Industrial Machinery | 4 | $38B |
|
||
| Insurance | 3 | $71B |
|
||
| Financial Services | 2 | $25B |
|
||
| Transportation / Logistics | 2 | $18B |
|
||
| Healthcare | 1 | $247B |
|
||
| Telecommunications | 1 | $55B |
|
||
Price history
2 events — show timeline
- 2026-05-09 Pending — Smart MLS
- 2026-05-04 Listed $250,000 Smart MLS
Property tax history
+2.8%/yrLatest (2025): $7,156 · +32.0% YoY. Source: county tax records.
Cash-flow waterfall
monthlySold comps — $/sqft
last 12 mo · ≤1 miLoading sold comps…