4709 El Hachero Ct SE · Rio Rancho, NM
Flood risk 1/10 · Minimal
- FEMA flood zone
- X (unshaded)
- Chance of flooding over 30 yrs
- 0.0%
- Est. flood insurance / yr
- $507 – $1,088
Fire risk 3/10 · Minor
- Est. fire insurance / yr
- $706 – $1,312
Heat risk 5/10 · Moderate
- Hot days now (above 95°F)
- 7 days/yr
- Hot days in 30 yrs
- 18 days/yr
Wind risk 1/10 · Minimal
- Chance of severe wind over 30 yrs
- —
Air-quality risk 3/10 · Minor
- Unhealthy air days now
- 3 days/yr
- Unhealthy air days in 30 yrs
- 3 days/yr
Risk factors via First Street. Map © Google.
Why this score? — see what drove the D grade
The composite is a weighted blend of 9 inputs, each scored 0–100. Each bar is that input's sub-score; the figure is the points it added to the 100-point composite (weight × sub-score).
- Cash flow +12.3/30.0
- ARV discount +11.0/15.0
- Schools +5.2/10.0
- DSCR +3.6/10.0
- Livability +3.6/5.0
- Rent growth +3.3/5.0
- Condition / age +2.5/5.0
- 1% rule +2.4/10.0
- Appreciation +0.0/10.0
$240,000
🖨 Deal sheet (PDF) 📄 Offer letter ✓ Due diligence
Listing remarks
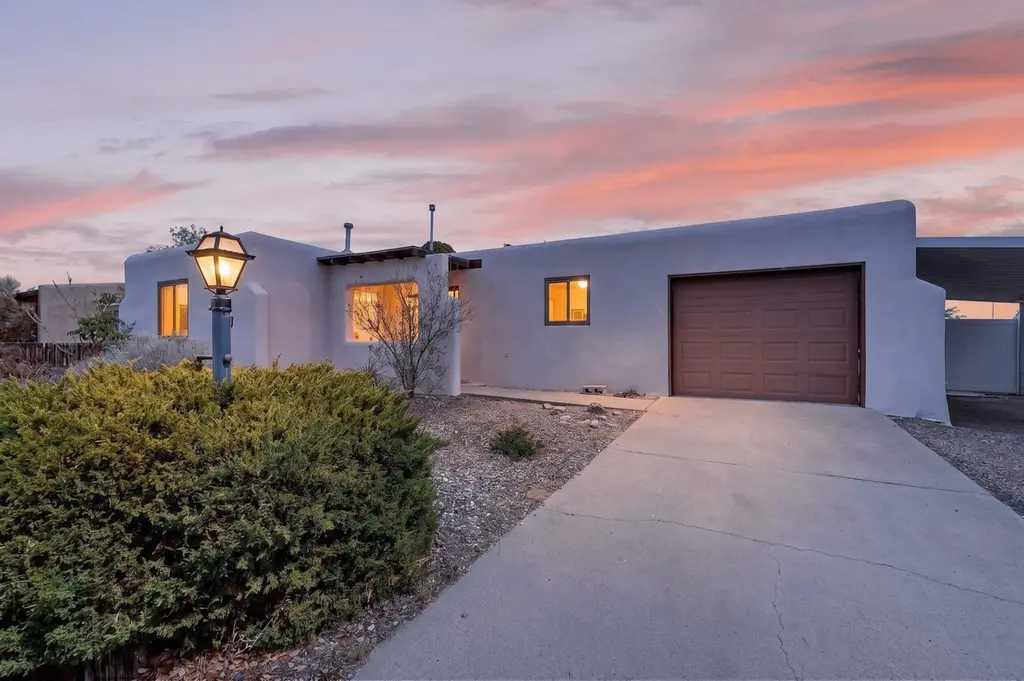
Tucked away on a quiet cul-de-sac in the desirable Sabana Grande neighborhood, this charming 2-bedroom, 1-bath home sits on an large lot with potential backyard access--perfect for extra parking, toys or future expansion! Inside, you'll find a fresh coat of paint with no carpet throughout, offering easy maintenance. Outside, the low-maintenance yard allows for simple. upkeep. The home has had a recent roof tune-up and new stucco in 2022. If you're looking for your first home, a downsizing option, or an investment opportunity, this is the home for you!
Key facts
- Low-maintenance yard
- New stucco
- Backyard access
Tags
Neighborhood map
What this means for you Summary
Snapshot
- This is a 3-bed/2.0-bath single-family listed at $240k.
Deal economics
- At list price, monthly cash flow is $-46 ($-551/yr) — negative.
- To cash-flow at today's rent, offer at most $232k (3.4% below list).
- To meet the 1% rule (rent ≥ 1% of price), the offer needs to be $178k (25.8% below list).
- Recommended offer: $178k (25.8% below list) — sets the bar for 1% rule.
- Cap rate 6.1% vs local median 3.6% in Rio Rancho — top-decile yield for the area; either an underpriced asset or a hidden risk that comps aren't pricing in. Stress-test before assuming the spread holds.
Location & tenants
- Location reads 71/100 on livability (#17 in NM) — a middle-class / working-renter tenant base. Strengths: housing A+, cost of living A; Watch: amenities D, commute F.
- Rio Rancho Public Schools (suburban): math 48% / reading 73% proficiency, ranked #4 of 29 in NM (top 14%) — acceptable for families but not a draw, mixed tenant base, ~2y average lease.
- Zoned schools: Rio Rancho Elementary (534 students, 100% FRL); Rio Rancho Middle School (1,143 students, 24% FRL); Rio Rancho High (math 52% / reading 77%, grade B-, #22 of 110 statewide, top 22%, 2,573 students, 22% FRL).
- Market conditions: Rents rising (+3.1%/yr); 837 active listings in the ZIP; 6 comparable units currently listed for rent nearby; rentals at typical pace (median 23d on market — plan ~3-4 weeks tenant-placement turnaround); solid renter incomes; 1,278 units permitted in Sandoval County in 2024 (216 in 5+ unit buildings).
Forward outlook
- Local home prices are declining (-3.0%/yr); year-one equity from $2k of loan paydown is wiped out by about $7k of value loss. Plan a longer hold.
- Sandoval County population projected at +15% by 2050 — long-run rental-demand tailwind backs the buy-and-hold thesis.
Negotiation context
- Only 1 days on market — expect competitive offers; lowballing is unlikely to land.
- Current owner paid $125k; list at $240k implies a 92% gain — meaningful room to come down on a strong offer.
Risks & watch-outs
- Climate carrying-cost: extreme-heat days projected 7→18/yr by 2055 (HVAC capex compounding) — expect insurance premiums to compound above CPI over the hold.
Questions for the listing agent
- What do current leases actually rent for vs. the listed asking? Can we see a recent rent roll and the last 12 months of T-12 income?
- Built in 1973 — when were the roof, HVAC, electrical panel, plumbing, and water heater last replaced?
- Is there a deadline driving the sale (1031 exchange, divorce, estate, relocation)? That informs how much negotiation room exists.
- The area grade is low — what's the realistic commute time and amenity access for the typical tenant pool here? Any planned neighborhood developments (good or bad) we should know about?
- What's the average days-on-market for RENTAL listings here right now (not sales)? A rising rental-DOM trend means longer vacancies and softer asking-rent achievability than the comps imply.
- What's the recent tenant-quality profile in this submarket — average credit score on applications, eviction rate, late-payment / NSF rate, and stable-employment percentage? A property-management company in the area should have these aggregated.
- How much new for-sale + rental construction is in the pipeline within 1–3 miles? Heavy new supply typically softens prices + rents 12–24 months out; constrained supply supports both.
Investment metrics
- 1% rule
- 0.74% ✗
- Cap rate
- 6.06%
- Cash-on-cash
- -0.82%
- DSCR
- 0.96
- GRM
- 11.2
CMA / ARV
- ARV (on-the-fly)
- $260,230
- Comps found
- 3
Show comp detail 3 sales within ~0.75 mi
| Address | Dist | Beds/Ba | Sqft | Sold | Price | $/sf | Match |
|---|---|---|---|---|---|---|---|
| 4709 El Hachero Ct SE | 0.00mi | 2/1.0 (-1) | 985 (+0%) | 1mo | $240,000 | $244 | 90 |
| 303 Santa Elena Rd SE | 0.31mi | 2/1.0 (-1) | 942 (-4%) | 16mo | $250,000 | $265 | 56 |
| 204 Santa Elena Rd SE | 0.39mi | 2/1.0 (-1) | 950 (-3%) | 16mo | $265,000 | $279 | 54 |
Match score weights: distance 35% · size 25% · config 20% · recency 20%. Top-matched comps best support the ARV.
Projected returns pro-forma
-3.0% appreciation · 3.13% rent growth · sell at horizon
- IRR
- -17.6%
- Equity multiple
- 0.38×
- Total profit
- $-41,681
- Equity at exit
- $35,785
- IRR
- -9.5%
- Equity multiple
- 0.41×
- Total profit
- $-39,505
- Equity at exit
- $20,751
Cash invested: $67,200 (down + closing). Projections, not guarantees.
Landlord ↔ Tenant lean methodology
- Overall (STATE)
- 55 Moderately Landlord-Leaning
- State New Mexico
- 55 Moderately Landlord-Leaning · D+3
- County
- — inherits STATE
- City
- — inherits STATE
ZIP-level market 87124
- Rents YoY
- 3.1%
- Active inventory
- 837
- Price-to-rent
- 11.2×
Monthly cashflow live
- Estimated rent
- $1,781 high interval (Pro) →
- Mortgage (P&I)
- −$1,259
- Tax from tax record
- −$94 /mo · $1,131/yr
- Insurance
- −$100
- HOA
- −$0
- Vacancy / Maint / Mgmt
- −$374
- Net cashflow
- $-46
Break-even live
Sensitivity live
| Price | -10% $90 | -5% $22 | +0% $-46 | +5% $-114 | +10% $-182 |
|---|---|---|---|---|---|
| Rent | -10% $-187 | -5% $-116 | +0% $-46 | +5% $24 | +10% $95 |
| Rate | -1.0pp $75 | -0.5pp $15 | base $-46 | +0.5pp $-108 | +1.0pp $-171 |
UW: 25.0% down · 7.5% · 30yr · 1.5% tax · 5.0% vac · 8.0% maint · 8.0% mgmt
Financing live
Cash to close
- Down payment
- $60,000
- Closing costs
- $7,200
- Reserves months
- —
- Total cash needed
- —
Loan-product check · same deal, 3 products live
Conventional
25% down · 7.5% · 30yr
- Down + closing
- —
- Monthly P&I
- —
- Monthly cashflow
- —
- DSCR
- —
- Eligible?
- —
Personal DTI + credit; lowest rate.
DSCR
20% down · 8.5% · 30yr
- Down + closing
- —
- Monthly P&I
- —
- Monthly cashflow
- —
- DSCR
- —
- Eligible?
- —
No personal income docs; deal must DSCR.
Hard money
10% down · 12.0% · 12mo
- Down + closing
- —
- Monthly P&I
- —
- Monthly cashflow
- —
- DSCR
- —
- Eligible?
- —
Short-term bridge; refi at stabilization.
Rent comps 6 comps
| Address | Beds | Baths | Sqft | Rent | $/sqft | DOM | Units | Dist |
|---|---|---|---|---|---|---|---|---|
| 401 Cerro de Ortega Dr SE Rio Rancho, NM | 3.0 | 1.0 | 1050 | $1,750 | $1.67 | 22d | 1 | 0.33mi |
| 900 Los Reyes Ct SE Unit 904 Rio Rancho, NM | 2.0 | 1.0 | 980 | $1,275 | $1.30 | 45d | 1 | 0.46mi |
| 1071 Meadowlark Ct SE Rio Rancho, NM | 2.0 | 1.0 | 950 | $1,500 | $1.58 | 4d | 1 | 0.70mi |
| 4248 Sabana Loop SE Rio Rancho, NM | 2.0 | 2.0 | 800 | $1,500 | $1.88 | 45d | 1 | 0.75mi |
| 1011 Meadowlark Ct SE Apt 2 Rio Rancho, NM | 2.0 | 1.0 | 820 | $1,250 | $1.52 | 3d | 1 | 0.78mi |
| 4101 Meadowlark Ln SE Rio Rancho, NM | 1.0–2.0 | 1.0–2.0 | 703 | $1,620 | $2.30 | 4d | 12 | 0.82mi |
Listing history 5 events
-
2026-04-24status Pending
-
2026-04-04$240,000 Active
-
2014-01-13soldstatus
-
2011-02-16soldstatus
-
2010-02-19soldstatus $125,000
ⓘ Source: listings_history table (triggers on properties + properties_extension) + one-shot
backfill from property_details.listing_events for pre-trigger history.
Tax reassessment forecast NM · Resets to sale price
- Current annual tax
- $1,131 · $94/mo
- Projected year-2 tax
- $1,920 · $160/mo
- Expected delta
- +$789/yr (+$66/mo · 69.7%)
ⓘ Screening estimate from a state-policy table — verify with the county assessor before closing.
Climate risk First Street
- Flood 1/10 Low FEMA zone X (unshaded) · 0% chance over 30 yrs
- Wildfire 3/10 Moderate
- Heat 5/10 Major 7 d/yr ≥95°F today · 18 d/yr by 30 yrs out
- Wind 1/10 Low
- Air quality 3/10 Moderate 3 unhealthy d/yr today · 3 by 30 yrs out
Nearby sold comps map
Loading sold comps map…
Walkable amenities ~0.75 mi
Loading nearby amenities…
Taxation est. · year 1
- Rental income
- $21,371
- − Mortgage interest
- −$13,444
- − Property taxes
- −$1,131
- − Insurance
- −$1,200
- − Repairs & maintenance
- −$1,710
- − Management
- −$1,710
- − Depreciation
- −$6,982
- Taxable loss
- −$4,805
- Est. tax savings @ 24.0%
- +$1,153
- After-tax cash flow
- $602/yr
For passive investors: Depreciation is non-cash, so a rental often shows a tax loss while cash-flowing — sheltering income. Rental losses are passive: they offset passive income freely, and up to $25,000/yr can offset ordinary (W-2) income if you actively participate and your MAGI is under $100k (phasing out to $0 by $150k); unused losses carry forward. On sale, claimed depreciation is recaptured at up to 25%, and gains may owe capital-gains tax (a 1031 exchange can defer both). Figures are a year-1 estimate at your 24.0% rate — not tax advice; consult a CPA.
Schools (NCES district)
- District
- Rio Rancho Public Schools
- NCES district ID
- 3500010
- Math proficiency
- 48% ▲ 38.00%
- Reading proficiency
- 73% ▲ 48.00%
- Median HH income
- $59,410
- Composite
- 52.29/100
- National rank
- #1595
- State rank
- #4 of 29 in NM
Livability — Rio Rancho
- Score
- 71/100
- State rank
- #17
- US rank
- #7253
Category grades
Schools grade is shown separately in the Schools card above.
Census & demographics
- Census place
- Rio Rancho, NM
- County
- Sandoval County · 110,336 people
- City population
- 58,402
- Metro
- Albuquerque, NM
- Population (ZIP)
- 58,499
- Household income
- $86,555
- Rent vs Own
- Severe rent burden
- 1027.0
Population outlook (Sandoval County) Hauer SSP2
- Today (2025)
- 155,072 people
- By 2030
- 161,714 · +4.3%
- By 2040
- 171,831 · +10.8%
- By 2050
- 178,536 · +15.1%
- By 2075
- 192,517 · +24.1%
- By 2100
- 197,952 · +27.7%
Race, ethnicity, and origin ACS 2023
- Neighborhood character
- Diverse neighborhood (Simpson 0.61)
- Race & ethnicity
- White 47% Hispanic / Latino 41% Two or more races 18% Native American 5% Black 3% Asian 2%
- Hispanic origin (detail)
- Mexican 24% Puerto Rican 2%
- Common ancestry
- Lithuanian 3% Slovak 2% Italian 2%
- Foreign-born
- 6% · Canada, Vietnam, China
- Languages at home
- 84% English-only · Spanish 12% Vietnamese 1%
Political lean MEDSL · Sandoval
- 2024 margin
- Lean D (+5.8) · D 51.8% · R 46.0% · Other 2.2%
- 2008→2024 swing
- -7.0pp toward R · 2008: 12.8pp · 2024: 5.8pp
- All cycles
- 2024: D+5.8 2020: D+8.4 2016: D+2.7 2012: D+5.1 2008: D+12.8
Not yet ingested
- Civics
- —
Market trends
- HPI YoY
- ▼ -303.50%
- Current HPI
- 219.8377
- Rent YoY
- ▲ 3.13%
- Metro
- Albuquerque, NM
- State GDP YoY
- —
- F500 in state
- 0
Price history
+92.0% since first listed5 events — show timeline
- 2026-04-24 Pending — Southwest MLS
- 2026-04-04 Listed $240,000 Southwest MLS
- 2014-01-13 Sold (Public Records) — Public Records
- 2011-02-16 Sold (Public Records) — Public Records
- 2010-02-19 Sold (Public Records) $125,000 Public Records
Property tax history
+0.6%/yrLatest (2024): $1,131 · +2.8% YoY. Source: county tax records.
Cash-flow waterfall
monthlySold comps — $/sqft
last 12 mo · ≤1 miLoading sold comps…