 Duplex
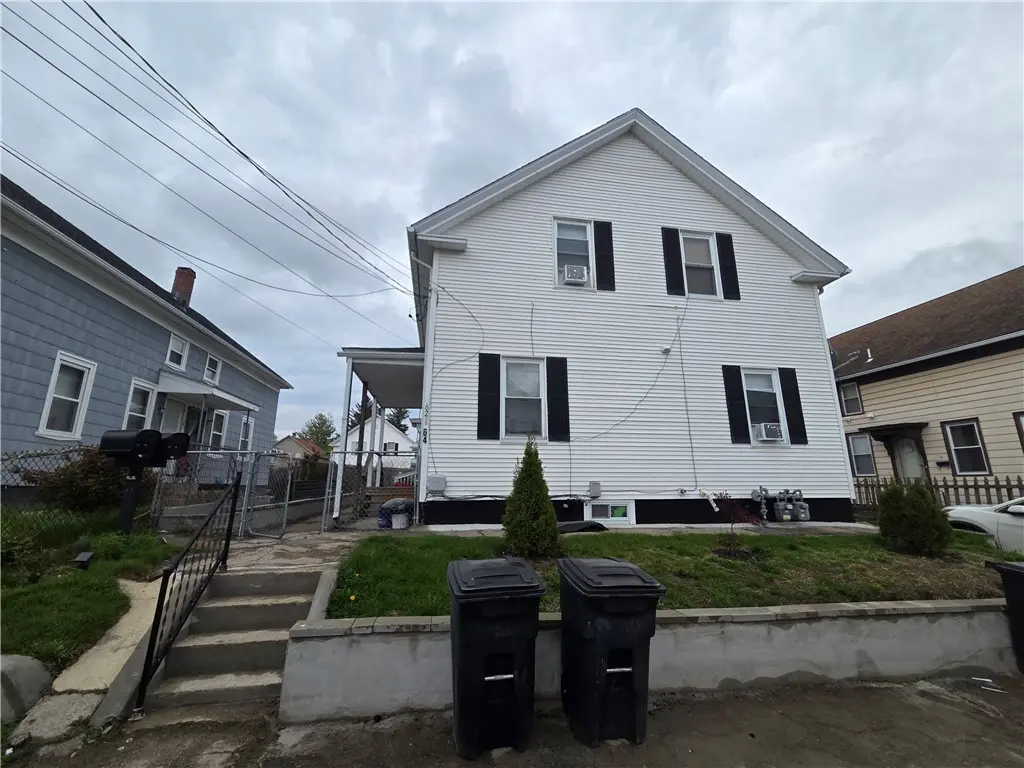
62 Maple Ave · Cranston, RI
Flood risk No data
- FEMA flood zone
- —
- Chance of flooding over 30 yrs
- —
- Est. flood insurance / yr
- —
Fire risk No data
- Est. fire insurance / yr
- —
Heat risk No data
- Hot days now (above threshold)
- —
- Hot days in 30 yrs
- —
Wind risk No data
- Chance of severe wind over 30 yrs
- —
Air-quality risk No data
- Unhealthy air days now
- —
- Unhealthy air days in 30 yrs
- —
Risk factors via First Street. Map © Google.
Why this score? — see what drove the D grade
The composite is a weighted blend of 9 inputs, each scored 0–100. Each bar is that input's sub-score; the figure is the points it added to the 100-point composite (weight × sub-score).
- Cash flow +15.2/30.0
- ARV discount +6.9/15.0
- DSCR +4.7/10.0
- Livability +4.4/5.0
- 1% rule +3.6/10.0
- Rent growth +2.5/5.0
- Condition / age +2.5/5.0
- Schools +2.1/10.0
- Appreciation +0.0/10.0
$540,000
🖨 Deal sheet (PDF) 📄 Offer letter ✓ Due diligence
Multi-family units
County records classify this as Multi-Family (2-4 Unit). Listing-text estimate: 2 units. confirmed
Listing remarks
3 bedroom Duplex 1 bath, new roof
Key facts
- 3,532 sq ft lot
- Built 1900
- Listed 2 days
Property features AI
Finance
- Financial info: Two rental units with listed actual rent of $1,800 each
- HOA & community: Located in a senior community
Exterior
- Parking: No garage
- Security: No specific security features provided
- Utilities: Public water; Public sewer; Electric service 100 amps
- Home design: Two-story multiunit building; Above-grade finished area listed as 3,532
- Construction: Vinyl siding exterior
- Exterior features: Lot approximately 0.081 acres
Interior
- Kitchen: No specific kitchen appliance details provided
- Bedrooms: Two separate 3-bedroom units
- Flooring: Vinyl flooring
- Bathrooms: Two full bathrooms and one half bathroom (building total); Unit 1: 1 full bath; Unit 2: 1 full bath and 1 half bath
- Heating & cooling: Gas heating with baseboard and forced air; Single cooling unit
- Interior features: Full, partially finished basement with interior entry; 12 total rooms
- Laundry & utility: Tankless water heater and secondary water heater
Neighborhood map
What this means for you Summary
Snapshot
- This is a 2 × 3-bed/1-bath units multifamily listed at $540k.
Deal economics
- At list price, monthly cash flow is $189 ($2k/yr) — positive. Per door: $94/mo.
- The deal already cash-flows at list — no discount required.
- To meet the 1% rule (rent ≥ 1% of price), the offer needs to be $463k (14.3% below list).
- Recommended offer: $463k (14.3% below list) — sets the bar for 1% rule.
- Cap rate 6.7% vs local median 3.2% in Cranston — top-decile yield for the area; either an underpriced asset or a hidden risk that comps aren't pricing in. Stress-test before assuming the spread holds.
Location & tenants
- Location reads 87/100 on livability (#1 in RI, #323 nationally) — a professional / high-income tenant draw. Strengths: crime A+, employment A+, housing A+.
- Johnston (suburban): math 13% / reading 32% proficiency, ranked #28 of 39 in RI (top 72%) — low school quality limits family demand, transient renter base, plan for 1-2y turnover.
- Zoned schools: Thornton School (math 17% / reading 30%, grade F, #105 of 167 statewide, top 63%, 335 students, 62% FRL); Nicholas A. Ferri Middle (math 10% / reading 28%, grade F, #33 of 57 statewide, top 57%, 761 students, 46% FRL); Johnston Senior High (math 17% / reading 47%, grade F, #30 of 58 statewide, top 51%, 804 students, 40% FRL).
- Market conditions: 141 active listings in the ZIP; 1 comparable units currently listed for rent nearby; solid renter incomes; 776 units permitted in Providence County in 2024 (229 in 5+ unit buildings).
- At $4,626/mo this rent would consume 60% of the median local household income ($92k/yr) (locally 497% of renters already pay >50% of income on rent) — very limited rent-growth headroom before tenants either downsize or default.
Forward outlook
- Local home prices are declining (-3.0%/yr); year-one equity from $4k of loan paydown is wiped out by about $16k of value loss. Plan a longer hold.
- Providence County population projected at +5% by 2050 — modest demand growth; plan on rents tracking national, not racing it.
Negotiation context
- Only 2 days on market — expect competitive offers; lowballing is unlikely to land.
Risks & watch-outs
- Watch-outs: built in 1900 — expect roof / HVAC / electrical / plumbing capex.
Questions for the listing agent
- Can we see the unit-by-unit rent roll, current vacancy, and any below-market leases? What's the average tenancy length?
- What capital expenditures (roof, boiler, parking lot, exteriors) have been made in the last 5 years, and what's planned in the next 2?
- Built in 1900 — when were the roof, HVAC, electrical panel, plumbing, and water heater last replaced?
- Is there a deadline driving the sale (1031 exchange, divorce, estate, relocation)? That informs how much negotiation room exists.
- The area grade is low — what's the realistic commute time and amenity access for the typical tenant pool here? Any planned neighborhood developments (good or bad) we should know about?
- What's the average days-on-market for RENTAL listings here right now (not sales)? A rising rental-DOM trend means longer vacancies and softer asking-rent achievability than the comps imply.
- What's the recent tenant-quality profile in this submarket — average credit score on applications, eviction rate, late-payment / NSF rate, and stable-employment percentage? A property-management company in the area should have these aggregated.
- How much new apartment / multifamily construction is in the pipeline within 1–3 miles? Heavy new supply (>2% of stock underway) typically softens rents 12–24 months out; light construction supports rent growth.
Investment metrics
- 1% rule
- 0.86% ✗
- Cap rate
- 6.71%
- Cash-on-cash
- 1.50%
- DSCR
- 1.07
- GRM
- 9.7
CMA / ARV
- ARV (on-the-fly)
- $533,281
- Comps found
- 5
Show comp detail 5 sales within ~0.75 mi
| Address | Dist | Beds/Ba | Sqft | Sold | Price | $/sf | Match |
|---|---|---|---|---|---|---|---|
| 70 72 Pocasset St | 0.05mi | 6/2.0 | 2,059 (0%) | 6mo | $480,000 | $233 | 93 |
| 57 59 Maple Ave | 0.02mi | 6/3.0 | 2,059 (0%) | 10mo | $535,000 | $260 | 86 |
| 55 Walnut St | 0.03mi | 6/2.0 | 2,278 (+11%) | 16mo | $590,000 | $259 | 68 |
| 108 Clark Ave | 0.59mi | 6/2.0 | 2,296 (+12%) | 10mo | $595,000 | $259 | 45 |
| 38 Mill St | 0.64mi | 5/2.0 (-1) | 1,750 (-15%) | 6mo | $487,000 | $278 | 35 |
Match score weights: distance 35% · size 25% · config 20% · recency 20%. Top-matched comps best support the ARV.
Projected returns pro-forma
-3.0% appreciation · 3.0% rent growth · sell at horizon
- IRR
- -13.9%
- Equity multiple
- 0.50×
- Total profit
- $-75,577
- Equity at exit
- $80,516
- IRR
- -5.1%
- Equity multiple
- 0.66×
- Total profit
- $-50,714
- Equity at exit
- $46,689
Cash invested: $151,200 (down + closing). Projections, not guarantees.
Landlord ↔ Tenant lean methodology
- Overall (STATE)
- 31 Tenant-Leaning
- State Rhode Island
- 31 Tenant-Leaning · D+8
- County
- — inherits STATE
- City
- — inherits STATE
ZIP-level market 02919
- Active inventory
- 141
- Price-to-rent
- 19.5×
Monthly cashflow live
- Estimated rent
- $4,626 high interval (Pro) →
- Mortgage (P&I)
- −$2,832
- Tax from tax record
- −$409 /mo · $4,908/yr
- Insurance
- −$225
- HOA
- −$0
- Vacancy / Maint / Mgmt
- −$971
- Net cashflow
- $189
Break-even live
Sensitivity live
| Price | -10% $494 | -5% $342 | +0% $189 | +5% $36 | +10% $-117 |
|---|---|---|---|---|---|
| Rent | -10% $-177 | -5% $6 | +0% $189 | +5% $371 | +10% $554 |
| Rate | -1.0pp $461 | -0.5pp $326 | base $189 | +0.5pp $49 | +1.0pp $-94 |
2-unit breakdown (identical units grouped — click to expand)
| Units | Beds | Baths | Est. rent |
|---|---|---|---|
| 2× units | 3 | 1 | $4,626 |
| #1 | 3 | 1 | $2,313 |
| #2 | 3 | 1 | $2,313 |
| Total (2 units) | $4,626 | ||
UW: 25.0% down · 7.5% · 30yr · 1.5% tax · 5.0% vac · 8.0% maint · 8.0% mgmt
Financing live
Cash to close
- Down payment
- $135,000
- Closing costs
- $16,200
- Reserves months
- —
- Total cash needed
- —
Loan-product check · same deal, 3 products live
Conventional
25% down · 7.5% · 30yr
- Down + closing
- —
- Monthly P&I
- —
- Monthly cashflow
- —
- DSCR
- —
- Eligible?
- —
Personal DTI + credit; lowest rate.
DSCR
20% down · 8.5% · 30yr
- Down + closing
- —
- Monthly P&I
- —
- Monthly cashflow
- —
- DSCR
- —
- Eligible?
- —
No personal income docs; deal must DSCR.
Hard money
10% down · 12.0% · 12mo
- Down + closing
- —
- Monthly P&I
- —
- Monthly cashflow
- —
- DSCR
- —
- Eligible?
- —
Short-term bridge; refi at stabilization.
Rent comps 1 comps
| Address | Beds | Baths | Sqft | Rent | $/sqft | DOM | Units | Dist |
|---|---|---|---|---|---|---|---|---|
| 14 Calef St Unit 16 Cranston, RI | 5.0 | 3.0 | 3000 | $3,500 | $1.17 | 19d | 1 | 1.25mi |
Listing history 2 events
-
2026-05-15status Pending
-
2026-05-12$540,000 Active
ⓘ Source: listings_history table (triggers on properties + properties_extension) + one-shot
backfill from property_details.listing_events for pre-trigger history.
Tax reassessment forecast RI · Partial reset (capped growth)
- Current annual tax
- $4,908 · $409/mo
- Projected year-2 tax
- $6,855 · $571/mo
- Expected delta
- +$1,947/yr (+$162/mo · 39.7%)
ⓘ Screening estimate from a state-policy table — verify with the county assessor before closing.
Nearby sold comps map
Loading sold comps map…
Walkable amenities ~0.75 mi
Loading nearby amenities…
Taxation est. · year 1
- Rental income
- $55,512
- − Mortgage interest
- −$30,248
- − Property taxes
- −$4,908
- − Insurance
- −$2,700
- − Repairs & maintenance
- −$4,441
- − Management
- −$4,441
- − Depreciation
- −$15,709
- Taxable loss
- −$6,935
- Est. tax savings @ 24.0%
- +$1,664
- After-tax cash flow
- $3,929/yr
For passive investors: Depreciation is non-cash, so a rental often shows a tax loss while cash-flowing — sheltering income. Rental losses are passive: they offset passive income freely, and up to $25,000/yr can offset ordinary (W-2) income if you actively participate and your MAGI is under $100k (phasing out to $0 by $150k); unused losses carry forward. On sale, claimed depreciation is recaptured at up to 25%, and gains may owe capital-gains tax (a 1031 exchange can defer both). Figures are a year-1 estimate at your 24.0% rate — not tax advice; consult a CPA.
Schools (NCES district)
- District
- Johnston
- NCES district ID
- 4400540
- Math proficiency
- 13% ▼ -11.00%
- Reading proficiency
- 32% ▼ -5.00%
- Median HH income
- $57,182
- Composite
- 20.6/100
- National rank
- #8551
- State rank
- #28 of 39 in RI
Livability — Cranston
- Score
- 87/100
- State rank
- #1
- US rank
- #323
Category grades
Schools grade is shown separately in the Schools card above.
Census & demographics
- County
- Providence County · 548,917 people
- City population
- 72,803
- Metro
- Providence-Warwick, RI-MA
- Population (ZIP)
- 29,802
- Household income
- $91,775
- Rent vs Own
- Severe rent burden
- 497.0
Population outlook (Providence County) Hauer SSP2
- Today (2025)
- 653,469 people
- By 2030
- 660,819 · +1.1%
- By 2040
- 672,747 · +3.0%
- By 2050
- 683,741 · +4.6%
- By 2075
- 720,435 · +10.2%
- By 2100
- 741,582 · +13.5%
Race, ethnicity, and origin ACS 2023
- Neighborhood character
- Predominantly White (75%)
- Race & ethnicity
- White 75% Hispanic / Latino 17% Two or more races 14% Black 3%
- Hispanic origin (detail)
- Mexican 3% Puerto Rican 3% Cuban 1% Dominican 3%
- Common ancestry
- Lithuanian 7% Russian 4% Romanian 3%
- Foreign-born
- 11% · Canada, Jamaica
- Languages at home
- 81% English-only · Spanish 12% Other Indo-European 2% French/Haitian/Cajun 1%
Political lean MEDSL · Providence
- 2024 margin
- D (+14.4) · D 56.1% · R 41.7% · Other 2.2%
- 2008→2024 swing
- -20.0pp toward R · 2008: 34.4pp · 2024: 14.4pp
- All cycles
- 2024: D+14.4 2020: D+22.9 2016: D+21.2 2012: D+34.9 2008: D+34.4
Not yet ingested
- Civics
- —
Market trends
- HPI YoY
- ▼ -384.46%
- Current HPI
- 355.3054
- Rent YoY
- —
- Metro
- Providence-Warwick, RI-MA
- State GDP YoY
- ▲ 2.25%
- F500 in state
- 10
Industry mix (Fortune 500 HQ in RI)
| Industry | F500 HQs | Revenue |
|---|---|---|
| Healthcare | 1 | $373B |
|
||
| Food Distribution | 1 | $31B |
|
||
| Aerospace / Defense | 1 | $14B |
|
||
| Financial Services | 1 | $8B |
|
||
| Consumer Goods | 1 | $4B |
|
||
Price history
2 events — show timeline
- 2026-05-15 Pending — RIS
- 2026-05-12 Listed $540,000 RIS
Property tax history
+2.4%/yrLatest (2025): $4,908 · +2.1% YoY. Source: county tax records.
Cash-flow waterfall
monthlySold comps — $/sqft
last 12 mo · ≤1 miLoading sold comps…