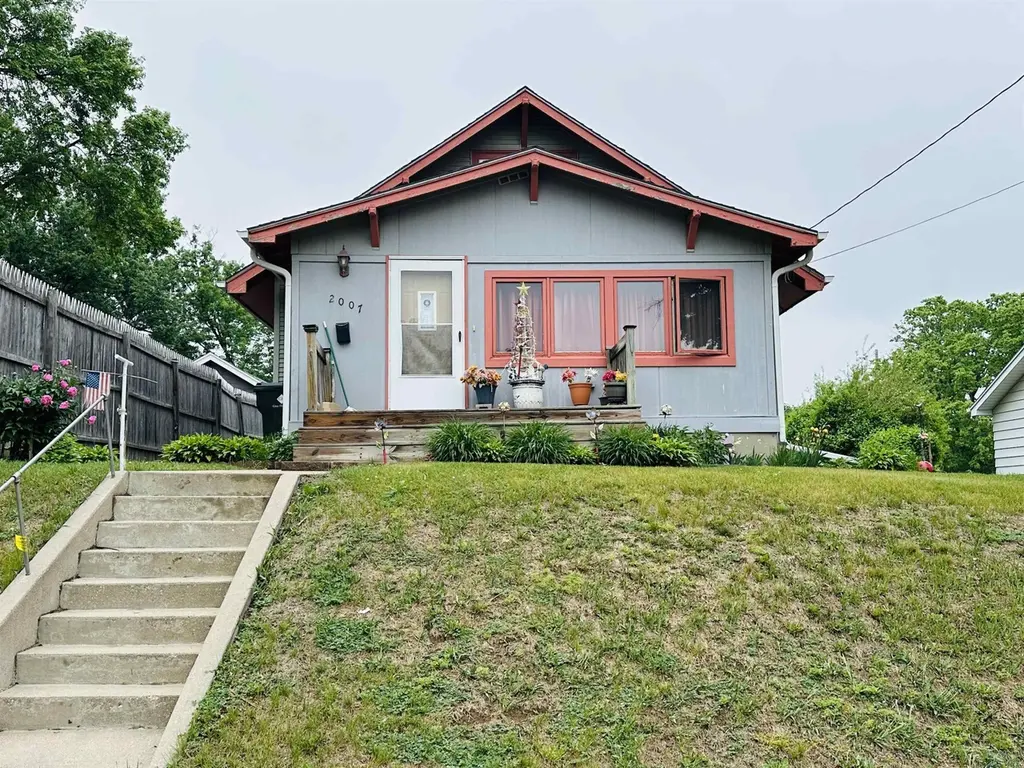
2007 W 5th St · Sioux City, IA
Flood risk 1/10 · Minimal
- FEMA flood zone
- X (unshaded)
- Chance of flooding over 30 yrs
- 0.0%
- Est. flood insurance / yr
- $473 – $860
Fire risk 5/10 · Moderate
- Est. fire insurance / yr
- $902 – $1,676
Heat risk 3/10 · Minor
- Hot days now (above 102°F)
- 7 days/yr
- Hot days in 30 yrs
- 15 days/yr
Wind risk 2/10 · Minimal
- Chance of severe wind over 30 yrs
- —
Air-quality risk 1/10 · Minimal
- Unhealthy air days now
- 0 days/yr
- Unhealthy air days in 30 yrs
- 0 days/yr
Risk factors via First Street. Map © Google.
Why this score? — see what drove the D grade
The composite is a weighted blend of 9 inputs, each scored 0–100. Each bar is that input's sub-score; the figure is the points it added to the 100-point composite (weight × sub-score).
- Cash flow +13.4/30.0
- ARV discount +9.4/15.0
- Schools +4.7/10.0
- DSCR +4.0/10.0
- Livability +3.9/5.0
- 1% rule +3.2/10.0
- Rent growth +2.5/5.0
- Condition / age +2.5/5.0
- Appreciation +0.0/10.0
$149,000
🖨 Deal sheet (PDF) 📄 Offer letter ✓ Due diligence
Listing remarks
Welcome to this cozy and exceptionally well-maintained bungalow offering 1,442 total finished square feet and showcasing pride of ownership throughout. This very clean home features beautiful original hardwood floors that have been refinished and are in excellent condition, adding warmth and character throughout much of the home. The updated kitchen, refreshed main-floor bathroom, and comfortable main-floor bedroom provide both style and functionality, along with the convenience of main-floor laundry. The upstairs dormer is currently used as an additional bedroom, offering flexible living space. The partially finished basement includes a bedroom with an egress window and a bathroom featurin
Key facts
- Updated kitchen
- Backyard shed
- Upstairs dormer
Tags
Property features AI
Finance
- Other: Zoned residential (RES)
Exterior
- Parking: No designated parking
- Security: Smoke detector(s)
- Utilities: Public water; Public sewer
- Home design: Single family residence; Residential property
- Construction: Vinyl siding; Shingle roof; 310 sq ft of below-grade finished area
- Exterior features: Deck; Patio; Shed(s)
Interior
- Kitchen: Eat-in kitchen
- Flooring: Hardwood floors
- Bathrooms: 1 full bathroom; 1 half bathroom
- Heating & cooling: Natural gas heating; Forced air heating; Central air conditioning
- Interior features: Eat-in kitchen; Full, partially finished basement; Main-level laundry
- Laundry & utility: Laundry on main level
Neighborhood map
What this means for you Summary
Snapshot
- This is a 3-bed/1.0-bath single-family listed at $149k.
Deal economics
- At list price, monthly cash flow is $2 ($29/yr) — positive.
- The deal already cash-flows at list — no discount required.
- To meet the 1% rule (rent ≥ 1% of price), the offer needs to be $123k (17.5% below list).
- Recommended offer: $123k (17.5% below list) — sets the bar for 1% rule.
- Cap rate 6.3% vs local median 3.7% in Sioux City — top-decile yield for the area; either an underpriced asset or a hidden risk that comps aren't pricing in. Stress-test before assuming the spread holds.
Location & tenants
- Location reads 78/100 on livability (#138 in IA, #2,544 nationally) — a middle-class / working-renter tenant base. Strengths: cost of living A+, housing A+, health & safety A+; Watch: crime F, commute F.
- Sioux City Community School District (urban): math 54% / reading 57% proficiency, ranked #264 of 289 in IA (top 91%) — acceptable for families but not a draw, mixed tenant base, ~2y average lease.
- Zoned schools: Loess Hills Elementary (math 64% / reading 54%, grade B-, #428 of 616 statewide, top 70%, 589 students, 60% FRL); West Middle School (math 54% / reading 54%, grade B-, #206 of 246 statewide, top 84%, 864 students, 48% FRL); West High School (math 44% / reading 58%, grade D+, #308 of 336 statewide, top 92%, 1,252 students, 76% FRL).
- Market conditions: 80 active listings in the ZIP; 2 comparable units currently listed for rent nearby; 170 units permitted in Woodbury County in 2024 (90 in 5+ unit buildings).
Forward outlook
- Local home prices are declining (-3.0%/yr); year-one equity from $1k of loan paydown is wiped out by about $4k of value loss. Plan a longer hold.
Negotiation context
- It's been on market 33 days — a 3% lower offer ($145k) is reasonable based on typical stale-listing flexibility.
- Current owner paid $73k; list at $149k implies a 104% gain — meaningful room to come down on a strong offer.
Risks & watch-outs
- Watch-outs: built in 1924 — expect roof / HVAC / electrical / plumbing capex.
- Climate carrying-cost: moderate wildfire risk — expect insurance premiums to compound above CPI over the hold.
Questions for the listing agent
- It's been on market 33 days. Have you received any prior offers? Is the seller open to a 18% concession, seller financing, or rate buy-down credit?
- Built in 1924 — when were the roof, HVAC, electrical panel, plumbing, and water heater last replaced?
- Is there a deadline driving the sale (1031 exchange, divorce, estate, relocation)? That informs how much negotiation room exists.
- Crime grade is F in this area — have there been break-ins, vandalism, or insurance claims at this property in the last 3 years? What carrier currently insures it and at what premium?
- The area grade is low — what's the realistic commute time and amenity access for the typical tenant pool here? Any planned neighborhood developments (good or bad) we should know about?
- What's the average days-on-market for RENTAL listings here right now (not sales)? A rising rental-DOM trend means longer vacancies and softer asking-rent achievability than the comps imply.
- What's the recent tenant-quality profile in this submarket — average credit score on applications, eviction rate, late-payment / NSF rate, and stable-employment percentage? A property-management company in the area should have these aggregated.
- How much new for-sale + rental construction is in the pipeline within 1–3 miles? Heavy new supply typically softens prices + rents 12–24 months out; constrained supply supports both.
Investment metrics
- 1% rule
- 0.82% ✗
- Cap rate
- 6.31%
- Cash-on-cash
- 0.07%
- DSCR
- 1.00
- GRM
- 10.1
CMA / ARV
- ARV (on-the-fly)
- $155,708
- Comps found
- 12
Show comp detail 12 sales within ~0.75 mi
| Address | Dist | Beds/Ba | Sqft | Sold | Price | $/sf | Match |
|---|---|---|---|---|---|---|---|
| 1907 W 6th St St | 0.11mi | 3/1.0 | 1,116 (-4%) | 6mo | $63,767 | $57 | 83 |
| 1923 W 6th St | 0.08mi | 3/1.0 | 1,074 (-8%) | 2mo | $174,950 | $163 | 82 |
| 411 Judd St | 0.23mi | 2/1.0 (-1) | 1,173 (+1%) | 2mo | $38,000 | $32 | 81 |
| 2125 Villa Ave | 0.19mi | 3/1.0 | 1,196 (+3%) | 10mo | $120,000 | $100 | 78 |
| 314 George St | 0.43mi | 3/1.0 | 1,160 (-0%) | 3mo | $155,000 | $134 | 77 |
| 2215 W 6th St | 0.18mi | 3/1.5 | 1,064 (-8%) | 2mo | $158,300 | $149 | 74 |
| 2326 W 3rd St | 0.35mi | 3/2.0 | 1,248 (+7%) | 1mo | $160,000 | $128 | 67 |
| 1222 W 5th St | 0.57mi | 3/1.0 | 1,061 (-9%) | 4mo | $182,000 | $172 | 56 |
| 316 S Dorman St | 0.60mi | 2/1.5 (-1) | 1,174 (+1%) | 10mo | $200,000 | $170 | 55 |
| 304 S Judd St | 0.56mi | 4/1.0 (+1) | 1,211 (+4%) | 8mo | $142,000 | $117 | 55 |
| 2515 W Highland Ave | 0.57mi | 2/1.0 (-1) | 1,020 (-12%) | 0mo | $65,000 | $64 | 48 |
| 324 S Casselman St | 0.72mi | 2/2.0 (-1) | 1,139 (-2%) | 7mo | $180,000 | $158 | 48 |
Match score weights: distance 35% · size 25% · config 20% · recency 20%. Top-matched comps best support the ARV.
Projected returns pro-forma
-3.0% appreciation · 3.0% rent growth · sell at horizon
- IRR
- -16.2%
- Equity multiple
- 0.42×
- Total profit
- $-24,010
- Equity at exit
- $22,216
- IRR
- -7.9%
- Equity multiple
- 0.50×
- Total profit
- $-20,787
- Equity at exit
- $12,883
Cash invested: $41,720 (down + closing). Projections, not guarantees.
Landlord ↔ Tenant lean methodology
- Overall (STATE)
- 83 Strongly Landlord-Friendly
- State Iowa
- 83 Strongly Landlord-Friendly · R+6
- County
- — inherits STATE
- City
- — inherits STATE
ZIP-level market 51103
- Home prices YoY
- -23.0%
- Active inventory
- 80
- Price-to-rent
- 10.1×
Monthly cashflow live
- Estimated rent
- $1,229 medium interval (Pro) →
- Mortgage (P&I)
- −$781
- Tax from tax record
- −$125 /mo · $1,498/yr
- Insurance
- −$62
- HOA
- −$0
- Vacancy / Maint / Mgmt
- −$258
- Net cashflow
- $2
Break-even live
Sensitivity live
| Price | -10% $87 | -5% $45 | +0% $2 | +5% $-40 | +10% $-82 |
|---|---|---|---|---|---|
| Rent | -10% $-95 | -5% $-46 | +0% $2 | +5% $51 | +10% $99 |
| Rate | -1.0pp $77 | -0.5pp $40 | base $2 | +0.5pp $-36 | +1.0pp $-75 |
UW: 25.0% down · 7.5% · 30yr · 1.5% tax · 5.0% vac · 8.0% maint · 8.0% mgmt
Financing live
Cash to close
- Down payment
- $37,250
- Closing costs
- $4,470
- Reserves months
- —
- Total cash needed
- —
Loan-product check · same deal, 3 products live
Conventional
25% down · 7.5% · 30yr
- Down + closing
- —
- Monthly P&I
- —
- Monthly cashflow
- —
- DSCR
- —
- Eligible?
- —
Personal DTI + credit; lowest rate.
DSCR
20% down · 8.5% · 30yr
- Down + closing
- —
- Monthly P&I
- —
- Monthly cashflow
- —
- DSCR
- —
- Eligible?
- —
No personal income docs; deal must DSCR.
Hard money
10% down · 12.0% · 12mo
- Down + closing
- —
- Monthly P&I
- —
- Monthly cashflow
- —
- DSCR
- —
- Eligible?
- —
Short-term bridge; refi at stabilization.
Rent comps 2 comps
| Address | Beds | Baths | Sqft | Rent | $/sqft | DOM | Units | Dist |
|---|---|---|---|---|---|---|---|---|
| 2309 W 19th St Sioux City, IA | 2.0 | 1.0 | 1200 | $1,000 | $0.83 | 45d | 1 | 0.64mi |
| 705 Douglas St Sioux City, IA | 2.0 | 2.0 | 1252 | $1,775 | $1.42 | 45d | 5 | 1.46mi |
Listing history 19 events
-
2026-06-21days on market $149,000 Active 33 DOM
-
2026-06-19days on market $149,000 Active 31 DOM
-
2026-06-18days on market $149,000 Active 30 DOM
-
2026-06-17days on market $149,000 Active 29 DOM
-
2026-06-16days on market $149,000 Active 28 DOM
-
2026-06-15days on market $149,000 Active 27 DOM
-
2026-06-14days on market $149,000 Active 25 DOM
-
2026-06-12days on market $149,000 Active 24 DOM
-
2026-06-09days on market $149,000 Active 21 DOM
-
2026-06-08days on market $149,000 Active 20 DOM
-
2026-06-07days on market $149,000 Active 19 DOM
-
2026-06-05pricedays on market $149,000 Active 16 DOM
-
2026-06-02days on market $159,000 Active 14 DOM
-
2026-06-01days on market $159,000 Active 13 DOM
-
2026-05-31days on market $159,000 Active 12 DOM
-
2026-05-30days on market $159,000 Active 11 DOM
-
2026-05-19$159,000 Active
-
2017-08-10soldstatus $73,000
-
2014-08-15soldstatus $45,000
ⓘ Source: listings_history table (triggers on properties + properties_extension) + one-shot
backfill from property_details.listing_events for pre-trigger history.
Tax reassessment forecast IA · Partial reset (capped growth)
- Current annual tax
- $1,498 · $125/mo
- Projected year-2 tax
- $1,919 · $160/mo
- Expected delta
- +$421/yr (+$35/mo · 28.1%)
ⓘ Screening estimate from a state-policy table — verify with the county assessor before closing.
Climate risk First Street
- Flood 1/10 Low FEMA zone X (unshaded) · 0% chance over 30 yrs
- Wildfire 5/10 Major
- Heat 3/10 Moderate 7 d/yr ≥102°F today · 15 d/yr by 30 yrs out
- Wind 2/10 Low
- Air quality 1/10 Low 0 unhealthy d/yr today · 0 by 30 yrs out
Nearby sold comps map
Loading sold comps map…
Walkable amenities ~0.75 mi
Loading nearby amenities…
Taxation est. · year 1
- Rental income
- $14,745
- − Mortgage interest
- −$8,346
- − Property taxes
- −$1,498
- − Insurance
- −$745
- − Repairs & maintenance
- −$1,180
- − Management
- −$1,180
- − Depreciation
- −$4,335
- Taxable loss
- −$2,538
- Est. tax savings @ 24.0%
- +$609
- After-tax cash flow
- $638/yr
For passive investors: Depreciation is non-cash, so a rental often shows a tax loss while cash-flowing — sheltering income. Rental losses are passive: they offset passive income freely, and up to $25,000/yr can offset ordinary (W-2) income if you actively participate and your MAGI is under $100k (phasing out to $0 by $150k); unused losses carry forward. On sale, claimed depreciation is recaptured at up to 25%, and gains may owe capital-gains tax (a 1031 exchange can defer both). Figures are a year-1 estimate at your 24.0% rate — not tax advice; consult a CPA.
Schools (NCES district)
- District
- Sioux City Community School District
- NCES district ID
- 1926400
- Math proficiency
- 54% ▼ -7.00%
- Reading proficiency
- 57% ▼ -2.00%
- Median HH income
- $44,967
- Composite
- 46.86/100
- National rank
- #2371
- State rank
- #264 of 289 in IA
Livability — Sioux City
- Score
- 78/100
- State rank
- #138
- US rank
- #2544
Category grades
Schools grade is shown separately in the Schools card above.
Census & demographics
- Census place
- Sioux City, IA
- City population
- 51,789
- Population (ZIP)
- 17,145
Population outlook (Woodbury County) Hauer SSP2
- Today (2025)
- 103,226 people
- By 2030
- 103,060 · -0.2%
- By 2040
- 102,533 · -0.7%
- By 2050
- 102,788 · -0.4%
- By 2075
- 107,227 · +3.9%
- By 2100
- 113,980 · +10.4%
Race, ethnicity, and origin ACS 2023
- Neighborhood character
- Diverse neighborhood (Simpson 0.62)
- Race & ethnicity
- White 53% Hispanic / Latino 31% Two or more races 18% Asian 4% Black 4% Native American 4%
- Hispanic origin (detail)
- Mexican 20%
- Common ancestry
- Iranian 3% Portuguese 3% Slovak 2%
- Foreign-born
- 16% · Canada, Vietnam
- Languages at home
- 70% English-only · Spanish 23% Vietnamese 3% German/W. Germanic 1%
Political lean MEDSL · Woodbury
- 2024 margin
- Strong R (+23.0) · D 37.8% · R 60.9% · Other 1.3%
- 2008→2024 swing
- -22.5pp toward R · 2008: -0.5pp · 2024: -23.0pp
- All cycles
- 2024: R+23.0 2020: R+15.5 2016: R+19.9 2012: R+0.2 2008: R+0.5
Not yet ingested
- Civics
- —
Market trends
- HPI YoY
- ▼ -78.41%
- Current HPI
- 262.3809
- Rent YoY
- —
- Metro
- —
- State GDP YoY
- ▲ 2.48%
- F500 in state
- 4
Industry mix (Fortune 500 HQ in IA)
| Industry | F500 HQs | Revenue |
|---|---|---|
| Financial Services | 1 | $16B |
|
||
| Retail / Convenience | 1 | $15B |
|
||
Price history
+231.1% since first listed4 events — show timeline
- 2026-06-03 Price Changed $149,000 NWIA
- 2026-05-19 Listed $159,000 NWIA
- 2017-08-10 Sold (Public Records) $73,000 Public Records
- 2014-08-15 Sold (Public Records) $45,000 Public Records
Property tax history
+5.7%/yrLatest (2025): $1,498 · +4.0% YoY. Source: county tax records.
Cash-flow waterfall
monthlySold comps — $/sqft
last 12 mo · ≤1 miLoading sold comps…