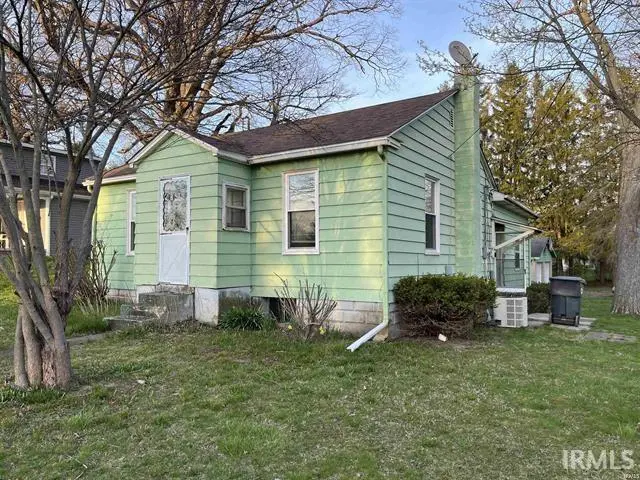
600 N Hartford Rd · Eaton, IN
Flood risk 9/10 · Severe
- FEMA flood zone
- X (unshaded)
- Chance of flooding over 30 yrs
- 0.99%
- Est. flood insurance / yr
- $473 – $860
Fire risk 1/10 · Minimal
- Est. fire insurance / yr
- $717 – $1,331
Heat risk 3/10 · Minor
- Hot days now (above 100°F)
- 7 days/yr
- Hot days in 30 yrs
- 18 days/yr
Wind risk 2/10 · Minimal
- Chance of severe wind over 30 yrs
- 1.0%
Air-quality risk 3/10 · Minor
- Unhealthy air days now
- 2 days/yr
- Unhealthy air days in 30 yrs
- 4 days/yr
Risk factors via First Street. Map © Google.
Why this score? — see what drove the C+ grade
The composite is a weighted blend of 9 inputs, each scored 0–100. Each bar is that input's sub-score; the figure is the points it added to the 100-point composite (weight × sub-score).
- Cash flow +23.7/30.0
- ARV discount +15.0/15.0
- DSCR +7.6/10.0
- 1% rule +6.0/10.0
- Schools +4.1/10.0
- Livability +3.6/5.0
- Rent growth +2.5/5.0
- Condition / age +2.5/5.0
- Appreciation +0.0/10.0
$94,900
🖨 Deal sheet 📄 Offer letter ✓ Due diligence
Listing remarks
Spacious home located in Delta School District. It has a large corner lot and a detached 2 car garage. This home has a large family room, living room, eat in kitchen, 3 bedrooms, a full bath and a half bath. In 2022 it was completely remodeled with all new flooring, paint, fixtures, and a brand new roof.
Key facts
- Large corner lot
- Completely remodeled
- New flooring
Tags
Property features AI
Finance
- HOA & community: No association amenities
Exterior
- Parking: Detached garage; Gravel parking; 2 garage spaces
- Security: Smoke detectors
- Utilities: Public water; Public sewer; Cable available
- Home design: Single-family residence (site-built); One-story
- Construction: Aluminum siding; Block foundation; Partial basement with sump pump and crawl space
- Exterior features: Patio; Corner, level lot; No fencing; Shingle roof
Interior
- Kitchen: Eat-in kitchen; Laminate counters
- Bedrooms: Total rooms: 6
- Flooring: Vinyl flooring
- Bathrooms: One full bathroom; One half bathroom; Two main-level bathrooms
- Heating & cooling: Natural gas heating with forced air; Central air conditioning
- Interior features: Eat-in kitchen; Laminate countertops; One fireplace (no fireplace features listed)
- Laundry & utility: Washer hookup in basement; Gas water heater
Neighborhood map
What this means for you Summary
Snapshot
- This is a 3-bed/1.0-bath single-family listed at $95k.
Deal economics
- At list price, monthly cash flow is $125 ($1k/yr) — positive.
- The deal already cash-flows at list — no discount required.
- Meets the 1% rule at list price ($1k rent vs $95k).
Location & tenants
- Location reads 71/100 on livability (#132 in IN) — a middle-class / working-renter tenant base. Strengths: crime A+, cost of living A+, housing A+; Watch: employment D+, health & safety D, amenities F.
- Delaware Community School Corporation (rural): math 43% / reading 51% proficiency, ranked #76 of 301 in IN (top 25%) — families likely to look elsewhere, expect single-tenant / working-renter base with shorter leases.
- Zoned schools: Eaton Elementary School (math 52% / reading 47%, grade D, #279 of 994 statewide, top 30%, 268 students, 66% FRL); Delta Middle School (math 28% / reading 45%, grade F, #156 of 330 statewide, top 48%, 633 students, 51% FRL); Delta High School (math 57% / reading 77%, grade B, #24 of 369 statewide, top 7%, 787 students, 43% FRL) — zoned schools average 53% FRL vs 32% district-wide (22 pts higher); higher-poverty schools than district average — tighter screening recommended.
- Market conditions: 10 active listings in the ZIP; 171 units permitted in Delaware County in 2024 (57 in 5+ unit buildings).
Forward outlook
- Local home prices are declining (-3.0%/yr); year-one equity from $656 of loan paydown is wiped out by about $3k of value loss. Plan a longer hold.
- Delaware County population projected at -11% by 2050 — secular population decline; favor cash flow + early exit over multi-decade hold.
Negotiation context
- Only 10 days on market — expect competitive offers; lowballing is unlikely to land.
- 10 sale attempts since 9y ago with the ask held roughly flat each time — persistent listings suggest the price (not the market) is what's stuck; bring a comps-based counter.
- Current owner paid $72k; 32% above their basis — modest negotiation headroom, anchor on the comps not their cost.
Risks & watch-outs
- Watch-outs: flood insurance adds $56/mo; built in 1920 — expect roof / HVAC / electrical / plumbing capex.
- Climate carrying-cost: severe flood risk — expect insurance premiums to compound above CPI over the hold.
Questions for the listing agent
- Built in 1920 — when were the roof, HVAC, electrical panel, plumbing, and water heater last replaced?
- What's the actual annual flood-insurance premium (NFIP or private), and is the property in a SFHA with mandatory coverage?
- Is there a deadline driving the sale (1031 exchange, divorce, estate, relocation)? That informs how much negotiation room exists.
- What's the average days-on-market for RENTAL listings here right now (not sales)? A rising rental-DOM trend means longer vacancies and softer asking-rent achievability than the comps imply.
- What's the recent tenant-quality profile in this submarket — average credit score on applications, eviction rate, late-payment / NSF rate, and stable-employment percentage? A property-management company in the area should have these aggregated.
- How much new for-sale + rental construction is in the pipeline within 1–3 miles? Heavy new supply typically softens prices + rents 12–24 months out; constrained supply supports both.
Investment metrics
- 1% rule
- 1.10% ✓
- Cap rate
- 8.57%
- Cash-on-cash
- 8.14%
- DSCR
- 1.36
- GRM
- 7.6
CMA / ARV
- ARV (on-the-fly)
- $114,062
- Comps found
- 3
Show comp detail 3 sales within ~0.75 mi
| Address | Dist | Beds/Ba | Sqft | Sold | Price | $/sf | Match |
|---|---|---|---|---|---|---|---|
| 523 W Indiana Ave | 0.53mi | 3/1.0 | 1,056 (-1%) | 2mo | $152,000 | $144 | 72 |
| 417 E Washington St | 0.31mi | 4/1.0 (+1) | 1,163 (+9%) | 2mo | $124,000 | $107 | 63 |
| 407 E South St | 0.43mi | 2/1.0 (-1) | 1,076 (+1%) | 12mo | $10,000 | $9 | 63 |
Match score weights: distance 35% · size 25% · config 20% · recency 20%. Top-matched comps best support the ARV.
Projected returns pro-forma
-3.0% appreciation · 3.0% rent growth · sell at horizon
- IRR
- -7.5%
- Equity multiple
- 0.72×
- Total profit
- $-7,388
- Equity at exit
- $14,150
- IRR
- 2.1%
- Equity multiple
- 1.15×
- Total profit
- $3,976
- Equity at exit
- $8,205
Cash invested: $26,572 (down + closing). Projections, not guarantees.
Landlord ↔ Tenant lean methodology
- Overall (STATE)
- 90 Strongly Landlord-Friendly
- State Indiana
- 90 Strongly Landlord-Friendly · R+11
- County
- — inherits STATE
- City
- — inherits STATE
ZIP-level market 47338
- Home prices YoY
- -5.3%
- Active inventory
- 10
- Price-to-rent
- 7.6×
Monthly cashflow live
- Estimated rent
- $1,045 medium interval (Pro) →
- Mortgage (P&I)
- −$498
- Tax from tax record
- −$108 /mo · $1,298/yr
- Insurance
- −$40
- Flood insurance flood zone
- −$56 /mo · $666/yr
- HOA
- −$0
- Vacancy / Maint / Mgmt
- −$219
- Net cashflow
- $125
Break-even live
UW: 25.0% down · 7.5% · 30yr · 1.5% tax · 5.0% vac · 8.0% maint · 8.0% mgmt
Financing live
Cash to close
- Down payment
- $23,725
- Closing costs
- $2,847
- Reserves months
- —
- Total cash needed
- —
Loan-product check · same deal, 3 products live
Conventional
25% down · 7.5% · 30yr
- Down + closing
- —
- Monthly P&I
- —
- Monthly cashflow
- —
- DSCR
- —
- Eligible?
- —
Personal DTI + credit; lowest rate.
DSCR
20% down · 8.5% · 30yr
- Down + closing
- —
- Monthly P&I
- —
- Monthly cashflow
- —
- DSCR
- —
- Eligible?
- —
No personal income docs; deal must DSCR.
Hard money
10% down · 12.0% · 12mo
- Down + closing
- —
- Monthly P&I
- —
- Monthly cashflow
- —
- DSCR
- —
- Eligible?
- —
Short-term bridge; refi at stabilization.
Listing history 20 events
-
2026-04-30status Pending
-
2026-04-20$94,900 Active
-
2023-06-20soldstatus $72,000 Closed
-
2023-06-20soldstatus $72,000 Closed
-
2023-05-24status Pending
-
2023-05-24status Pending
-
2023-04-28status Active
-
2023-04-28status Active
-
2023-04-17status Pending
-
2023-04-17status Pending
-
2023-04-10$79,900 Active
-
2023-04-10$79,900 Active
-
2018-06-26soldstatus $36,000
-
2018-03-01$42,900
-
2018-01-31historical
-
2017-07-31$42,500
-
2017-07-31$42,500
-
2017-07-19historical
-
2017-01-23$59,900
-
2017-01-19$55,000
ⓘ Source: listings_history table (triggers on properties + properties_extension) + one-shot
backfill from property_details.listing_events for pre-trigger history.
Tax reassessment forecast IN · Partial reset (capped growth)
- Current annual tax
- $1,298 · $108/mo
- Projected year-2 tax
- $1,298 · $108/mo
- Expected delta
- $0/yr ($0/mo · 0.0%)
ⓘ Screening estimate from a state-policy table — verify with the county assessor before closing.
Climate risk First Street
- Flood 9/10 Extreme FEMA zone X (unshaded) · 99% chance over 30 yrs
- Wildfire 1/10 Low
- Heat 3/10 Moderate 7 d/yr ≥100°F today · 18 d/yr by 30 yrs out
- Wind 2/10 Low 100% chance of damaging wind over 30 yrs
- Air quality 3/10 Moderate 2 unhealthy d/yr today · 4 by 30 yrs out
Nearby sold comps map
Loading sold comps map…
Walkable amenities ~0.75 mi
Loading nearby amenities…
Taxation est. · year 1
- Rental income
- $12,542
- − Mortgage interest
- −$5,316
- − Property taxes
- −$1,298
- − Insurance
- −$1,141
- − Repairs & maintenance
- −$1,003
- − Management
- −$1,003
- − Depreciation
- −$2,761
- Taxable income
- $20
- Est. tax owed @ 24.0%
- −$5
- After-tax cash flow
- $1,492/yr
For passive investors: Depreciation is non-cash, so a rental often shows a tax loss while cash-flowing — sheltering income. Rental losses are passive: they offset passive income freely, and up to $25,000/yr can offset ordinary (W-2) income if you actively participate and your MAGI is under $100k (phasing out to $0 by $150k); unused losses carry forward. On sale, claimed depreciation is recaptured at up to 25%, and gains may owe capital-gains tax (a 1031 exchange can defer both). Figures are a year-1 estimate at your 24.0% rate — not tax advice; consult a CPA.
Schools (NCES district)
- District
- Delaware Community School Corporation
- NCES district ID
- 1802660
- Math proficiency
- 43% ▼ -13.00%
- Reading proficiency
- 51% ▼ -10.00%
- Median HH income
- $54,665
- Composite
- 40.72/100
- National rank
- #3659
- State rank
- #76 of 301 in IN
Livability — Eaton
- Score
- 71/100
- State rank
- #132
- US rank
- #6844
Category grades
Schools grade is shown separately in the Schools card above.
Census & demographics
- Census place
- Eaton, IN
- County
- Delaware · 2,378 people
- Metro
- Muncie, IN
- Population (ZIP)
- 2,378
- Household income
- $62,064
- Rent vs Own
- Severe rent burden
- 5.6
Population outlook (Delaware County) Hauer SSP2
- Today (2025)
- 113,036 people
- By 2030
- 111,313 · -1.5%
- By 2040
- 106,432 · -5.8%
- By 2050
- 100,747 · -10.9%
- By 2075
- 91,000 · -19.5%
- By 2100
- 80,687 · -28.6%
Race, ethnicity, and origin ACS 2023
- Neighborhood character
- Predominantly White (93%)
- Race & ethnicity
- White 93% Two or more races 6% Hispanic / Latino 4%
- Common ancestry
- Italian 2% Slovak 1% Scottish 1%
- Foreign-born
- 1%
- Languages at home
- 99% English-only · Spanish 1%
Political lean MEDSL · Delaware
- 2024 margin
- R (+15.8) · D 41.2% · R 57.0% · Other 1.8%
- 2008→2024 swing
- -30.8pp toward R · 2008: 15.0pp · 2024: -15.8pp
- All cycles
- 2024: R+15.8 2020: R+13.2 2016: R+13.7 2012: D+3.1 2008: D+15.0
Not yet ingested
- Civics
- —
Market trends
- HPI YoY
- ▼ -12.59%
- Current HPI
- 226.7114
- Rent YoY
- —
- Metro
- —
- State GDP YoY
- ▲ 2.90%
- F500 in state
- 18
Industry mix (Fortune 500 HQ in IN)
| Industry | F500 HQs | Revenue |
|---|---|---|
| Industrial Machinery | 2 | $37B |
|
||
| Healthcare | 1 | $177B |
|
||
| Pharmaceuticals | 1 | $45B |
|
||
| Metals / Steel | 1 | $18B |
|
||
| Agriculture | 1 | $17B |
|
||
| Packaging | 1 | $12B |
|
||
Price history
+72.5% since first listed20 events — show timeline
- 2026-04-30 Pending — IRMLS
- 2026-04-20 Listed $94,900 IRMLS
- 2023-06-20 Sold (MLS) $72,000 MIBOR as Distributed by MLS Grid
- 2023-06-20 Sold (MLS) $72,000 IRMLS
- 2023-05-24 Pending — IRMLS
- 2023-05-24 Pending — MIBOR as Distributed by MLS Grid
- 2023-04-28 Relisted — IRMLS
- 2023-04-28 Relisted — MIBOR as Distributed by MLS Grid
- 2023-04-17 Pending — IRMLS
- 2023-04-17 Pending — MIBOR as Distributed by MLS Grid
- 2023-04-10 Listed $79,900 MIBOR as Distributed by MLS Grid
- 2023-04-10 Listed $79,900 IRMLS
- 2018-06-26 Sold (MLS) $36,000 IRMLS
- 2018-03-01 Listed $42,900 IRMLS
- 2018-01-31 Listing Removed — MIBOR as Distributed by MLS Grid
- 2017-07-31 Listed $42,500 MIBOR as Distributed by MLS Grid
- 2017-07-31 Listed $42,500 IRMLS
- 2017-07-19 Listing Removed — MIBOR as Distributed by MLS Grid
- 2017-01-23 Listed $59,900 MIBOR as Distributed by MLS Grid
- 2017-01-19 Listed $55,000 IRMLS
Property tax history
+15.2%/yrLatest (2024): $1,298 · +8.0% YoY. Source: county tax records.
Cash-flow waterfall
monthlySold comps — $/sqft
last 12 mo · ≤1 miLoading sold comps…