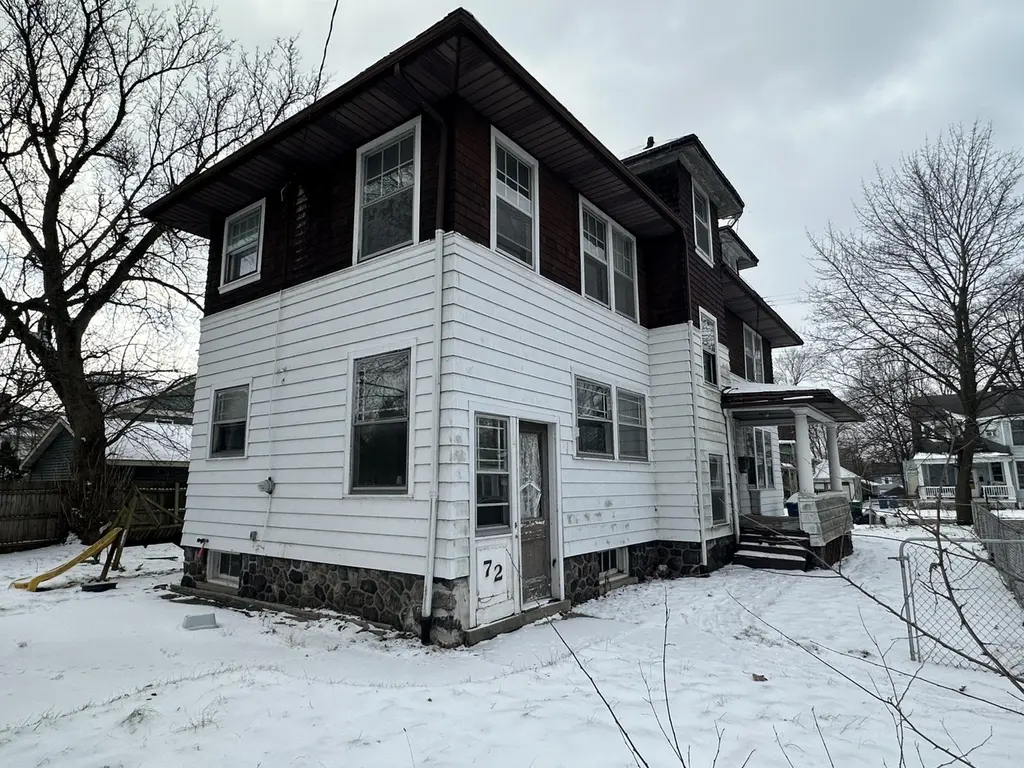
72 Fremont St · Battle Creek, MI
Flood risk 1/10 · Minimal
- FEMA flood zone
- X (unshaded)
- Chance of flooding over 30 yrs
- 0.0%
- Est. flood insurance / yr
- $473 – $860
Fire risk 1/10 · Minimal
- Est. fire insurance / yr
- $784 – $1,456
Heat risk 3/10 · Minor
- Hot days now (above 97°F)
- 7 days/yr
- Hot days in 30 yrs
- 16 days/yr
Wind risk 2/10 · Minimal
- Chance of severe wind over 30 yrs
- —
Air-quality risk 3/10 · Minor
- Unhealthy air days now
- 2 days/yr
- Unhealthy air days in 30 yrs
- 3 days/yr
Risk factors via First Street. Map © Google.
Why this score? — see what drove the C grade
The composite is a weighted blend of 9 inputs, each scored 0–100. Each bar is that input's sub-score; the figure is the points it added to the 100-point composite (weight × sub-score).
- Cash flow +20.8/30.0
- ARV discount +14.0/15.0
- DSCR +6.6/10.0
- 1% rule +5.4/10.0
- Livability +3.7/5.0
- Rent growth +2.5/5.0
- Condition / age +2.5/5.0
- Schools +1.1/10.0
- Appreciation +0.0/10.0
$160,000
🖨 Deal sheet (PDF) 📄 Offer letter ✓ Due diligence
Listing remarks MLS
Massive historic gem, with a brand new roof! This home is perfect for those who appreciate intact historical character. The interior features hardwood floors and original woodwork, a very large living room with a fireplace and built-ins, an office with leaded glass, a formal dining area alongside a breakfast space with more built-in cabinets--not to mention a whopping 5 bedrooms! The 3 car garage gives tremendous vehicle and personal storage, with the basement providing more storage yet. For those willing to take on the work, they will be rewarded with a timeless historic gem now catered to their own vision!
Key facts
- Brand new roof
- Large living room
- Original woodwork
Tags
Property features AI
Exterior
- Parking: Detached garage; 3-car garage (detached)
- Utilities: Public water; Electricity available; Natural gas available and connected
- Home design: Traditional style; Single-family residence; Residential property
- Construction: Built in 1902; Aluminum siding and wood siding; Composition roof; Full basement
- Exterior features: Paved road access; Lot of about 0.21 acres
Interior
- Kitchen: Range; Refrigerator
- Bedrooms: Primary bedroom; Bedroom 2; Bedroom 3; Bedroom 4; Bedroom 5; Additional flexible rooms (several other rooms listed as 'Other')
- Bathrooms: 1 full bathroom; 1 half bathroom; Primary bathroom
- Heating & cooling: Hot water heating; Heating present
- Interior features: Garage door opener; Fireplace
- Laundry & utility: Dedicated laundry room; Natural gas water heater
Neighborhood map
What this means for you Summary
Snapshot
- This is a 5-bed/1.5-bath single-family listed at $160k.
Deal economics
- At list price, monthly cash flow is $220 ($3k/yr) — positive.
- The deal already cash-flows at list — no discount required.
- Meets the 1% rule at list price ($2k rent vs $160k).
- Cap rate 7.9% vs local median 5.2% in Battle Creek — top-decile yield for the area; either an underpriced asset or a hidden risk that comps aren't pricing in. Stress-test before assuming the spread holds.
Location & tenants
- Location reads 73/100 on livability (#198 in MI) — a middle-class / working-renter tenant base. Strengths: cost of living A+, housing A+, health & safety A+; Watch: schools C-, amenities C-, crime F.
- Battle Creek Public Schools (urban): math 8% / reading 19% proficiency, ranked #510 of 540 in MI (top 94%) — low school quality limits family demand, transient renter base, plan for 1-2y turnover; 75% free/reduced lunch — lower-income household profile, screen leases tightly.
- Market conditions: 155 active listings in the ZIP; 132 units permitted in Calhoun County in 2024 (0 in 5+ unit buildings).
- This rent runs 33% of the median local income ($61k/yr) — at the standard rent-burdened threshold; future hikes will face affordability resistance.
Forward outlook
- Local home prices are declining (-3.0%/yr); year-one equity from $1k of loan paydown is wiped out by about $5k of value loss. Plan a longer hold.
- Calhoun County population projected at -16% by 2050 — secular population decline; favor cash flow + early exit over multi-decade hold.
Negotiation context
- Only 3 days on market — expect competitive offers; lowballing is unlikely to land.
- 14 sale attempts since 21y ago with the ask held roughly flat each time — persistent listings suggest the price (not the market) is what's stuck; bring a comps-based counter.
- Current owner paid $100k; list at $160k implies a 60% gain — meaningful room to come down on a strong offer.
Risks & watch-outs
- Watch-outs: built in 1902 — expect roof / HVAC / electrical / plumbing capex.
Questions for the listing agent
- Built in 1902 — when were the roof, HVAC, electrical panel, plumbing, and water heater last replaced?
- Is there a deadline driving the sale (1031 exchange, divorce, estate, relocation)? That informs how much negotiation room exists.
- Crime grade is F in this area — have there been break-ins, vandalism, or insurance claims at this property in the last 3 years? What carrier currently insures it and at what premium?
- What's the average days-on-market for RENTAL listings here right now (not sales)? A rising rental-DOM trend means longer vacancies and softer asking-rent achievability than the comps imply.
- What's the recent tenant-quality profile in this submarket — average credit score on applications, eviction rate, late-payment / NSF rate, and stable-employment percentage? A property-management company in the area should have these aggregated.
- How much new for-sale + rental construction is in the pipeline within 1–3 miles? Heavy new supply typically softens prices + rents 12–24 months out; constrained supply supports both.
Investment metrics
- 1% rule
- 1.04% ✓
- Cap rate
- 7.94%
- Cash-on-cash
- 5.90%
- DSCR
- 1.26
- GRM
- 8.0
CMA / ARV
- ARV (median comp)
- $187,153
- List price
- $160,000
- Delta
- -33.21%
- Verdict
- UNDERPRICED
- Comps
- 20 within 1.0 mi
Show comp detail 10 sales within ~0.75 mi
| Address | Dist | Beds/Ba | Sqft | Sold | Price | $/sf | Match |
|---|---|---|---|---|---|---|---|
| 192 Fremont St | 0.26mi | 4/1.5 (-1) | 2,710 (+1%) | 0mo | $194,000 | $72 | 81 |
| 72 Latta St | 0.26mi | 4/1.5 (-1) | 2,620 (-2%) | 4mo | $185,000 | $71 | 76 |
| 87 Sherman Rd | 0.24mi | 4/2.5 (-1) | 2,758 (+3%) | 3mo | $240,000 | $87 | 72 |
| 162 Orchard Ave | 0.39mi | 4/2.5 (-1) | 2,608 (-2%) | 6mo | $240,000 | $92 | 64 |
| 54 Chestnut St | 0.13mi | 5/2.0 | 2,876 (+8%) | 20mo | $185,000 | $64 | 63 |
| 14 Elizabeth St | 0.24mi | 4/1.5 (-1) | 2,394 (-10%) | 6mo | $165,500 | $69 | 61 |
| 40 Poplar St | 0.31mi | 5/3.0 | 2,890 (+8%) | 12mo | $209,000 | $72 | 56 |
| 223 Fremont St | 0.33mi | 4/1.5 (-1) | 2,460 (-8%) | 20mo | $180,000 | $73 | 50 |
| 149 Fremont St | 0.16mi | 4/1.5 (-1) | 2,312 (-14%) | 18mo | $175,320 | $76 | 50 |
| 141 N Broad St | 0.63mi | 4/2.0 (-1) | 2,704 (+1%) | 15mo | $209,460 | $77 | 49 |
Match score weights: distance 35% · size 25% · config 20% · recency 20%. Top-matched comps best support the ARV.
Projected returns pro-forma
-3.0% appreciation · 3.0% rent growth · sell at horizon
- IRR
- -7.2%
- Equity multiple
- 0.73×
- Total profit
- $-11,888
- Equity at exit
- $23,857
- IRR
- 2.4%
- Equity multiple
- 1.17×
- Total profit
- $7,767
- Equity at exit
- $13,834
Cash invested: $44,800 (down + closing). Projections, not guarantees.
Landlord ↔ Tenant lean methodology
- Overall (STATE)
- 62 Landlord-Friendly
- State Michigan
- 62 Landlord-Friendly · EVEN
- County
- — inherits STATE
- City
- — inherits STATE
ZIP-level market 49017
- Home prices YoY
- -32.2%
- Active inventory
- 155
- Price-to-rent
- 8.0×
Monthly cashflow live
- Estimated rent
- $1,659 medium interval (Pro) →
- Mortgage (P&I)
- −$839
- Tax from tax record
- −$184 /mo · $2,213/yr
- Insurance
- −$67
- HOA
- −$0
- Vacancy / Maint / Mgmt
- −$348
- Net cashflow
- $220
Break-even live
Sensitivity live
| Price | -10% $311 | -5% $265 | +0% $220 | +5% $175 | +10% $130 |
|---|---|---|---|---|---|
| Rent | -10% $89 | -5% $155 | +0% $220 | +5% $286 | +10% $351 |
| Rate | -1.0pp $301 | -0.5pp $261 | base $220 | +0.5pp $179 | +1.0pp $137 |
UW: 25.0% down · 7.5% · 30yr · 1.5% tax · 5.0% vac · 8.0% maint · 8.0% mgmt
Financing live
Cash to close
- Down payment
- $40,000
- Closing costs
- $4,800
- Reserves months
- —
- Total cash needed
- —
Loan-product check · same deal, 3 products live
Conventional
25% down · 7.5% · 30yr
- Down + closing
- —
- Monthly P&I
- —
- Monthly cashflow
- —
- DSCR
- —
- Eligible?
- —
Personal DTI + credit; lowest rate.
DSCR
20% down · 8.5% · 30yr
- Down + closing
- —
- Monthly P&I
- —
- Monthly cashflow
- —
- DSCR
- —
- Eligible?
- —
No personal income docs; deal must DSCR.
Hard money
10% down · 12.0% · 12mo
- Down + closing
- —
- Monthly P&I
- —
- Monthly cashflow
- —
- DSCR
- —
- Eligible?
- —
Short-term bridge; refi at stabilization.
Listing history 43 events
-
2026-06-21days on market $160,000 Active 3 DOM
-
2026-06-19pricedays on market $160,000 Active 1 DOM
-
2026-06-18days on market $125,000 Active 151 DOM
Show marketing remark (615 chars)
Massive historic gem, with a brand new roof! This home is perfect for those who appreciate intact historical character. The interior features hardwood floors and original woodwork, a very large living room with a fireplace and built-ins, an office with leaded glass, a formal dining area alongside a breakfast space with more built-in cabinets--not to mention a whopping 5 bedrooms! The 3 car garage gives tremendous vehicle and personal storage, with the basement providing more storage yet. For those willing to take on the work, they will be rewarded with a timeless historic gem now catered to their own vision!
-
2026-06-17days on market $125,000 Active 150 DOM
-
2026-06-16days on market $125,000 Active 149 DOM
-
2026-06-15days on market $125,000 Active 148 DOM
-
2026-06-14days on market $125,000 Active 146 DOM
-
2026-06-13days on market $125,000 Active 145 DOM
-
2026-06-10days on market $125,000 Active 143 DOM
-
2026-06-09days on market $125,000 Active 142 DOM
-
2026-06-08days on market $125,000 Active 141 DOM
-
2026-06-07days on market $125,000 Active 140 DOM
-
2026-06-05days on market $125,000 Active 137 DOM
-
2026-06-02days on market $125,000 Active 135 DOM
-
2026-06-01days on market $125,000 Active 134 DOM
-
2026-05-31days on market $125,000 Active 133 DOM
-
2026-05-30days on market $125,000 Active 132 DOM
-
2026-01-19$125,000 Active 766-char remark
-
2026-01-19$125,000 Active 766-char remark
-
2026-01-19$125,000 Active
-
2020-11-02soldstatus $99,900
-
2020-10-23soldstatus $99,900
-
2020-10-23soldstatus $99,900 Sold
-
2020-10-23soldstatus $99,900
-
2020-08-27status Pending
-
2020-07-21status Active
-
2020-07-16status Pending
-
2020-07-08price $94,000
-
2020-06-27status Active
-
2020-06-20status Pending
-
2020-06-09$94,000
-
2020-06-09$99,000 Active
-
2020-06-09$94,000
-
2017-10-30historical
-
2017-10-30historical
-
2017-07-28price $92,000
-
2017-07-14$98,500 Active
-
2017-07-14$92,000
-
2005-10-14soldstatus $88,500
-
2005-09-30soldstatus $88,500
-
2005-09-30soldstatus $88,500
-
2005-07-18$89,900
-
2005-07-18$89,900
ⓘ Source: listings_history table (triggers on properties + properties_extension) + one-shot
backfill from property_details.listing_events for pre-trigger history.
Tax reassessment forecast MI · Partial reset (capped growth)
- Current annual tax
- $2,213 · $184/mo
- Projected year-2 tax
- $2,338 · $195/mo
- Expected delta
- +$126/yr (+$10/mo · 5.7%)
ⓘ Screening estimate from a state-policy table — verify with the county assessor before closing.
Climate risk First Street
- Flood 1/10 Low FEMA zone X (unshaded) · 0% chance over 30 yrs
- Wildfire 1/10 Low
- Heat 3/10 Moderate 7 d/yr ≥97°F today · 16 d/yr by 30 yrs out
- Wind 2/10 Low
- Air quality 3/10 Moderate 2 unhealthy d/yr today · 3 by 30 yrs out
Nearby sold comps map
Loading sold comps map…
Walkable amenities ~0.75 mi
Loading nearby amenities…
Taxation est. · year 1
- Rental income
- $19,903
- − Mortgage interest
- −$8,962
- − Property taxes
- −$2,213
- − Insurance
- −$800
- − Repairs & maintenance
- −$1,592
- − Management
- −$1,592
- − Depreciation
- −$4,655
- Taxable income
- $89
- Est. tax owed @ 24.0%
- −$21
- After-tax cash flow
- $2,621/yr
For passive investors: Depreciation is non-cash, so a rental often shows a tax loss while cash-flowing — sheltering income. Rental losses are passive: they offset passive income freely, and up to $25,000/yr can offset ordinary (W-2) income if you actively participate and your MAGI is under $100k (phasing out to $0 by $150k); unused losses carry forward. On sale, claimed depreciation is recaptured at up to 25%, and gains may owe capital-gains tax (a 1031 exchange can defer both). Figures are a year-1 estimate at your 24.0% rate — not tax advice; consult a CPA.
Schools (NCES district)
- District
- Battle Creek Public Schools
- NCES district ID
- 2600005
- Math proficiency
- 8% ▼ -2.00%
- Reading proficiency
- 19% ▬ 0.00%
- Median HH income
- $31,697
- Composite
- 10.73/100
- National rank
- #9769
- State rank
- #510 of 540 in MI
Livability — Battle Creek
- Score
- 73/100
- State rank
- #198
- US rank
- #5031
Category grades
Schools grade is shown separately in the Schools card above.
Census & demographics
- Census place
- Battle Creek, MI
- County
- Calhoun County · 91,590 people
- City population
- 91,590
- Metro
- Battle Creek, MI
- Population (ZIP)
- 21,295
- Household income
- $60,885
- Rent vs Own
- Severe rent burden
- 697.0
Population outlook (Calhoun County) Hauer SSP2
- Today (2025)
- 130,157 people
- By 2030
- 126,691 · -2.7%
- By 2040
- 118,517 · -8.9%
- By 2050
- 109,855 · -15.6%
- By 2075
- 90,486 · -30.5%
- By 2100
- 70,766 · -45.6%
Race, ethnicity, and origin ACS 2023
- Neighborhood character
- Predominantly White (78%)
- Race & ethnicity
- White 78% Black 9% Two or more races 8% Hispanic / Latino 6%
- Hispanic origin (detail)
- Mexican 4%
- Common ancestry
- Slovak 3% Iranian 3% Romanian 2%
- Foreign-born
- 3% · Canada, Philippines
- Languages at home
- 95% English-only · Spanish 2% Other Asian/Pacific 1% Arabic 1%
Political lean MEDSL · Calhoun
- 2024 margin
- R (+14.1) · D 42.3% · R 56.4% · Other 1.3%
- 2008→2024 swing
- -23.4pp toward R · 2008: 9.4pp · 2024: -14.1pp
- All cycles
- 2024: R+14.1 2020: R+11.1 2016: R+12.5 2012: D+1.6 2008: D+9.4
Not yet ingested
- Civics
- —
Market trends
- HPI YoY
- ▼ -115.68%
- Current HPI
- 243.5008
- Rent YoY
- —
- Metro
- Battle Creek, MI
- State GDP YoY
- ▲ 1.37%
- F500 in state
- 28
Industry mix (Fortune 500 HQ in MI)
| Industry | F500 HQs | Revenue |
|---|---|---|
| Automotive Parts | 3 | $48B |
|
||
| Automotive | 2 | $372B |
|
||
| Chemicals | 1 | $45B |
|
||
| Automotive Retail | 1 | $29B |
|
||
| Healthcare / Medical Devices | 1 | $23B |
|
||
| Automotive Technology | 1 | $20B |
|
||
Price history
+78.0% since first listed30 events — show timeline
- 2026-06-18 Listing Removed — REALCOMP
- 2026-06-18 Listing Removed — MiRealSource-MiMLS
- 2026-06-18 Listed $160,000 SW Michigan MLS
- 2026-06-18 Listed $160,000 REALCOMP
- 2026-06-18 Listed $160,000 MiRealSource-MiMLS
- 2026-01-19 Listed $125,000 MiRealSource-MiMLS
- 2026-01-19 Listed $125,000 REALCOMP
- 2020-11-02 Sold (Public Records) $99,900 Public Records
- 2020-10-23 Sold (MLS) $99,900 MiRealSource-MiMLS
- 2020-10-23 Sold (MLS) $99,900 SW Michigan MLS
- 2020-10-23 Sold (MLS) $99,900 REALCOMP
- 2020-08-27 Pending — SW Michigan MLS
- 2020-07-21 Relisted — SW Michigan MLS
- 2020-07-16 Pending — SW Michigan MLS
- 2020-07-08 Price Changed $94,000 SW Michigan MLS
- 2020-06-27 Relisted — SW Michigan MLS
- 2020-06-20 Pending — SW Michigan MLS
- 2020-06-09 Listed $94,000 MiRealSource-MiMLS
- 2020-06-09 Listed $99,000 SW Michigan MLS
- 2020-06-09 Listed $94,000 REALCOMP
- 2017-10-30 Listing Removed — SW Michigan MLS
- 2017-10-30 Listing Removed — REALCOMP
- 2017-07-28 Price Changed $92,000 SW Michigan MLS
- 2017-07-14 Listed $98,500 SW Michigan MLS
- 2017-07-14 Listed $92,000 REALCOMP
- 2005-10-14 Sold (Public Records) $88,500 Public Records
- 2005-09-30 Sold (MLS) $88,500 REALCOMP
- 2005-09-30 Sold (MLS) $88,500 SW Michigan MLS
- 2005-07-18 Listed $89,900 REALCOMP
- 2005-07-18 Listed $89,900 SW Michigan MLS
Property tax history
-1.4%/yrLatest (2025): $2,213 · -25.2% YoY. Source: county tax records.
Cash-flow waterfall
monthlySold comps — $/sqft
last 12 mo · ≤1 miLoading sold comps…