 Duplex
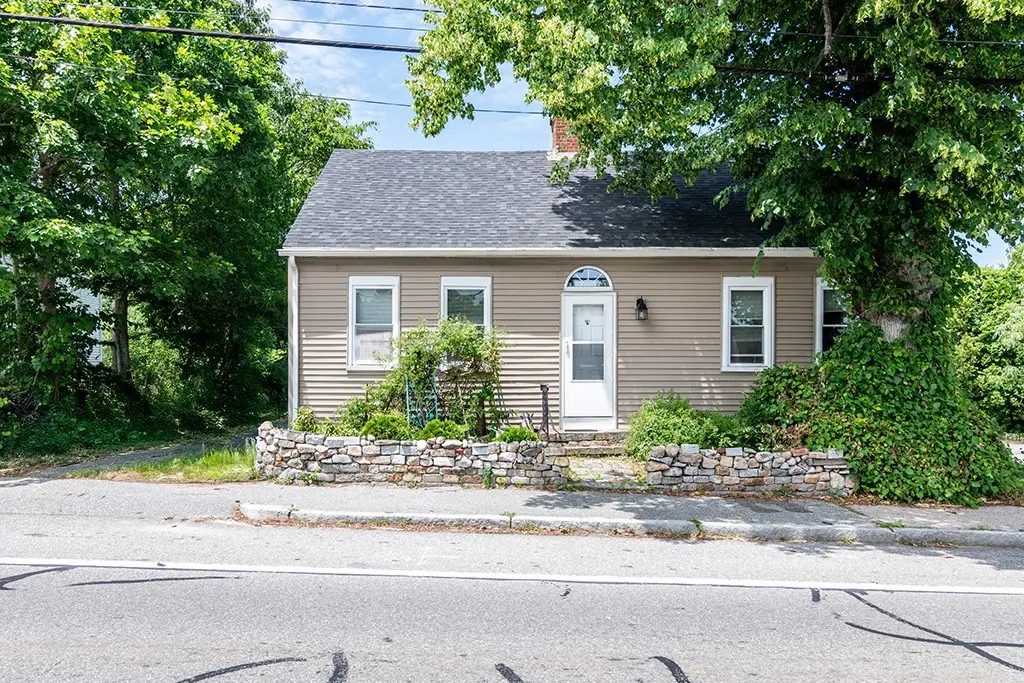
661 Washington St · Warwick, RI
Flood risk 6/10 · Moderate
- FEMA flood zone
- X (shaded)
- Chance of flooding over 30 yrs
- 0.96%
- Est. flood insurance / yr
- $473 – $860
Fire risk 3/10 · Minor
- Est. fire insurance / yr
- $835 – $1,551
Heat risk 5/10 · Moderate
- Hot days now (above 95°F)
- 7 days/yr
- Hot days in 30 yrs
- 16 days/yr
Wind risk 6/10 · Moderate
- Chance of severe wind over 30 yrs
- 74.0%
Air-quality risk 2/10 · Minimal
- Unhealthy air days now
- 2 days/yr
- Unhealthy air days in 30 yrs
- 2 days/yr
Risk factors via First Street. Map © Google.
Why this score? — see what drove the D+ grade
The composite is a weighted blend of 9 inputs, each scored 0–100. Each bar is that input's sub-score; the figure is the points it added to the 100-point composite (weight × sub-score).
- Cash flow +16.5/30.0
- ARV discount +11.2/15.0
- DSCR +5.1/10.0
- 1% rule +4.1/10.0
- Livability +3.9/5.0
- Schools +3.0/10.0
- Rent growth +2.5/5.0
- Condition / age +2.5/5.0
- Appreciation +0.0/10.0
$399,900
🖨 Deal sheet (PDF) 📄 Offer letter ✓ Due diligence
Multi-family units
County records classify this as Multi-Family (2-4 Unit). Listing-text estimate: 2 units. confirmed
Listing remarks MLS
GREAT OPPORTUNITY! THIS HOME WAS ORIGINALLY A 2 FAMILY HOME. HOME IS LOCATED ON ALMOST 1 ACRE OF LAND WITH A STREAM AND BRIDGE. 4 BED 2 BATHS 2 FIREPLACES & MORE
Key facts
- Expansive lot
- Two-family home
- Young roof
Tags
Property features AI
Finance
- Financial info: Multifamily property with 3 units in 2 buildings; Reported rents: two units at $1,400 each (one 1-bedroom and one 2-bedroom); third unit present (2-bedroom) — area sizes reported for units
- HOA & community: Community amenities nearby: golf, highway access, public transportation, recreation area, restaurant, shopping, sidewalks
Exterior
- Parking: No garage; Space for 10 vehicles
- Utilities: Public water (connected); Public sewer (connected); Electric with circuit breaker panel
- Home design: Two-story building; Drywall and vinyl siding construction; Above-grade finished living area reported
- Construction: Drywall exterior walls; Vinyl siding exterior
- Exterior features: Paved driveway; Barn(s) and outbuilding; Spa on the property
Interior
- Kitchen: Dishwasher; Oven; Range; Microwave; Refrigerator; Water heater
- Bedrooms: Three separate unit types: one 1-bedroom unit, two 2-bedroom units (total units: 3)
- Flooring: Hardwood; Carpet
- Bathrooms: 3 full bathrooms and 1 half bathroom (across the property and units)
- Heating & cooling: Hot water gas baseboard heating
- Interior features: Full unfinished basement; Masonry fireplace (1); Bathtub, tub/shower combination, and jetted tub; Interior steps; Cable TV
- Laundry & utility: Common area laundry
Neighborhood map
What this means for you Summary
Snapshot
- This is a 2 × 2-bed/1.8-bath units multifamily listed at $400k.
Deal economics
- At list price, monthly cash flow is $233 ($3k/yr) — positive. Per door: $116/mo.
- The deal already cash-flows at list — no discount required.
- To meet the 1% rule (rent ≥ 1% of price), the offer needs to be $364k (9.1% below list).
- Recommended offer: $364k (9.1% below list) — sets the bar for 1% rule.
- Cap rate 7.0% vs local median 3.3% in Warwick — top-decile yield for the area; either an underpriced asset or a hidden risk that comps aren't pricing in. Stress-test before assuming the spread holds.
Location & tenants
- Location reads 78/100 on livability (#6 in RI, #2,425 nationally) — a middle-class / working-renter tenant base. Strengths: crime A+, commute A+, housing A+; Watch: amenities F.
- Coventry (suburban): math 25% / reading 41% proficiency, ranked #19 of 39 in RI (top 49%) — families likely to look elsewhere, expect single-tenant / working-renter base with shorter leases.
- Zoned schools: Alan Shawn Feinstein Ms of Cov (math 18% / reading 31%, grade F, #28 of 57 statewide, top 48%, 974 students, 29% FRL).
- Market conditions: 177 active listings in the ZIP; 3 comparable units currently listed for rent nearby; rentals at typical pace (median 26d on market — plan ~3-4 weeks tenant-placement turnaround); solid renter incomes; 471 units permitted in Kent County in 2024 (240 in 5+ unit buildings).
- This rent runs 43% of the median local income ($101k/yr) — at the standard rent-burdened threshold; future hikes will face affordability resistance.
Forward outlook
- Local home prices are declining (-3.0%/yr); year-one equity from $3k of loan paydown is wiped out by about $12k of value loss. Plan a longer hold.
- Kent County population projected at -14% by 2050 — secular population decline; favor cash flow + early exit over multi-decade hold.
Negotiation context
- Only 9 days on market — expect competitive offers; lowballing is unlikely to land.
- 2 sale attempts since 22y ago with the ask held roughly flat each time — persistent listings suggest the price (not the market) is what's stuck; bring a comps-based counter.
- Current owner paid $160k; list at $400k implies a 150% gain — meaningful room to come down on a strong offer.
Risks & watch-outs
- Watch-outs: built in 1778 — expect roof / HVAC / electrical / plumbing capex.
- Climate carrying-cost: major flood risk; major wind risk, 74% chance of damaging wind over 30y; extreme-heat days projected 7→16/yr by 2055 (HVAC capex compounding) — expect insurance premiums to compound above CPI over the hold.
Questions for the listing agent
- Can we see the unit-by-unit rent roll, current vacancy, and any below-market leases? What's the average tenancy length?
- What capital expenditures (roof, boiler, parking lot, exteriors) have been made in the last 5 years, and what's planned in the next 2?
- Built in 1778 — when were the roof, HVAC, electrical panel, plumbing, and water heater last replaced?
- Is there a deadline driving the sale (1031 exchange, divorce, estate, relocation)? That informs how much negotiation room exists.
- Schools are D-rated, which usually means shorter tenancies and higher turnover. Who's the typical renter profile here, and what's been the actual vacancy rate?
- The area grade is low — what's the realistic commute time and amenity access for the typical tenant pool here? Any planned neighborhood developments (good or bad) we should know about?
- What's the average days-on-market for RENTAL listings here right now (not sales)? A rising rental-DOM trend means longer vacancies and softer asking-rent achievability than the comps imply.
- What's the recent tenant-quality profile in this submarket — average credit score on applications, eviction rate, late-payment / NSF rate, and stable-employment percentage? A property-management company in the area should have these aggregated.
- How much new apartment / multifamily construction is in the pipeline within 1–3 miles? Heavy new supply (>2% of stock underway) typically softens rents 12–24 months out; light construction supports rent growth.
Investment metrics
- 1% rule
- 0.91% ✗
- Cap rate
- 6.99%
- Cash-on-cash
- 2.50%
- DSCR
- 1.11
- GRM
- 9.2
CMA / ARV
- ARV (on-the-fly)
- $435,960
- Comps found
- 4
Show comp detail 4 sales within ~0.75 mi
| Address | Dist | Beds/Ba | Sqft | Sold | Price | $/sf | Match |
|---|---|---|---|---|---|---|---|
| 34 Sheltra Ave | 0.49mi | 4/2.0 (+1) | 1,696 (-2%) | 11mo | $465,000 | $274 | 56 |
| 794 Washington St | 0.52mi | 3/3.0 | 1,680 (-3%) | 21mo | $270,000 | $161 | 53 |
| 45 Bates Ave | 0.69mi | 4/2.0 (+1) | 1,848 (+7%) | 4mo | $465,000 | $252 | 44 |
| 61 63 Bates Ave | 0.72mi | 4/2.0 (+1) | 1,824 (+5%) | 13mo | $427,000 | $234 | 38 |
Match score weights: distance 35% · size 25% · config 20% · recency 20%. Top-matched comps best support the ARV.
Projected returns pro-forma
-3.0% appreciation · 3.0% rent growth · sell at horizon
- IRR
- -12.4%
- Equity multiple
- 0.55×
- Total profit
- $-49,991
- Equity at exit
- $59,626
- IRR
- -3.3%
- Equity multiple
- 0.78×
- Total profit
- $-24,521
- Equity at exit
- $34,576
Cash invested: $111,972 (down + closing). Projections, not guarantees.
Landlord ↔ Tenant lean methodology
- Overall (STATE)
- 31 Tenant-Leaning
- State Rhode Island
- 31 Tenant-Leaning · D+8
- County
- — inherits STATE
- City
- — inherits STATE
ZIP-level market 02816
- Active inventory
- 177
- Price-to-rent
- 18.3×
Monthly cashflow live
- Estimated rent
- $3,636 high interval (Pro) →
- Mortgage (P&I)
- −$2,097
- Tax from tax record
- −$376 /mo · $4,510/yr
- Insurance
- −$167
- HOA
- −$0
- Vacancy / Maint / Mgmt
- −$764
- Net cashflow
- $233
Break-even live
Sensitivity live
| Price | -10% $459 | -5% $346 | +0% $233 | +5% $120 | +10% $6 |
|---|---|---|---|---|---|
| Rent | -10% $-54 | -5% $89 | +0% $233 | +5% $376 | +10% $520 |
| Rate | -1.0pp $434 | -0.5pp $335 | base $233 | +0.5pp $129 | +1.0pp $24 |
2-unit breakdown (identical units grouped — click to expand)
| Units | Beds | Baths | Est. rent |
|---|---|---|---|
| 2× units | 2 | 1.8 | $3,636 |
| #1 | 2 | 1.8 | $1,818 |
| #2 | 2 | 1.8 | $1,818 |
| Total (2 units) | $3,636 | ||
UW: 25.0% down · 7.5% · 30yr · 1.5% tax · 5.0% vac · 8.0% maint · 8.0% mgmt
Financing live
Cash to close
- Down payment
- $99,975
- Closing costs
- $11,997
- Reserves months
- —
- Total cash needed
- —
Loan-product check · same deal, 3 products live
Conventional
25% down · 7.5% · 30yr
- Down + closing
- —
- Monthly P&I
- —
- Monthly cashflow
- —
- DSCR
- —
- Eligible?
- —
Personal DTI + credit; lowest rate.
DSCR
20% down · 8.5% · 30yr
- Down + closing
- —
- Monthly P&I
- —
- Monthly cashflow
- —
- DSCR
- —
- Eligible?
- —
No personal income docs; deal must DSCR.
Hard money
10% down · 12.0% · 12mo
- Down + closing
- —
- Monthly P&I
- —
- Monthly cashflow
- —
- DSCR
- —
- Eligible?
- —
Short-term bridge; refi at stabilization.
Rent comps 3 comps
| Address | Beds | Baths | Sqft | Rent | $/sqft | DOM | Units | Dist |
|---|---|---|---|---|---|---|---|---|
| 20 W Warwick Ave Unit 3 West Warwick, RI | 2.0 | 1.5 | 1094 | $1,800 | $1.65 | 45d | 1 | 0.94mi |
| 5 Whitman St Coventry, RI | 3.0 | 1.0 | 1200 | $2,850 | $2.38 | 3d | 1 | 0.97mi |
| 8 Saint John St Unit 1 West Warwick, RI | 2.0 | 2.5 | 1200 | $1,795 | $1.50 | 25d | 1 | 1.36mi |
Listing history 7 events
-
2026-06-21days on market $399,900 Active 9 DOM
-
2026-06-18days on market $399,900 Active 6 DOM
-
2026-06-17days on market $399,900 Active 5 DOM
-
2026-06-16days on market $399,900 Active 4 DOM
-
2026-06-15days on market $399,900 Active 3 DOM
-
2026-06-13remarks 699-char remark
-
2026-06-13$399,900 Active 1 DOM
ⓘ Source: listings_history table (triggers on properties + properties_extension) + one-shot
backfill from property_details.listing_events for pre-trigger history.
Tax reassessment forecast RI · Partial reset (capped growth)
- Current annual tax
- $4,510 · $376/mo
- Projected year-2 tax
- $5,514 · $460/mo
- Expected delta
- +$1,004/yr (+$84/mo · 22.3%)
ⓘ Screening estimate from a state-policy table — verify with the county assessor before closing.
Climate risk First Street
- Flood 6/10 Major FEMA zone X (shaded) · 96% chance over 30 yrs
- Wildfire 3/10 Moderate
- Heat 5/10 Major 7 d/yr ≥95°F today · 16 d/yr by 30 yrs out
- Wind 6/10 Major 74% chance of damaging wind over 30 yrs
- Air quality 2/10 Low 2 unhealthy d/yr today · 2 by 30 yrs out
Nearby sold comps map
Loading sold comps map…
Walkable amenities ~0.75 mi
Loading nearby amenities…
Taxation est. · year 1
- Rental income
- $43,632
- − Mortgage interest
- −$22,401
- − Property taxes
- −$4,510
- − Insurance
- −$2,000
- − Repairs & maintenance
- −$3,491
- − Management
- −$3,491
- − Depreciation
- −$11,633
- Taxable loss
- −$3,893
- Est. tax savings @ 24.0%
- +$934
- After-tax cash flow
- $3,729/yr
For passive investors: Depreciation is non-cash, so a rental often shows a tax loss while cash-flowing — sheltering income. Rental losses are passive: they offset passive income freely, and up to $25,000/yr can offset ordinary (W-2) income if you actively participate and your MAGI is under $100k (phasing out to $0 by $150k); unused losses carry forward. On sale, claimed depreciation is recaptured at up to 25%, and gains may owe capital-gains tax (a 1031 exchange can defer both). Figures are a year-1 estimate at your 24.0% rate — not tax advice; consult a CPA.
Schools (NCES district)
- District
- Coventry
- NCES district ID
- 4400210
- Math proficiency
- 25% ▼ -10.00%
- Reading proficiency
- 41% ▼ -10.00%
- Median HH income
- $66,277
- Composite
- 30.18/100
- National rank
- #6317
- State rank
- #19 of 39 in RI
Livability — Warwick
- Score
- 78/100
- State rank
- #6
- US rank
- #2425
Category grades
Schools grade is shown separately in the Schools card above.
Census & demographics
- County
- Kent County · 90,904 people
- City population
- 108,434
- Metro
- Providence-Warwick, RI-MA
- Population (ZIP)
- 33,298
- Household income
- $101,431
- Rent vs Own
- Severe rent burden
- 667.0
Population outlook (Kent County) Hauer SSP2
- Today (2025)
- 160,994 people
- By 2030
- 157,428 · -2.2%
- By 2040
- 148,389 · -7.8%
- By 2050
- 137,995 · -14.3%
- By 2075
- 118,536 · -26.4%
- By 2100
- 102,266 · -36.5%
Race, ethnicity, and origin ACS 2023
- Neighborhood character
- Predominantly White (90%)
- Race & ethnicity
- White 90% Two or more races 6% Hispanic / Latino 5% Asian 1%
- Common ancestry
- Lithuanian 13% Russian 8% Romanian 4%
- Foreign-born
- 3% · Canada, China
- Languages at home
- 94% English-only · Spanish 3% Other Indo-European 1% French/Haitian/Cajun 1%
Political lean MEDSL · Kent
- 2024 margin
- Toss-up / Even · D 49.9% · R 48.1% · Other 2.0%
- 2008→2024 swing
- -15.6pp toward R · 2008: 17.5pp · 2024: 1.9pp
- All cycles
- 2024: D+1.9 2020: D+7.6 2016: R+0.7 2012: D+18.4 2008: D+17.5
Not yet ingested
- Civics
- —
Market trends
- HPI YoY
- ▼ -362.74%
- Current HPI
- 336.2662
- Rent YoY
- —
- Metro
- Providence-Warwick, RI-MA
- State GDP YoY
- ▲ 2.25%
- F500 in state
- 10
Industry mix (Fortune 500 HQ in RI)
| Industry | F500 HQs | Revenue |
|---|---|---|
| Healthcare | 1 | $373B |
|
||
| Food Distribution | 1 | $31B |
|
||
| Aerospace / Defense | 1 | $14B |
|
||
| Financial Services | 1 | $8B |
|
||
| Consumer Goods | 1 | $4B |
|
||
Price history
+100.1% since first listed6 events — show timeline
- 2026-06-12 Listed $399,900 RIS
- 2019-09-20 Price Changed $189,900 RIS
- 2004-06-02 Sold (Public Records) $160,000 Public Records
- 2004-06-01 Sold (MLS) $189,900 RIS
- 2004-04-28 Listing Removed — RIS
- 2004-01-13 Listed $199,900 RIS
Property tax history
+1.7%/yrLatest (2025): $4,510 · +1.6% YoY. Source: county tax records.
Cash-flow waterfall
monthlySold comps — $/sqft
last 12 mo · ≤1 miLoading sold comps…