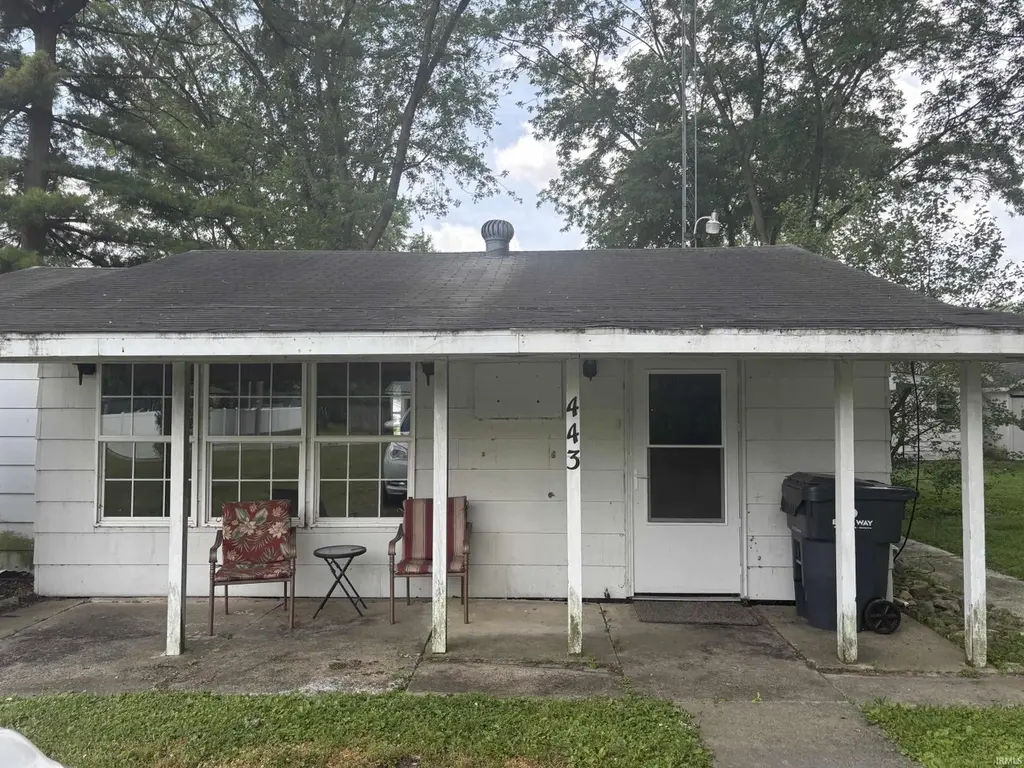
443 W Oil St · Montpelier, IN
Flood risk 1/10 · Minimal
- FEMA flood zone
- X (unshaded)
- Chance of flooding over 30 yrs
- 0.0%
- Est. flood insurance / yr
- $507 – $1,088
Fire risk 1/10 · Minimal
- Est. fire insurance / yr
- $717 – $1,331
Heat risk 3/10 · Minor
- Hot days now (above 99°F)
- 7 days/yr
- Hot days in 30 yrs
- 18 days/yr
Wind risk 2/10 · Minimal
- Chance of severe wind over 30 yrs
- 0.0%
Air-quality risk 3/10 · Minor
- Unhealthy air days now
- 2 days/yr
- Unhealthy air days in 30 yrs
- 3 days/yr
Risk factors via First Street. Map © Google.
Why this score? — see what drove the A- grade
The composite is a weighted blend of 9 inputs, each scored 0–100. Each bar is that input's sub-score; the figure is the points it added to the 100-point composite (weight × sub-score).
- Cash flow +30.0/30.0
- ARV discount +15.0/15.0
- 1% rule +10.0/10.0
- DSCR +10.0/10.0
- Appreciation +8.4/10.0
- Livability +3.4/5.0
- Schools +3.3/10.0
- Rent growth +2.5/5.0
- Condition / age +2.5/5.0
$59,000
🖨 Deal sheet (PDF) 📄 Offer letter ✓ Due diligence
Listing remarks MLS
Single family, one bedroom, 1 bath home. 1 car detached garage. Property sits on 0.36ac. Near downtown.
Key facts
- Covered porch
- Storage shed
- Walk in closet
Tags
Property features AI
Finance
- Other: Property listed by Neff Sales & Development LLC
Exterior
- Parking: Detached gravel garage with 1 garage space
- Utilities: Public water; Public sewer
- Home design: Single-family site-built home; Single-story
- Construction: Masonite exterior; Shingle roof; Slab foundation; Built as site-built construction
- Exterior features: Covered porch; Patio; Porch; Shed(s); Level lot; Lot dimensions approximately 100 x 160; Zoned R-3 Residential District
Interior
- Kitchen: Refrigerator; Water softener (owned)
- Bedrooms: Total of 4 rooms (includes bedrooms and living spaces)
- Flooring: Concrete flooring; Vinyl flooring
- Bathrooms: One full bathroom (main level)
- Heating & cooling: Forced-air natural gas heating; Ceiling fan cooling
- Interior features: Ceiling fans; Window treatments; One fireplace
- Laundry & utility: Laundry on main level
Neighborhood map
What this means for you Summary
Snapshot
- This is a 2-bed/1.0-bath single-family listed at $59k.
Deal economics
- At list price, monthly cash flow is $236 ($3k/yr) — positive.
- The deal already cash-flows at list — no discount required.
- Meets the 1% rule at list price ($883 rent vs $59k).
Location & tenants
- Location reads 68/100 on livability (#230 in IN) — a middle-class / working-renter tenant base. Strengths: crime A+, cost of living A+, housing A+; Watch: health & safety D, amenities F, commute F.
- Blackford County Schools (town): math 37% / reading 41% proficiency, ranked #164 of 301 in IN (top 54%) — families likely to look elsewhere, expect single-tenant / working-renter base with shorter leases.
- Zoned schools: Blackford Primary School (352 students, 65% FRL); Blackford Jr-Sr High School (math 25% / reading 43%, grade F, #285 of 369 statewide, top 78%, 717 students, 50% FRL).
- Market conditions: 26 active listings in the ZIP; 9 units permitted in Blackford County in 2024 (0 in 5+ unit buildings).
Forward outlook
- In year one you build about $4k of equity ($408 loan paydown + $4k appreciation (6.7% local appreciation)).
- Blackford County population projected at -27% by 2050 — secular population decline; favor cash flow + early exit over multi-decade hold.
- At projected returns (6.7% appreciation + 3.0% rent growth), your $17k cash investment doubles in ~3 years — after that, you're playing with house money.
- By year 8, paydown + projected appreciation supports a ~$35k cash-out refi (75% LTV) — recoverable capital for the next deal without selling this one.
Negotiation context
- Only 2 days on market — expect competitive offers; lowballing is unlikely to land.
- 3 sale attempts since 9y ago with the ask held roughly flat each time — persistent listings suggest the price (not the market) is what's stuck; bring a comps-based counter.
- Current owner paid $15k; list at $59k implies a 293% gain — meaningful room to come down on a strong offer.
Risks & watch-outs
- Watch-outs: property tax is 2.6% of price.
Questions for the listing agent
- Property tax is high relative to price — has the assessment been appealed recently, and will the sale trigger a re-assessment?
- Is there a deadline driving the sale (1031 exchange, divorce, estate, relocation)? That informs how much negotiation room exists.
- Schools are D-rated, which usually means shorter tenancies and higher turnover. Who's the typical renter profile here, and what's been the actual vacancy rate?
- What's the average days-on-market for RENTAL listings here right now (not sales)? A rising rental-DOM trend means longer vacancies and softer asking-rent achievability than the comps imply.
- What's the recent tenant-quality profile in this submarket — average credit score on applications, eviction rate, late-payment / NSF rate, and stable-employment percentage? A property-management company in the area should have these aggregated.
- How much new for-sale + rental construction is in the pipeline within 1–3 miles? Heavy new supply typically softens prices + rents 12–24 months out; constrained supply supports both.
Investment metrics
- 1% rule
- 1.50% ✓
- Cap rate
- 11.08%
- Cash-on-cash
- 17.11%
- DSCR
- 1.76
- GRM
- 5.6
CMA / ARV
- ARV (on-the-fly)
- $75,006
- Comps found
- 3
Show comp detail 3 sales within ~0.75 mi
| Address | Dist | Beds/Ba | Sqft | Sold | Price | $/sf | Match |
|---|---|---|---|---|---|---|---|
| 433 W Henderson St | 0.42mi | 3/1.0 (+1) | 936 (+1%) | 1mo | $50,000 | $53 | 73 |
| 440 W Green St | 0.18mi | 2/1.5 | 958 (+4%) | 22mo | $111,900 | $117 | 66 |
| 607 S Elm St | 0.19mi | 2/1.0 | 864 (-7%) | 18mo | $70,000 | $81 | 65 |
Match score weights: distance 35% · size 25% · config 20% · recency 20%. Top-matched comps best support the ARV.
Projected returns pro-forma
6.72% appreciation · 3.0% rent growth · sell at horizon
- IRR
- 31.1%
- Equity multiple
- 3.10×
- Total profit
- $34,638
- Equity at exit
- $39,806
- IRR
- 28.5%
- Equity multiple
- 6.43×
- Total profit
- $89,670
- Equity at exit
- $74,656
Cash invested: $16,520 (down + closing). Projections, not guarantees.
Landlord ↔ Tenant lean methodology
- Overall (STATE)
- 90 Strongly Landlord-Friendly
- State Indiana
- 90 Strongly Landlord-Friendly · R+11
- County
- — inherits STATE
- City
- — inherits STATE
ZIP-level market 47359
- Home prices YoY
- 3.0%
- Active inventory
- 26
- Price-to-rent
- 5.6×
Monthly cashflow live
- Estimated rent
- $883 medium interval (Pro) →
- Mortgage (P&I)
- −$309
- Tax from tax record
- −$128 /mo · $1,532/yr
- Insurance
- −$25
- HOA
- −$0
- Vacancy / Maint / Mgmt
- −$185
- Net cashflow
- $236
Break-even live
Sensitivity live
| Price | -10% $269 | -5% $252 | +0% $236 | +5% $219 | +10% $202 |
|---|---|---|---|---|---|
| Rent | -10% $166 | -5% $201 | +0% $236 | +5% $270 | +10% $305 |
| Rate | -1.0pp $265 | -0.5pp $251 | base $236 | +0.5pp $220 | +1.0pp $205 |
UW: 25.0% down · 7.5% · 30yr · 1.5% tax · 5.0% vac · 8.0% maint · 8.0% mgmt
Financing live
Cash to close
- Down payment
- $14,750
- Closing costs
- $1,770
- Reserves months
- —
- Total cash needed
- —
Loan-product check · same deal, 3 products live
Conventional
25% down · 7.5% · 30yr
- Down + closing
- —
- Monthly P&I
- —
- Monthly cashflow
- —
- DSCR
- —
- Eligible?
- —
Personal DTI + credit; lowest rate.
DSCR
20% down · 8.5% · 30yr
- Down + closing
- —
- Monthly P&I
- —
- Monthly cashflow
- —
- DSCR
- —
- Eligible?
- —
No personal income docs; deal must DSCR.
Hard money
10% down · 12.0% · 12mo
- Down + closing
- —
- Monthly P&I
- —
- Monthly cashflow
- —
- DSCR
- —
- Eligible?
- —
Short-term bridge; refi at stabilization.
Listing history 2 events
-
2026-06-12remarks 436-char remark
-
2026-06-12$59,000 Pending 2 DOM
ⓘ Source: listings_history table (triggers on properties + properties_extension) + one-shot
backfill from property_details.listing_events for pre-trigger history.
Tax reassessment forecast IN · Partial reset (capped growth)
- Current annual tax
- $1,532 · $128/mo
- Projected year-2 tax
- $1,532 · $128/mo
- Expected delta
- $0/yr ($0/mo · 0.0%)
ⓘ Screening estimate from a state-policy table — verify with the county assessor before closing.
Climate risk First Street
- Flood 1/10 Low FEMA zone X (unshaded) · 0% chance over 30 yrs
- Wildfire 1/10 Low
- Heat 3/10 Moderate 7 d/yr ≥99°F today · 18 d/yr by 30 yrs out
- Wind 2/10 Low 0% chance of damaging wind over 30 yrs
- Air quality 3/10 Moderate 2 unhealthy d/yr today · 3 by 30 yrs out
Nearby sold comps map
Loading sold comps map…
Walkable amenities ~0.75 mi
Loading nearby amenities…
Taxation est. · year 1
- Rental income
- $10,591
- − Mortgage interest
- −$3,305
- − Property taxes
- −$1,532
- − Insurance
- −$295
- − Repairs & maintenance
- −$847
- − Management
- −$847
- − Depreciation
- −$1,716
- Taxable income
- $2,048
- Est. tax owed @ 24.0%
- −$492
- After-tax cash flow
- $2,335/yr
For passive investors: Depreciation is non-cash, so a rental often shows a tax loss while cash-flowing — sheltering income. Rental losses are passive: they offset passive income freely, and up to $25,000/yr can offset ordinary (W-2) income if you actively participate and your MAGI is under $100k (phasing out to $0 by $150k); unused losses carry forward. On sale, claimed depreciation is recaptured at up to 25%, and gains may owe capital-gains tax (a 1031 exchange can defer both). Figures are a year-1 estimate at your 24.0% rate — not tax advice; consult a CPA.
Schools (NCES district)
- District
- Blackford County Schools
- NCES district ID
- 1800570
- Math proficiency
- 37% ▼ -12.00%
- Reading proficiency
- 41% ▼ -5.00%
- Median HH income
- $39,653
- Composite
- 32.67/100
- National rank
- #5656
- State rank
- #164 of 301 in IN
Livability — Montpelier
- Score
- 68/100
- State rank
- #230
- US rank
- #9968
Category grades
Schools grade is shown separately in the Schools card above.
Census & demographics
- Census place
- Montpelier, IN
- City population
- 3,688
- Population (ZIP)
- 3,688
Population outlook (Blackford County) Hauer SSP2
- Today (2025)
- 11,183 people
- By 2030
- 10,542 · -5.7%
- By 2040
- 9,292 · -16.9%
- By 2050
- 8,176 · -26.9%
- By 2075
- 6,549 · -41.4%
- By 2100
- 5,636 · -49.6%
Race, ethnicity, and origin ACS 2023
- Neighborhood character
- Predominantly White (90%)
- Race & ethnicity
- White 90% Two or more races 6% Hispanic / Latino 3%
- Common ancestry
- Iranian 1% Lithuanian 1% Slovak 1%
- Foreign-born
- 0% · Vietnam
- Languages at home
- 98% English-only · Vietnamese 2%
Political lean MEDSL · Blackford
- 2024 margin
- Solid R (+50.3) · D 23.9% · R 74.2% · Other 1.9%
- 2008→2024 swing
- -50.1pp toward R · 2008: -0.2pp · 2024: -50.3pp
- All cycles
- 2024: R+50.3 2020: R+46.1 2016: R+43.7 2012: R+16.5 2008: R+0.2
Not yet ingested
- Civics
- —
Market trends
- HPI YoY
- ▲ 6.72%
- Current HPI
- 231.2009
- Rent YoY
- —
- Metro
- —
- State GDP YoY
- ▲ 2.90%
- F500 in state
- 18
Industry mix (Fortune 500 HQ in IN)
| Industry | F500 HQs | Revenue |
|---|---|---|
| Industrial Machinery | 2 | $37B |
|
||
| Healthcare | 1 | $177B |
|
||
| Pharmaceuticals | 1 | $45B |
|
||
| Metals / Steel | 1 | $18B |
|
||
| Agriculture | 1 | $17B |
|
||
| Packaging | 1 | $12B |
|
||
Price history
+249.1% since first listed6 events — show timeline
- 2026-06-12 Pending — IRMLS
- 2026-06-09 Listed $59,000 IRMLS
- 2017-11-22 Sold (MLS) $15,000 IRMLS
- 2017-11-22 Sold (MLS) $15,000 MIBOR as Distributed by MLS Grid
- 2017-10-03 Listed $16,900 IRMLS
- 2017-10-03 Listed $16,900 MIBOR as Distributed by MLS Grid
Property tax history
+13.6%/yrLatest (2025): $1,532 · +11.2% YoY. Source: county tax records.
Cash-flow waterfall
monthlySold comps — $/sqft
last 12 mo · ≤1 miLoading sold comps…