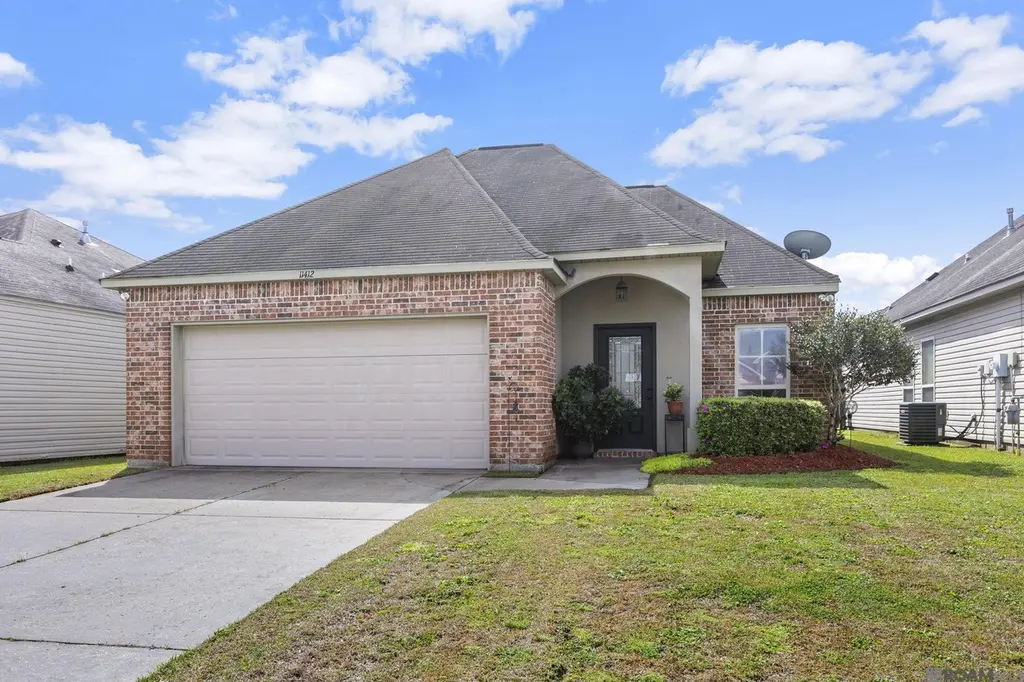
11412 Rossow Ct · Walker, LA
Flood risk 1/10 · Minimal
- FEMA flood zone
- X (unshaded)
- Chance of flooding over 30 yrs
- 0.0%
- Est. flood insurance / yr
- $507 – $1,088
Fire risk 3/10 · Minor
- Est. fire insurance / yr
- $1,269 – $2,357
Heat risk 8/10 · Major
- Hot days now (above 108°F)
- 7 days/yr
- Hot days in 30 yrs
- 23 days/yr
Wind risk 9/10 · Severe
- Chance of severe wind over 30 yrs
- 99.0%
Air-quality risk 3/10 · Minor
- Unhealthy air days now
- 2 days/yr
- Unhealthy air days in 30 yrs
- 3 days/yr
Risk factors via First Street. Map © Google.
Why this score? — see what drove the D grade
The composite is a weighted blend of 9 inputs, each scored 0–100. Each bar is that input's sub-score; the figure is the points it added to the 100-point composite (weight × sub-score).
- Cash flow +14.0/30.0
- ARV discount +6.4/15.0
- DSCR +4.3/10.0
- Schools +4.0/10.0
- Livability +3.8/5.0
- 1% rule +3.5/10.0
- Rent growth +3.5/5.0
- Condition / age +2.5/5.0
- Appreciation +0.0/10.0
$225,000
🖨 Deal sheet (PDF) 📄 Offer letter ✓ Due diligence
Listing remarks MLS
Beautifully maintained 3BR/2BA home in Juban Parc Subdivision, conveniently located in Denham Springs just off Juban Road with easy access to shopping, dining, and everyday conveniences. This wonderful community features residents-only amenities including a sparkling pool, pool house, and playground, making it perfect for relaxation and recreation right in your neighborhood. This better-than-new home has been meticulously cared for and offers great upgrades including a new HVAC system (2024) and new hot water heater (2022). The home is located in Flood Zone X and has never flooded. Inside, you’ll love the open and inviting floor plan with the living room and kitchen flowing seamlessly together, perfect for both everyday living and entertaining. The space opens to a beautiful back patio and fully fenced backyard, ideal for relaxing or hosting guests. The yard is beautifully landscaped and freshly pressure washed, giving the home wonderful curb appeal. The primary suite features a spacious walk-in closet and an ensuite bathroom with double vanities and a tub/shower combination. The washer, dryer, and refrigerator can remain with the new buyer, making this home truly move-in ready. Located just minutes from Juban Crossing, great restaurants, and shopping, this home offers comfort, convenience, and community amenities all in one place.
Key facts
- Pool house
- New hot water heater
- Flood zone x
Tags
Neighborhood map
What this means for you Summary
Snapshot
- This is a 3-bed/2.0-bath single-family listed at $225k.
Deal economics
- At list price, monthly cash flow is $30 ($357/yr) — positive.
- The deal already cash-flows at list — no discount required.
- To meet the 1% rule (rent ≥ 1% of price), the offer needs to be $191k (15.0% below list).
- Recommended offer: $191k (15.0% below list) — sets the bar for 1% rule.
- Cap rate 6.5% vs local median 4.8% in Walker — top-decile yield for the area; either an underpriced asset or a hidden risk that comps aren't pricing in. Stress-test before assuming the spread holds.
Location & tenants
- Location reads 75/100 on livability (#19 in LA, #3,999 nationally) — a middle-class / working-renter tenant base. Strengths: cost of living A+, housing A+, health & safety A+; Watch: crime F, amenities D-, commute F.
- Livingston Parish (suburban): math 40% / reading 52% proficiency, ranked #13 of 98 in LA (top 13%) — families likely to look elsewhere, expect single-tenant / working-renter base with shorter leases.
- Market conditions: Rents rising (+3.8%/yr); 985 active listings in the ZIP; 11 comparable units currently listed for rent nearby; rentals at typical pace (median 25d on market — plan ~3-4 weeks tenant-placement turnaround); 45% of comp listings sitting > 30 days — soft ceiling on asking rent; solid renter incomes; 794 units permitted in Livingston Parish in 2024 (99 in 5+ unit buildings).
Forward outlook
- Local home prices are declining (-3.0%/yr); year-one equity from $2k of loan paydown is wiped out by about $7k of value loss. Plan a longer hold.
- Livingston County population projected at +27% by 2050 — long-run rental-demand tailwind backs the buy-and-hold thesis.
Negotiation context
- It's been on market 85 days — a 6% lower offer ($212k) is reasonable based on typical stale-listing flexibility.
- 6 sale attempts since 18y ago with the ask held roughly flat each time — persistent listings suggest the price (not the market) is what's stuck; bring a comps-based counter.
Risks & watch-outs
- Climate carrying-cost: severe wind risk, 99% chance of damaging wind over 30y; extreme-heat days projected 7→23/yr by 2055 (HVAC capex compounding) — expect insurance premiums to compound above CPI over the hold.
Questions for the listing agent
- It's been on market 85 days. Have you received any prior offers? Is the seller open to a 15% concession, seller financing, or rate buy-down credit?
- What does the HOA fee cover, when was the last increase, and are there any pending special assessments or reserve-fund shortfalls?
- Why hasn't it sold? Are there any deal-killer items the seller is aware of (foundation, flood, title, zoning, code violations)?
- Is there a deadline driving the sale (1031 exchange, divorce, estate, relocation)? That informs how much negotiation room exists.
- Schools are A-rated — typically a magnet for longer-tenancy family renters. What's the average tenant stay here, and is there a school-zone premium baked into asking?
- Crime grade is F in this area — have there been break-ins, vandalism, or insurance claims at this property in the last 3 years? What carrier currently insures it and at what premium?
- The area grade is low — what's the realistic commute time and amenity access for the typical tenant pool here? Any planned neighborhood developments (good or bad) we should know about?
- What's the average days-on-market for RENTAL listings here right now (not sales)? A rising rental-DOM trend means longer vacancies and softer asking-rent achievability than the comps imply.
- What's the recent tenant-quality profile in this submarket — average credit score on applications, eviction rate, late-payment / NSF rate, and stable-employment percentage? A property-management company in the area should have these aggregated.
- How much new for-sale + rental construction is in the pipeline within 1–3 miles? Heavy new supply typically softens prices + rents 12–24 months out; constrained supply supports both.
Investment metrics
- 1% rule
- 0.85% ✗
- Cap rate
- 6.45%
- Cash-on-cash
- 0.57%
- DSCR
- 1.03
- GRM
- 9.8
CMA / ARV
- ARV (median comp)
- $219,504
- List price
- $225,000
- Delta
- 2.50%
- Verdict
- FAIR
- Comps
- 20 within 1.0 mi
Show comp detail 12 sales within ~0.75 mi
| Address | Dist | Beds/Ba | Sqft | Sold | Price | $/sf | Match |
|---|---|---|---|---|---|---|---|
| 11420 Rossow Ct | 0.02mi | 3/2.0 | 1,314 (-3%) | 1mo | $218,000 | $166 | 93 |
| 11474 Ashwood Ct | 0.11mi | 3/2.0 | 1,394 (+3%) | 7mo | $189,900 | $136 | 85 |
| 25742 Raines Ave | 0.16mi | 3/2.0 | 1,463 (+8%) | 3mo | $229,580 | $157 | 77 |
| 25710 Tarver Dr | 0.24mi | 3/2.0 | 1,463 (+8%) | 3mo | $228,990 | $157 | 74 |
| 25710 Tarver Dr | 0.24mi | 3/2.0 | 1,463 (+8%) | 3mo | $228,990 | $157 | 74 |
| 25669 Tarver Dr | 0.25mi | 3/2.0 | 1,495 (+10%) | 1mo | $239,985 | $161 | 71 |
| 25754 Raines Ave | 0.15mi | 4/2.0 (+1) | 1,501 (+10%) | 4mo | $232,990 | $155 | 67 |
| 12235 Dove Hollow Dr | 0.63mi | 3/2.0 | 1,320 (-3%) | 2mo | $225,000 | $170 | 65 |
| 11536 Juban Parc Ave | 0.27mi | 4/2.0 (+1) | 1,550 (+14%) | 3mo | $239,690 | $155 | 56 |
| 11536 Juban Parc Ave | 0.27mi | 4/2.0 (+1) | 1,550 (+14%) | 3mo | $239,690 | $155 | 56 |
| 11572 Juban Parc Ave | 0.33mi | 4/2.0 (+1) | 1,550 (+14%) | 8mo | $239,615 | $155 | 49 |
| 12656 Bald Eagle Dr | 0.62mi | 3/2.0 | 1,521 (+12%) | 3mo | $268,999 | $177 | 49 |
Match score weights: distance 35% · size 25% · config 20% · recency 20%. Top-matched comps best support the ARV.
Projected returns pro-forma
-3.0% appreciation · 3.83% rent growth · sell at horizon
- IRR
- -14.5%
- Equity multiple
- 0.48×
- Total profit
- $-32,970
- Equity at exit
- $33,548
- IRR
- -4.6%
- Equity multiple
- 0.69×
- Total profit
- $-19,613
- Equity at exit
- $19,454
Cash invested: $63,000 (down + closing). Projections, not guarantees.
Landlord ↔ Tenant lean methodology
- Overall (STATE)
- 90 Strongly Landlord-Friendly
- State Louisiana
- 90 Strongly Landlord-Friendly · R+12
- County
- — inherits STATE
- City
- — inherits STATE
ZIP-level market 70726
- Rents YoY
- 3.8%
- Active inventory
- 985
- Price-to-rent
- 9.8×
Monthly cashflow live
- Estimated rent
- $1,913 high interval (Pro) →
- Mortgage (P&I)
- −$1,180
- Tax from tax record
- −$163 /mo · $1,956/yr
- Insurance
- −$94
- HOA
- −$45
- Vacancy / Maint / Mgmt
- −$402
- Net cashflow
- $30
Break-even live
Sensitivity live
| Price | -10% $157 | -5% $93 | +0% $30 | +5% $-34 | +10% $-98 |
|---|---|---|---|---|---|
| Rent | -10% $-121 | -5% $-46 | +0% $30 | +5% $105 | +10% $181 |
| Rate | -1.0pp $143 | -0.5pp $87 | base $30 | +0.5pp $-29 | +1.0pp $-88 |
UW: 25.0% down · 7.5% · 30yr · 1.5% tax · 5.0% vac · 8.0% maint · 8.0% mgmt
Financing live
Cash to close
- Down payment
- $56,250
- Closing costs
- $6,750
- Reserves months
- —
- Total cash needed
- —
Loan-product check · same deal, 3 products live
Conventional
25% down · 7.5% · 30yr
- Down + closing
- —
- Monthly P&I
- —
- Monthly cashflow
- —
- DSCR
- —
- Eligible?
- —
Personal DTI + credit; lowest rate.
DSCR
20% down · 8.5% · 30yr
- Down + closing
- —
- Monthly P&I
- —
- Monthly cashflow
- —
- DSCR
- —
- Eligible?
- —
No personal income docs; deal must DSCR.
Hard money
10% down · 12.0% · 12mo
- Down + closing
- —
- Monthly P&I
- —
- Monthly cashflow
- —
- DSCR
- —
- Eligible?
- —
Short-term bridge; refi at stabilization.
Rent comps 11 comps
| Address | Beds | Baths | Sqft | Rent | $/sqft | DOM | Units | Dist |
|---|---|---|---|---|---|---|---|---|
| 11402 Ashwood Ct Denham Springs, LA | 3.0 | 2.0 | 1331 | $1,750 | $1.31 | 23d | 1 | 0.05mi |
| 11385 Ashwood Ct Denham Springs, LA | 3.0 | 2.0 | 1556 | $1,900 | $1.22 | 45d | 1 | 0.08mi |
| 25729 Raines Ave Dennis Mills, LA | 4.0 | 2.0 | 1568 | $2,200 | $1.40 | 16d | 1 | 0.19mi |
| 25699 Raines Ave Dennis Mills, LA | 3.0 | 2.0 | 1463 | $1,850 | $1.26 | 16d | 1 | 0.19mi |
| 25729 Raines Ave Dennis Mills, LA | 4.0 | 2.0 | 1568 | $2,200 | $1.40 | 25d | 1 | 0.19mi |
| 25699 Raines Ave Dennis Mills, LA | 3.0 | 2.0 | 1463 | $1,850 | $1.26 | 45d | 1 | 0.19mi |
| 25717 Raines Ave Dennis Mills, LA | 4.0 | 2.0 | 1568 | $2,200 | $1.40 | 21d | 1 | 0.19mi |
| 25662 Tarver St , LA | 4.0 | 2.0 | 1570 | $2,000 | $1.27 | 45d | 1 | 0.26mi |
| 24585 Fair Weather Dr Denham Springs, LA | 3.0 | 2.0 | 1451 | $1,850 | $1.27 | 45d | 1 | 0.69mi |
| 11247 Westwood Ave Denham Springs, LA | 3.0 | 2.0 | 1514 | $1,850 | $1.22 | 45d | 1 | 1.02mi |
| 11342 Woodlore Dr Denham Springs, LA | 3.0 | 2.0 | 1511 | $1,500 | $0.99 | 16d | 1 | 1.23mi |
HOA detail
- Monthly dues
- $45 · $540/yr
- Likely covers
- waterpool
Listing history 14 events
-
2026-06-02status $225,000 Pending 85 DOM
-
2026-06-01days on market $225,000 Active 85 DOM
-
2026-05-31days on market $225,000 Active 84 DOM
-
2026-05-31days on market $225,000 Active 83 DOM
-
2026-03-08$225,000 Active 1359-char remark
Show marketing remark (1353 chars)
Beautifully maintained 3BR/2BA home in Juban Parc Subdivision, conveniently located in Denham Springs just off Juban Road with easy access to shopping, dining, and everyday conveniences. This wonderful community features residents-only amenities including a sparkling pool, pool house, and playground, making it perfect for relaxation and recreation right in your neighborhood. This better-than-new home has been meticulously cared for and offers great upgrades including a new HVAC system (2024) and new hot water heater (2022). The home is located in Flood Zone X and has never flooded. Inside, you'll love the open and inviting floor plan with the living room and kitchen flowing seamlessly together, perfect for both everyday living and entertaining. The space opens to a beautiful back patio and fully fenced backyard, ideal for relaxing or hosting guests. The yard is beautifully landscaped and freshly pressure washed, giving the home wonderful curb appeal. The primary suite features a spacious walk-in closet and an ensuite bathroom with double vanities and a tub/shower combination. The washer, dryer, and refrigerator can remain with the new buyer, making this home truly move-in ready. Located just minutes from Juban Crossing, great restaurants, and shopping, this home offers comfort, convenience, and community amenities all in one place.
-
2026-03-08$225,000 Active 1353-char remark
Show marketing remark (1353 chars)
Beautifully maintained 3BR/2BA home in Juban Parc Subdivision, conveniently located in Denham Springs just off Juban Road with easy access to shopping, dining, and everyday conveniences. This wonderful community features residents-only amenities including a sparkling pool, pool house, and playground, making it perfect for relaxation and recreation right in your neighborhood. This better-than-new home has been meticulously cared for and offers great upgrades including a new HVAC system (2024) and new hot water heater (2022). The home is located in Flood Zone X and has never flooded. Inside, you'll love the open and inviting floor plan with the living room and kitchen flowing seamlessly together, perfect for both everyday living and entertaining. The space opens to a beautiful back patio and fully fenced backyard, ideal for relaxing or hosting guests. The yard is beautifully landscaped and freshly pressure washed, giving the home wonderful curb appeal. The primary suite features a spacious walk-in closet and an ensuite bathroom with double vanities and a tub/shower combination. The washer, dryer, and refrigerator can remain with the new buyer, making this home truly move-in ready. Located just minutes from Juban Crossing, great restaurants, and shopping, this home offers comfort, convenience, and community amenities all in one place.
-
2010-03-08soldstatus
-
2010-03-05soldstatus
-
2009-10-12$139,900
-
2009-10-12$139,900
-
2009-05-26soldstatus
-
2009-04-27historical
-
2008-03-24$35,000
-
2008-03-24$35,000
ⓘ Source: listings_history table (triggers on properties + properties_extension) + one-shot
backfill from property_details.listing_events for pre-trigger history.
Tax reassessment forecast LA · Resets to sale price
- Current annual tax
- $1,956 · $163/mo
- Projected year-2 tax
- $1,956 · $163/mo
- Expected delta
- $0/yr ($0/mo · 0.0%)
ⓘ Screening estimate from a state-policy table — verify with the county assessor before closing.
Climate risk First Street
- Flood 1/10 Low FEMA zone X (unshaded) · 0% chance over 30 yrs
- Wildfire 3/10 Moderate
- Heat 8/10 Severe 7 d/yr ≥108°F today · 23 d/yr by 30 yrs out
- Wind 9/10 Extreme 99% chance of damaging wind over 30 yrs
- Air quality 3/10 Moderate 2 unhealthy d/yr today · 3 by 30 yrs out
Nearby sold comps map
Loading sold comps map…
Walkable amenities ~0.75 mi
Loading nearby amenities…
Taxation est. · year 1
- Rental income
- $22,958
- − Mortgage interest
- −$12,603
- − Property taxes
- −$1,956
- − Insurance
- −$1,125
- − Repairs & maintenance
- −$1,837
- − Management
- −$1,837
- − HOA
- −$540
- − Depreciation
- −$6,545
- Taxable loss
- −$3,485
- Est. tax savings @ 24.0%
- +$836
- After-tax cash flow
- $1,193/yr
For passive investors: Depreciation is non-cash, so a rental often shows a tax loss while cash-flowing — sheltering income. Rental losses are passive: they offset passive income freely, and up to $25,000/yr can offset ordinary (W-2) income if you actively participate and your MAGI is under $100k (phasing out to $0 by $150k); unused losses carry forward. On sale, claimed depreciation is recaptured at up to 25%, and gains may owe capital-gains tax (a 1031 exchange can defer both). Figures are a year-1 estimate at your 24.0% rate — not tax advice; consult a CPA.
Schools (NCES district)
- District
- Livingston Parish
- NCES district ID
- 2201020
- Math proficiency
- 40% ▼ -38.00%
- Reading proficiency
- 52% ▼ -32.00%
- Median HH income
- $56,755
- Composite
- 40.07/100
- National rank
- #3811
- State rank
- #13 of 98 in LA
Livability — Walker
- Score
- 75/100
- State rank
- #19
- US rank
- #3999
Category grades
Schools grade is shown separately in the Schools card above.
Census & demographics
- County
- Livingston Parish · 87,496 people
- City population
- 23,921
- Metro
- Baton Rouge, LA
- Population (ZIP)
- 63,575
- Household income
- $78,621
- Rent vs Own
- Severe rent burden
- 1211.0
Population outlook (Livingston County) Hauer SSP2
- Today (2025)
- 158,511 people
- By 2030
- 168,241 · +6.1%
- By 2040
- 186,252 · +17.5%
- By 2050
- 201,516 · +27.1%
- By 2075
- 231,217 · +45.9%
- By 2100
- 241,697 · +52.5%
Race, ethnicity, and origin ACS 2023
- Neighborhood character
- Predominantly White (74%)
- Race & ethnicity
- White 74% Black 13% Hispanic / Latino 9% Two or more races 6%
- Hispanic origin (detail)
- Mexican 3%
- Common ancestry
- Lithuanian 9% Serbian 1% Italian 1%
- Foreign-born
- 6% · Canada
- Languages at home
- 91% English-only · Spanish 6% Other Indo-European 1%
Political lean MEDSL · Livingston
- 2024 margin
- Solid R (+68.5) · D 15.1% · R 83.6% · Other 1.3%
- 2008→2024 swing
- +3.4pp toward D · 2008: -71.9pp · 2024: -68.5pp
- All cycles
- 2024: R+68.5 2020: R+70.0 2016: R+72.5 2012: R+70.4 2008: R+71.9
Not yet ingested
- Civics
- —
Market trends
- HPI YoY
- ▼ -104.37%
- Current HPI
- 170.2207
- Rent YoY
- ▲ 3.83%
- Metro
- Baton Rouge, LA
- State GDP YoY
- ▲ 3.29%
- F500 in state
- 10
Industry mix (Fortune 500 HQ in LA)
| Industry | F500 HQs | Revenue |
|---|---|---|
| Telecommunications | 2 | $23B |
|
||
| Utilities | 1 | $12B |
|
||
| Wholesale / Distribution | 1 | $5B |
|
||
| Advertising | 1 | $2B |
|
||
Price history
+542.9% since first listed10 events — show timeline
- 2026-03-08 Listed $225,000 GBRMLS
- 2026-03-08 Listed $225,000 AcadianaMLS
- 2010-03-08 Sold (Public Records) — Public Records
- 2010-03-05 Sold (MLS) — GBRMLS
- 2009-10-12 Listed $139,900 GBRMLS
- 2009-10-12 Listed $139,900 AcadianaMLS
- 2009-05-26 Sold (MLS) — GBRMLS
- 2009-04-27 Delisted — GBRMLS
- 2008-03-24 Listed $35,000 GBRMLS
- 2008-03-24 Listed $35,000 AcadianaMLS
Property tax history
+3.9%/yrLatest (2024): $1,956 · +20.0% YoY. Source: county tax records.
Cash-flow waterfall
monthlySold comps — $/sqft
last 12 mo · ≤1 miLoading sold comps…