 Triplex
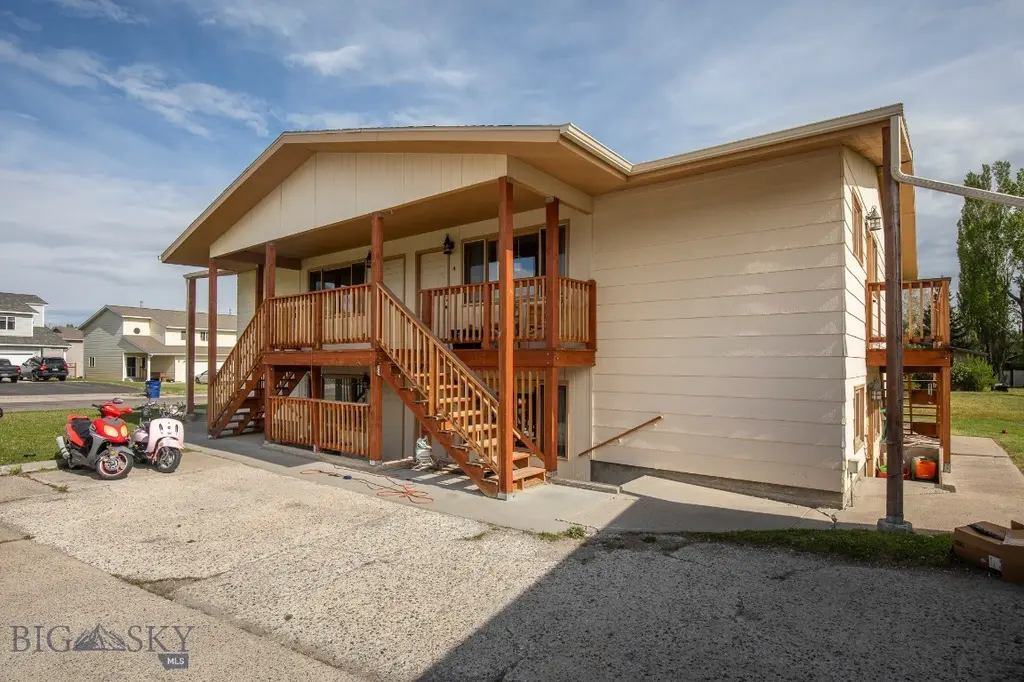
3811 Ravalli St · Bozeman, MT
Flood risk 1/10 · Minimal
- FEMA flood zone
- X (unshaded)
- Chance of flooding over 30 yrs
- 0.0%
- Est. flood insurance / yr
- $473 – $860
Fire risk 4/10 · Minor
- Est. fire insurance / yr
- $918 – $1,706
Heat risk 2/10 · Minimal
- Hot days now (above 88°F)
- 7 days/yr
- Hot days in 30 yrs
- 18 days/yr
Wind risk 1/10 · Minimal
- Chance of severe wind over 30 yrs
- —
Air-quality risk 5/10 · Moderate
- Unhealthy air days now
- 8 days/yr
- Unhealthy air days in 30 yrs
- 8 days/yr
Risk factors via First Street. Map © Google.
Why this score? — see what drove the C- grade
The composite is a weighted blend of 9 inputs, each scored 0–100. Each bar is that input's sub-score; the figure is the points it added to the 100-point composite (weight × sub-score).
- Cash flow +19.5/30.0
- ARV discount +7.5/15.0
- DSCR +6.2/10.0
- Schools +5.2/10.0
- 1% rule +4.6/10.0
- Livability +4.2/5.0
- Condition / age +2.5/5.0
- Rent growth +2.3/5.0
- Appreciation +0.0/10.0
$850,000
🖨 Deal sheet 📄 Offer letter ✓ Due diligence
Multi-family units
County records classify this as Multi-Family (5+ Unit). Listing-text estimate: 3 units. estimate disagrees with records
5+ unit building — per-unit beds/baths from public records are typically unavailable; the breakdown below (if shown) is an estimate from the listing text.
Key facts
- Off street parking
- Washer dryer hookups
- Large living spaces
Tags
Property features AI
Finance
- Financial info: Actual rents reported: several units at $1,050 and one at $1,075
Exterior
- Parking: Detached garages (one garage space per unit); 2 parking spaces per unit / common parking
- Utilities: Public water; Public sewer; Electricity available
- Home design: Residential income property (quadruplex); One-story units
- Construction: Asphalt roof
- Exterior features: Covered porch; Landscaped lot; Paved road access; Has a view
Interior
- Kitchen: Kitchen in each unit with standard appliances (dishwasher, range, refrigerator)
- Bedrooms: Multiple units with 2 bedrooms each
- Bathrooms: Multiple units with 1 full bathroom each
- Heating & cooling: Baseboard heating; No central cooling
- Interior features: Dishwasher, Range, Refrigerator; Washer hookup; Baseboard electric heating
- Laundry & utility: Laundry room/area in each unit; Washer hookup available
Neighborhood map
What this means for you Summary
Snapshot
- This is a 3 × 3-bed/?-bath units multifamily listed at $850k.
Deal economics
- At list price, monthly cash flow is $959 ($12k/yr) — positive. Per door: $320/mo.
- The deal already cash-flows at list — no discount required.
- To meet the 1% rule (rent ≥ 1% of price), the offer needs to be $814k (4.2% below list).
- Recommended offer: $814k (4.2% below list) — sets the bar for 1% rule.
- Cap rate 7.6% vs local median 2.1% in Bozeman — top-decile yield for the area; either an underpriced asset or a hidden risk that comps aren't pricing in. Stress-test before assuming the spread holds.
Location & tenants
- Location reads 85/100 on livability (#1 in MT, #537 nationally) — a professional / high-income tenant draw. Strengths: schools A+, amenities A+, commute A+; Watch: crime D, cost of living D-.
- Bozeman Elementary (town): math 56% / reading 66% proficiency, ranked #7 of 116 in MT (top 6%) — acceptable for families but not a draw, mixed tenant base, ~2y average lease; only 18% free/reduced lunch — higher-income household profile.
- Market conditions: Rents soft (-0.6%/yr); 524 active listings in the ZIP; solid renter incomes; 1,706 units permitted in Gallatin County in 2024 (533 in 5+ unit buildings).
- At $8,140/mo this rent would consume 99% of the median local household income ($99k/yr) (locally 1786% of renters already pay >50% of income on rent) — very limited rent-growth headroom before tenants either downsize or default.
Forward outlook
- Local home prices are declining (-3.0%/yr); year-one equity from $6k of loan paydown is wiped out by about $26k of value loss. Plan a longer hold.
- Gallatin County population projected at +61% by 2050 — long-run rental-demand tailwind backs the buy-and-hold thesis.
Negotiation context
- Only 1 days on market — expect competitive offers; lowballing is unlikely to land.
Questions for the listing agent
- Can we see the unit-by-unit rent roll, current vacancy, and any below-market leases? What's the average tenancy length?
- What capital expenditures (roof, boiler, parking lot, exteriors) have been made in the last 5 years, and what's planned in the next 2?
- Is there a deadline driving the sale (1031 exchange, divorce, estate, relocation)? That informs how much negotiation room exists.
- Schools are A-rated — typically a magnet for longer-tenancy family renters. What's the average tenant stay here, and is there a school-zone premium baked into asking?
- Crime grade is D in this area — have there been break-ins, vandalism, or insurance claims at this property in the last 3 years? What carrier currently insures it and at what premium?
- What's the average days-on-market for RENTAL listings here right now (not sales)? A rising rental-DOM trend means longer vacancies and softer asking-rent achievability than the comps imply.
- What's the recent tenant-quality profile in this submarket — average credit score on applications, eviction rate, late-payment / NSF rate, and stable-employment percentage? A property-management company in the area should have these aggregated.
- How much new apartment / multifamily construction is in the pipeline within 1–3 miles? Heavy new supply (>2% of stock underway) typically softens rents 12–24 months out; light construction supports rent growth.
Investment metrics
- 1% rule
- 0.96% ✗
- Cap rate
- 7.65%
- Cash-on-cash
- 4.84%
- DSCR
- 1.22
- GRM
- 8.7
CMA / ARV
No comps found within radius.
Projected returns pro-forma
-3.0% appreciation · 0.0% rent growth · sell at horizon
- IRR
- -12.0%
- Equity multiple
- 0.58×
- Total profit
- $-100,639
- Equity at exit
- $126,738
- IRR
- -7.8%
- Equity multiple
- 0.57×
- Total profit
- $-101,685
- Equity at exit
- $73,492
Cash invested: $238,000 (down + closing). Projections, not guarantees.
Landlord ↔ Tenant lean methodology
- Overall (STATE)
- 82 Strongly Landlord-Friendly
- State Montana
- 82 Strongly Landlord-Friendly · R+11
- County
- — inherits STATE
- City
- — inherits STATE
ZIP-level market 59718
- Rents YoY
- -0.6%
- Active inventory
- 524
- Price-to-rent
- 26.1×
Monthly cashflow live
- Estimated rent
- $8,140 high interval (Pro) →
- Mortgage (P&I)
- −$4,457
- Tax from tax record
- −$660 /mo · $7,920/yr
- Insurance
- −$354
- HOA
- −$0
- Vacancy / Maint / Mgmt
- −$1,709
- Net cashflow
- $959
Break-even live
3-unit breakdown (identical units grouped — click to expand)
| Units | Beds | Baths | Est. rent |
|---|---|---|---|
| 3× units | 3 | — | $8,139 |
| #1 | 3 | — | $2,713 |
| #2 | 3 | — | $2,713 |
| #3 | 3 | — | $2,713 |
| Total (3 units) | $8,140 | ||
UW: 25.0% down · 7.5% · 30yr · 1.5% tax · 5.0% vac · 8.0% maint · 8.0% mgmt
Financing live
Cash to close
- Down payment
- $212,500
- Closing costs
- $25,500
- Reserves months
- —
- Total cash needed
- —
Loan-product check · same deal, 3 products live
Conventional
25% down · 7.5% · 30yr
- Down + closing
- —
- Monthly P&I
- —
- Monthly cashflow
- —
- DSCR
- —
- Eligible?
- —
Personal DTI + credit; lowest rate.
DSCR
20% down · 8.5% · 30yr
- Down + closing
- —
- Monthly P&I
- —
- Monthly cashflow
- —
- DSCR
- —
- Eligible?
- —
No personal income docs; deal must DSCR.
Hard money
10% down · 12.0% · 12mo
- Down + closing
- —
- Monthly P&I
- —
- Monthly cashflow
- —
- DSCR
- —
- Eligible?
- —
Short-term bridge; refi at stabilization.
Listing history 2 events
-
2026-06-05status $850,000 Pending 1 DOM
-
2026-06-01$850,000 Active 1 DOM
ⓘ Source: listings_history table (triggers on properties + properties_extension) + one-shot
backfill from property_details.listing_events for pre-trigger history.
Tax reassessment forecast MT · Resets to sale price
- Current annual tax
- $7,920 · $660/mo
- Projected year-2 tax
- $7,920 · $660/mo
- Expected delta
- $0/yr ($0/mo · 0.0%)
ⓘ Screening estimate from a state-policy table — verify with the county assessor before closing.
Climate risk First Street
- Flood 1/10 Low FEMA zone X (unshaded) · 0% chance over 30 yrs
- Wildfire 4/10 Moderate
- Heat 2/10 Low 7 d/yr ≥88°F today · 18 d/yr by 30 yrs out
- Wind 1/10 Low
- Air quality 5/10 Major 8 unhealthy d/yr today · 8 by 30 yrs out
Nearby sold comps map
Loading sold comps map…
Walkable amenities ~0.75 mi
Loading nearby amenities…
Taxation est. · year 1
- Rental income
- $97,680
- − Mortgage interest
- −$47,613
- − Property taxes
- −$7,920
- − Insurance
- −$4,250
- − Repairs & maintenance
- −$7,814
- − Management
- −$7,814
- − Depreciation
- −$24,727
- Taxable loss
- −$2,459
- Est. tax savings @ 24.0%
- +$590
- After-tax cash flow
- $12,098/yr
For passive investors: Depreciation is non-cash, so a rental often shows a tax loss while cash-flowing — sheltering income. Rental losses are passive: they offset passive income freely, and up to $25,000/yr can offset ordinary (W-2) income if you actively participate and your MAGI is under $100k (phasing out to $0 by $150k); unused losses carry forward. On sale, claimed depreciation is recaptured at up to 25%, and gains may owe capital-gains tax (a 1031 exchange can defer both). Figures are a year-1 estimate at your 24.0% rate — not tax advice; consult a CPA.
Schools (NCES district)
- District
- Bozeman Elementary
- NCES district ID
- 3004560
- Math proficiency
- 56% ▼ -5.00%
- Reading proficiency
- 66% ▼ -4.00%
- Median HH income
- $51,664
- Composite
- 52.03/100
- National rank
- #1635
- State rank
- #7 of 116 in MT
Livability — Bozeman
- Score
- 85/100
- State rank
- #1
- US rank
- #537
Category grades
Schools grade is shown separately in the Schools card above.
Census & demographics
- Census place
- Bozeman, MT
- County
- Gallatin County · 108,510 people
- City population
- 84,228
- Metro
- Bozeman, MT
- Population (ZIP)
- 44,585
- Household income
- $99,123
- Rent vs Own
- Severe rent burden
- 1786.0
Population outlook (Gallatin County) Hauer SSP2
- Today (2025)
- 129,625 people
- By 2030
- 144,940 · +11.8%
- By 2040
- 176,266 · +36.0%
- By 2050
- 209,250 · +61.4%
- By 2075
- 294,207 · +127.0%
- By 2100
- 360,558 · +178.2%
Race, ethnicity, and origin ACS 2023
- Neighborhood character
- Predominantly White (89%)
- Race & ethnicity
- White 89% Two or more races 5% Hispanic / Latino 5% Asian 1%
- Common ancestry
- Portuguese 7% Slovak 4% Italian 3%
- Foreign-born
- 4% · Canada, China
- Languages at home
- 95% English-only · Spanish 3% Chinese 1%
Political lean MEDSL · Gallatin
- 2024 margin
- Toss-up / Even · D 50.0% · R 46.8% · Other 3.2%
- 2008→2024 swing
- -0.2pp no change · 2008: 3.4pp · 2024: 3.2pp
- All cycles
- 2024: D+3.2 2020: D+7.5 2016: D+1.0 2012: R+5.3 2008: D+3.4
Not yet ingested
- Civics
- —
Market trends
- HPI YoY
- ▼ -316.82%
- Current HPI
- 272.8072
- Rent YoY
- ▼ -0.61%
- Metro
- Bozeman, MT
- State GDP YoY
- ▲ 3.41%
- F500 in state
- 2
Industry mix (Fortune 500 HQ in MT)
| Industry | F500 HQs | Revenue |
|---|---|---|
| Technology / Analytics | 1 | $2B |
|
||
Price history
2 events — show timeline
- 2026-06-01 Listed $850,000 BSCMLS
- 2000-12-29 Sold (Public Records) — Public Records
Property tax history
+12.6%/yrLatest (2025): $7,920 · +17.7% YoY. Source: county tax records.
Cash-flow waterfall
monthlySold comps — $/sqft
last 12 mo · ≤1 miLoading sold comps…