8721 Gulf Shore Ter · Ellenton, FL
Flood risk No data
- FEMA flood zone
- —
- Chance of flooding over 30 yrs
- —
- Est. flood insurance / yr
- —
Fire risk No data
- Est. fire insurance / yr
- —
Heat risk No data
- Hot days now (above threshold)
- —
- Hot days in 30 yrs
- —
Wind risk No data
- Chance of severe wind over 30 yrs
- —
Air-quality risk No data
- Unhealthy air days now
- —
- Unhealthy air days in 30 yrs
- —
Risk factors via First Street. Map © Google.
Why this score? — see what drove the D+ grade
The composite is a weighted blend of 9 inputs, each scored 0–100. Each bar is that input's sub-score; the figure is the points it added to the 100-point composite (weight × sub-score).
- ARV discount +15.0/15.0
- Cash flow +10.6/30.0
- Schools +4.4/10.0
- Condition / age +4.0/5.0
- Livability +3.8/5.0
- 1% rule +3.1/10.0
- DSCR +3.1/10.0
- Rent growth +2.3/5.0
- Appreciation +0.0/10.0
$426,400
🖨 Deal sheet 📄 Offer letter ✓ Due diligence
Listing remarks
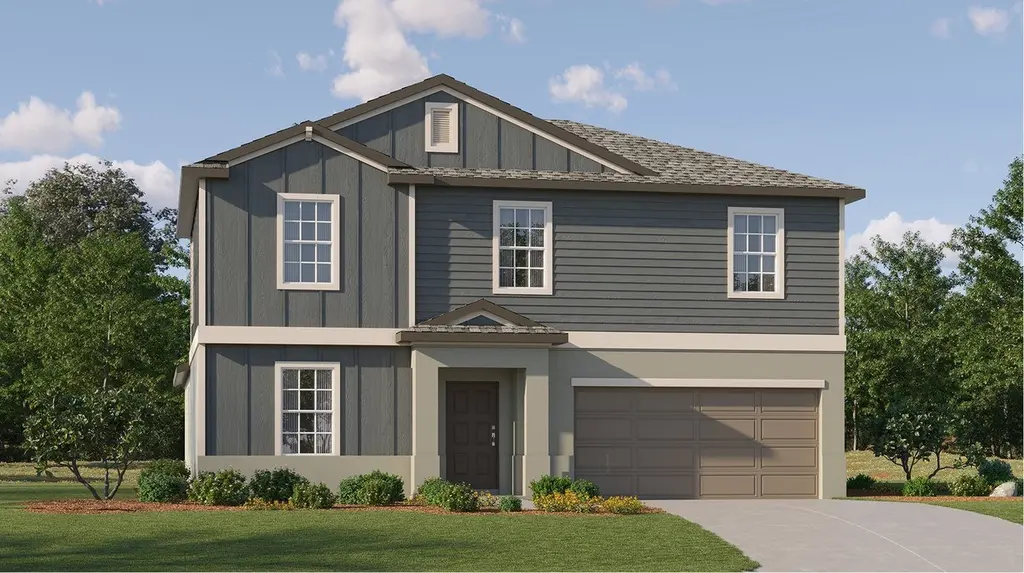
This single-family home boasts five bedrooms across two stories. A versatile flex room sits off the foyer and a modern open-concept design brightens the kitchen, dining room and family room. The sprawling owner's suite enjoys privacy on the ground floor with a full-sized bathroom and walk-in closet, while the remaining four bedrooms and spacious loft are upstairs.
Key facts
- 2 garage spots
- Built 2026
- Listed 11 days
Property features AI
Finance
- Other: Address: 8721 Gulf Shore Ter, Parrish, FL 34219; Listing modified Jun 7, 2026
- Financial info: List price $425,650
Exterior
- Parking: 2 garage spaces (2 total parking spaces)
- Home design: Single-family home (Raleigh plan)
- Exterior features: Living area approx. 2,896
Interior
- Bedrooms: 5 bedrooms
- Bathrooms: 2 full bathrooms and 1 half bathroom (2.5 total)
- Interior features: Spec new construction (Raleigh plan); Active listing
Neighborhood map
What this means for you Summary
Snapshot
- This is a 5-bed/2.5-bath single-family listed at $426k. Condition is rated good.
Deal economics
- At list price, monthly cash flow is $-208 ($-2k/yr) — negative.
- To cash-flow at today's rent, offer at most $396k (7.1% below list).
- To meet the 1% rule (rent ≥ 1% of price), the offer needs to be $347k (18.7% below list).
- Recommended offer: $347k (18.7% below list) — sets the bar for 1% rule.
- Cap rate 5.7% vs local median 4.5% in Ellenton — meaningfully above typical; check what's discounted (condition, days-on-market, listing class) to confirm the premium yield is real.
Location & tenants
- Location reads 76/100 on livability (#232 in FL, #3,666 nationally) — a middle-class / working-renter tenant base. Strengths: cost of living A+, housing A+, health & safety A+; Watch: schools D+, amenities F, commute F.
- Manatee (suburban): math 54% / reading 50% proficiency, ranked #26 of 73 in FL (top 36%) — acceptable for families but not a draw, mixed tenant base, ~2y average lease.
- Market conditions: Rents soft (-0.9%/yr); 2170 active listings in the ZIP; 10 comparable units currently listed for rent nearby; rentals at typical pace (median 16d on market — plan ~3-4 weeks tenant-placement turnaround); high-income renter base; 7,472 units permitted in Manatee County in 2024 (1,782 in 5+ unit buildings).
- This rent runs 37% of the median local income ($114k/yr) — at the standard rent-burdened threshold; future hikes will face affordability resistance.
Forward outlook
- Local home prices are declining (-3.0%/yr); year-one equity from $3k of loan paydown is wiped out by about $13k of value loss. Plan a longer hold.
- Manatee County population projected at +43% by 2050 — long-run rental-demand tailwind backs the buy-and-hold thesis.
Negotiation context
- Only 11 days on market — expect competitive offers; lowballing is unlikely to land.
Questions for the listing agent
- What do current leases actually rent for vs. the listed asking? Can we see a recent rent roll and the last 12 months of T-12 income?
- Is there a deadline driving the sale (1031 exchange, divorce, estate, relocation)? That informs how much negotiation room exists.
- Schools are D-rated, which usually means shorter tenancies and higher turnover. Who's the typical renter profile here, and what's been the actual vacancy rate?
- The area grade is low — what's the realistic commute time and amenity access for the typical tenant pool here? Any planned neighborhood developments (good or bad) we should know about?
- What's the average days-on-market for RENTAL listings here right now (not sales)? A rising rental-DOM trend means longer vacancies and softer asking-rent achievability than the comps imply.
- What's the recent tenant-quality profile in this submarket — average credit score on applications, eviction rate, late-payment / NSF rate, and stable-employment percentage? A property-management company in the area should have these aggregated.
- How much new for-sale + rental construction is in the pipeline within 1–3 miles? Heavy new supply typically softens prices + rents 12–24 months out; constrained supply supports both.
Investment metrics
- 1% rule
- 0.81% ✗
- Cap rate
- 5.71%
- Cash-on-cash
- -2.09%
- DSCR
- 0.91
- GRM
- 10.2
CMA / ARV
- ARV (on-the-fly)
- $561,824
- Comps found
- 12
Show comp detail 12 sales within ~0.75 mi
| Address | Dist | Beds/Ba | Sqft | Sold | Price | $/sf | Match |
|---|---|---|---|---|---|---|---|
| 9428 Bella Mar Trl | 0.39mi | 4/3.0 (-1) | 2,756 (-5%) | 2mo | $425,000 | $154 | 66 |
| 8405 Golden Beach Ct | 0.51mi | 4/3.5 (-1) | 3,059 (+6%) | 7mo | $644,990 | $211 | 52 |
| 8814 Starry Night Ter | 0.69mi | 5/4.0 | 3,018 (+4%) | 4mo | $535,000 | $177 | 51 |
| 9436 Bella Mar Trl | 0.37mi | 4/3.0 (-1) | 3,313 (+14%) | 1mo | $473,000 | $143 | 51 |
| 9427 Bella Mar Trl | 0.39mi | 4/2.0 (-1) | 3,313 (+14%) | 1mo | $477,000 | $144 | 50 |
| 9013 Sandy Shores St | 0.66mi | 4/3.5 (-1) | 2,699 (-7%) | 2mo | $535,000 | $198 | 47 |
| 8522 Salmar Loop | 0.59mi | 4/3.5 (-1) | 3,174 (+10%) | 1mo | $825,076 | $260 | 47 |
| 7438 Sea Manatee St | 0.74mi | 4/4.0 (-1) | 3,099 (+7%) | 0mo | $559,990 | $181 | 43 |
| 7470 Sea Manatee St | 0.74mi | 4/4.0 (-1) | 3,099 (+7%) | 1mo | $599,990 | $194 | 42 |
| 7441 Sea Manatee St | 0.74mi | 4/4.0 (-1) | 2,689 (-7%) | 3mo | $530,000 | $197 | 40 |
| 7490 Sea Manatee St | 0.74mi | 4/4.0 (-1) | 3,099 (+7%) | 4mo | $500,000 | $161 | 40 |
| 7479 Sea Manatee St | 0.73mi | 4/4.0 (-1) | 3,269 (+13%) | 1mo | $685,000 | $210 | 32 |
Match score weights: distance 35% · size 25% · config 20% · recency 20%. Top-matched comps best support the ARV.
Projected returns pro-forma
-3.0% appreciation · 0.0% rent growth · sell at horizon
- IRR
- -23.2%
- Equity multiple
- 0.23×
- Total profit
- $-92,450
- Equity at exit
- $63,578
- IRR
- -28.5%
- Equity multiple
- -0.14×
- Total profit
- $-136,612
- Equity at exit
- $36,867
Cash invested: $119,392 (down + closing). Projections, not guarantees.
Landlord ↔ Tenant lean methodology
- Overall (STATE)
- 87 Strongly Landlord-Friendly
- State Florida
- 87 Strongly Landlord-Friendly · R+3
- County
- — inherits STATE
- City
- — inherits STATE
ZIP-level market 34219
- Home prices YoY
- -23.7%
- Rents YoY
- -0.9%
- Active inventory
- 2170
- Price-to-rent
- 10.2×
Monthly cashflow live
- Estimated rent
- $3,467 high interval (Pro) →
- Mortgage (P&I)
- −$2,236
- Tax est. 1.5%
- −$533 /mo · $6,396/yr
- Insurance
- −$178
- HOA
- −$0
- Vacancy / Maint / Mgmt
- −$728
- Net cashflow
- $-208
Break-even live
UW: 25.0% down · 7.5% · 30yr · 1.5% tax · 5.0% vac · 8.0% maint · 8.0% mgmt
Financing live
Cash to close
- Down payment
- $106,600
- Closing costs
- $12,792
- Reserves months
- —
- Total cash needed
- —
Loan-product check · same deal, 3 products live
Conventional
25% down · 7.5% · 30yr
- Down + closing
- —
- Monthly P&I
- —
- Monthly cashflow
- —
- DSCR
- —
- Eligible?
- —
Personal DTI + credit; lowest rate.
DSCR
20% down · 8.5% · 30yr
- Down + closing
- —
- Monthly P&I
- —
- Monthly cashflow
- —
- DSCR
- —
- Eligible?
- —
No personal income docs; deal must DSCR.
Hard money
10% down · 12.0% · 12mo
- Down + closing
- —
- Monthly P&I
- —
- Monthly cashflow
- —
- DSCR
- —
- Eligible?
- —
Short-term bridge; refi at stabilization.
Rent comps 10 comps
| Address | Beds | Baths | Sqft | Rent | $/sqft | DOM | Units | Dist |
|---|---|---|---|---|---|---|---|---|
| 8541 Bella Mar Trl Parrish, FL | 5.0 | 3.0 | 2389 | $2,800 | $1.17 | 10d | 1 | 0.20mi |
| 9276 Bonita Mar Dr Parrish, FL | 4.0 | 2.5 | 2466 | $4,250 | $1.72 | 24d | 1 | 0.25mi |
| 8818 Gulf Shore Ter Parrish, FL | 6.0 | 3.0 | 3326 | $3,250 | $0.98 | 3d | 1 | 0.26mi |
| 8438 Blue Wave Ln Parrish, FL | 6.0 | 3.0 | 2580 | $2,900 | $1.12 | 24d | 1 | 0.31mi |
| 9432 Bella Mar Trl Parrish, FL | 4.0 | 2.5 | 2045 | $2,699 | $1.32 | 16d | 1 | 0.39mi |
| 10225 Daybreak Gln Parrish, FL | 4.0 | 3.0 | 1978 | $2,600 | $1.31 | 3d | 1 | 1.01mi |
| 9544 Sandy Bluffs Cir Parrish, FL | 5.0 | 3.0 | 2557 | $2,950 | $1.15 | 3d | 1 | 1.19mi |
| 8326 Abalone Loop Parrish, FL | 4.0 | 3.0 | 2711 | $3,650 | $1.35 | 3d | 1 | 1.22mi |
| 8614 Mercator Ct Parrish, FL | 4.0 | 2.5 | 2910 | $3,300 | $1.13 | 24d | 1 | 1.25mi |
| 11612 Armada Way Parrish, FL | 4.0 | 2.0 | 2112 | $3,400 | $1.61 | 20d | 1 | 1.49mi |
Listing history 11 events
-
2026-06-18days on market $426,400 Active 11 DOM
-
2026-06-18price $426,400 Active 10 DOM
-
2026-06-17days on market $426,150 Active 10 DOM
-
2026-06-16pricedays on market $426,150 Active 9 DOM
-
2026-06-15days on market $425,900 Active 8 DOM
-
2026-06-13pricedays on market $425,900 Active 6 DOM
-
2026-06-13days on market $425,650 Active 5 DOM
-
2026-06-10days on market $425,650 Active 3 DOM
-
2026-06-09days on market $425,650 Active 2 DOM
-
2026-06-08remarks 366-char remark
-
2026-06-08$425,650 Active 1 DOM
ⓘ Source: listings_history table (triggers on properties + properties_extension) + one-shot
backfill from property_details.listing_events for pre-trigger history.
Nearby sold comps map
Loading sold comps map…
Walkable amenities ~0.75 mi
Loading nearby amenities…
Taxation est. · year 1
- Rental income
- $41,601
- − Mortgage interest
- −$23,885
- − Property taxes
- −$6,396
- − Insurance
- −$2,132
- − Repairs & maintenance
- −$3,328
- − Management
- −$3,328
- − Depreciation
- −$12,404
- Taxable loss
- −$9,872
- Est. tax savings @ 24.0%
- +$2,369
- After-tax cash flow
- $-127/yr
For passive investors: Depreciation is non-cash, so a rental often shows a tax loss while cash-flowing — sheltering income. Rental losses are passive: they offset passive income freely, and up to $25,000/yr can offset ordinary (W-2) income if you actively participate and your MAGI is under $100k (phasing out to $0 by $150k); unused losses carry forward. On sale, claimed depreciation is recaptured at up to 25%, and gains may owe capital-gains tax (a 1031 exchange can defer both). Figures are a year-1 estimate at your 24.0% rate — not tax advice; consult a CPA.
Condition & rehab AI · 12 photos
This single-family home is in good condition with a modern design and well-maintained exterior. It has a good resale and rental value with minor updates needed for curb appeal and living space improvement.
Value-add opportunities
- Resale Paint the exterior siding — Enhances curb appeal and adds value
- Rental Replace the carpet with hardwood flooring — Improves the living space and attracts renters
Renovation cost estimate screening
Value-add ROI direction
- Resale Paint the exterior siding — Enhances curb appeal and adds value ↑
- Rental Replace the carpet with hardwood flooring — Improves the living space and attracts renters ↑
ⓘ Cost ranges are severity-bucket heuristics (US national rule-of-thumb). Get contractor quotes + a written scope before underwriting a rehab budget.
Schools (NCES district)
- District
- Manatee
- NCES district ID
- 1201230
- Math proficiency
- 54% ▼ -6.00%
- Reading proficiency
- 50% ▼ -2.00%
- Median HH income
- $49,607
- Composite
- 44.43/100
- National rank
- #2806
- State rank
- #26 of 73 in FL
Livability — Ellenton
- Score
- 76/100
- State rank
- #232
- US rank
- #3666
Category grades
Schools grade is shown separately in the Schools card above.
Census & demographics
- County
- Manatee County · 416,364 people
- City population
- 14,819
- Metro
- North Port-Sarasota-Bradenton, FL
- Population (ZIP)
- 33,296
- Household income
- $113,773
- Rent vs Own
- Severe rent burden
- 219.0
Population outlook (Manatee County) Hauer SSP2
- Today (2025)
- 447,342 people
- By 2030
- 488,911 · +9.3%
- By 2040
- 567,934 · +27.0%
- By 2050
- 637,995 · +42.6%
- By 2075
- 781,970 · +74.8%
- By 2100
- 848,272 · +89.6%
Race, ethnicity, and origin ACS 2023
- Neighborhood character
- Predominantly White (75%)
- Race & ethnicity
- White 75% Hispanic / Latino 11% Two or more races 8% Black 8% Asian 2%
- Hispanic origin (detail)
- Mexican 2% Puerto Rican 3%
- Common ancestry
- Romanian 4% Hispanic 2% Russian 2%
- Foreign-born
- 10% · Canada, Dominican Republic, Jamaica
- Languages at home
- 88% English-only · Spanish 7% French/Haitian/Cajun 2% Other Asian/Pacific 1%
Political lean MEDSL · Manatee
- 2024 margin
- Strong R (+23.5) · D 37.9% · R 61.4%
- 2008→2024 swing
- -16.5pp toward R · 2008: -7.0pp · 2024: -23.5pp
- All cycles
- 2024: R+23.5 2020: R+16.1 2016: R+17.1 2012: R+12.5 2008: R+7.0
Not yet ingested
- Civics
- —
Market trends
- HPI YoY
- ▼ -84.45%
- Current HPI
- 271.7131
- Rent YoY
- ▼ -0.95%
- Metro
- North Port-Sarasota-Bradenton, FL
- State GDP YoY
- ▲ 3.28%
- F500 in state
- 36
Industry mix (Fortune 500 HQ in FL)
| Industry | F500 HQs | Revenue |
|---|---|---|
| Industrial Technology | 2 | $29B |
|
||
| Insurance | 2 | $17B |
|
||
| Retail | 1 | $60B |
|
||
| Technology Distribution | 1 | $58B |
|
||
| Homebuilding | 1 | $35B |
|
||
| Technology Manufacturing | 1 | $35B |
|
||
Cash-flow waterfall
monthlySold comps — $/sqft
last 12 mo · ≤1 miLoading sold comps…