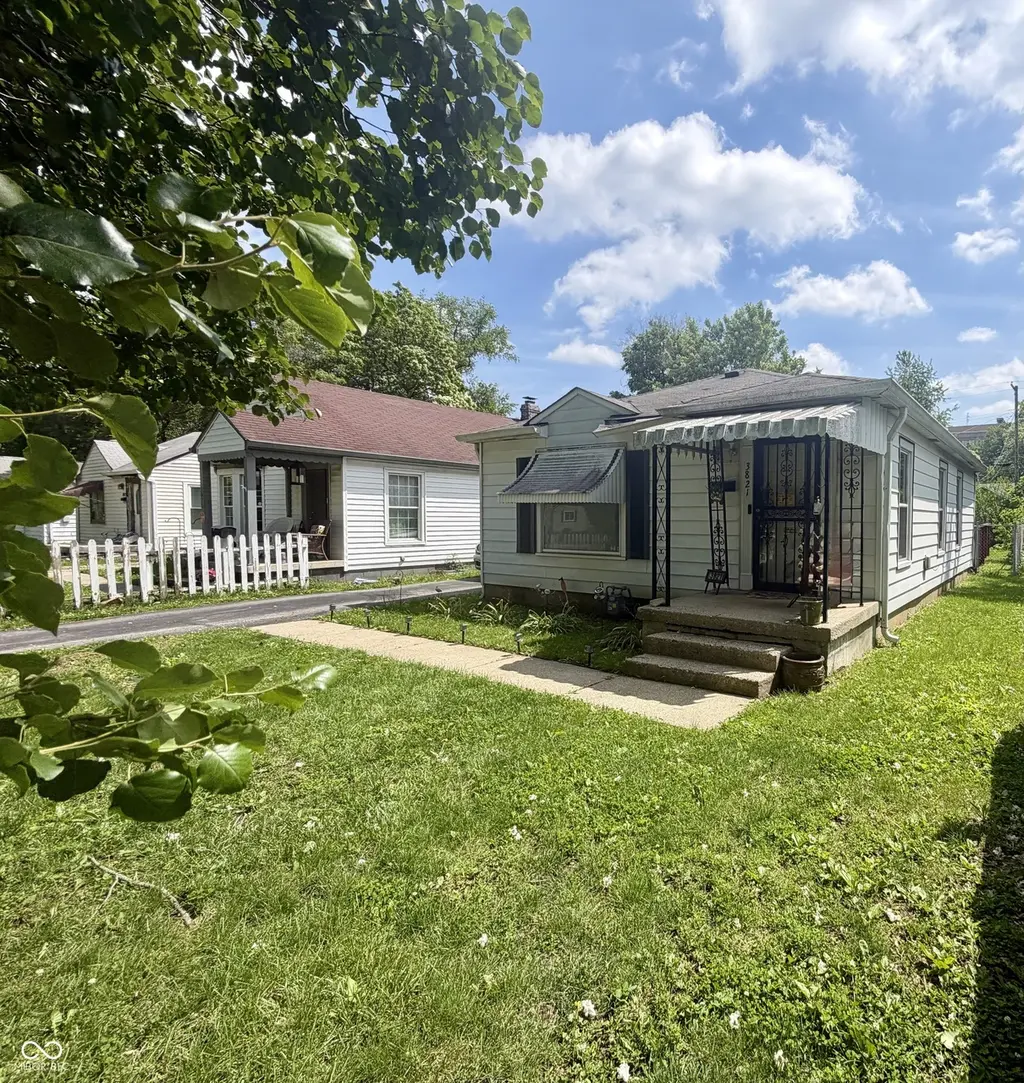
3821 N Tacoma Ave · Indianapolis city (balance), IN
Flood risk 1/10 · Minimal
- FEMA flood zone
- X (unshaded)
- Chance of flooding over 30 yrs
- 0.0%
- Est. flood insurance / yr
- $473 – $860
Fire risk 1/10 · Minimal
- Est. fire insurance / yr
- $717 – $1,331
Heat risk 4/10 · Minor
- Hot days now (above 102°F)
- 7 days/yr
- Hot days in 30 yrs
- 18 days/yr
Wind risk 2/10 · Minimal
- Chance of severe wind over 30 yrs
- 0.0%
Air-quality risk 4/10 · Minor
- Unhealthy air days now
- 5 days/yr
- Unhealthy air days in 30 yrs
- 7 days/yr
Risk factors via First Street. Map © Google.
Why this score? — see what drove the C- grade
The composite is a weighted blend of 9 inputs, each scored 0–100. Each bar is that input's sub-score; the figure is the points it added to the 100-point composite (weight × sub-score).
- Cash flow +23.8/30.0
- DSCR +7.7/10.0
- 1% rule +5.3/10.0
- ARV discount +4.8/15.0
- Rent growth +4.1/5.0
- Livability +2.5/5.0
- Condition / age +2.5/5.0
- Schools +1.4/10.0
- Appreciation +0.0/10.0
$129,000
🖨 Deal sheet 📄 Offer letter ✓ Due diligence
Listing remarks
This 2-bedroom, 1-bath ranch offers comfort, convenience, and potential. Inside, you'll find a spacious living room that flows into the dining area, a functional kitchen with access to a rear deck and an unfinished basement ready for your personal touch. The covered front porch is perfect for greeting guests or enjoying relaxing morning views of the sky, lawn, and mature trees. The asphalt driveway leads to a detached 1-car garage which provides more parking and storage space. Outside, the generous lot (0.15 acres) provides room to relax, garden, or entertain. The residence is being offered AS IS. This residence is located within walking distance of the YMCA, The Redline, and just minutes f
Key facts
- Functional kitchen
- Covered front porch
- Generous lot
Tags
Property features AI
Exterior
- Parking: Detached garage (1 car)
- Utilities: Public water; Municipal sewer connected; Solid waste: none listed
- Home design: Single-family residence; One story
- Construction: Aluminum siding; Concrete perimeter and block foundation
- Exterior features: Covered patio/porch; Has view; Lot under 1/4 acre (approximately 0.15 acre)
Interior
- Kitchen: Gas cooktop
- Bedrooms: Two bedrooms on the main level
- Bathrooms: One full bathroom (main level)
- Heating & cooling: Natural gas heating; Central air conditioning
- Interior features: Has basement; Covered porch
- Laundry & utility: Washer and dryer; Water heater
Neighborhood map
What this means for you Summary
Snapshot
- This is a 2-bed/1.0-bath single-family listed at $129k.
Deal economics
- At list price, monthly cash flow is $249 ($3k/yr) — positive.
- The deal already cash-flows at list — no discount required.
- Meets the 1% rule at list price ($1k rent vs $129k).
- Recommended offer: $127k (1.5% below list) — sets the bar for market timing.
- Cap rate 8.6% vs local median 4.4% in Indianapolis city (balance) — top-decile yield for the area; either an underpriced asset or a hidden risk that comps aren't pricing in. Stress-test before assuming the spread holds.
Location & tenants
- Location reads: area grade C — affects rentability + tenant quality, not the cash-flow math above.
- Indianapolis Public Schools (urban): math 14% / reading 20% proficiency, ranked #286 of 301 in IN (top 95%) — low school quality limits family demand, transient renter base, plan for 1-2y turnover; 77% free/reduced lunch — lower-income household profile, screen leases tightly.
- Market conditions: Rents rising fast (+6.2%/yr); 314 active listings in the ZIP; 40 comparable units currently listed for rent nearby; rentals at typical pace (median 24d on market — plan ~3-4 weeks tenant-placement turnaround); 1,906 units permitted in Marion County in 2024 (621 in 5+ unit buildings).
Forward outlook
- Local home prices are declining (-3.0%/yr); year-one equity from $892 of loan paydown is wiped out by about $4k of value loss. Plan a longer hold.
- Marion County population projected at +18% by 2050 — long-run rental-demand tailwind backs the buy-and-hold thesis.
- At projected returns (-3.0% appreciation + 6.2% rent growth), your $36k cash investment doubles in ~9 years — after that, you're playing with house money.
Negotiation context
- It's been on market 30 days — a 2% lower offer ($127k) is reasonable based on typical stale-listing flexibility.
Risks & watch-outs
- Watch-outs: built in 1948 — expect roof / HVAC / electrical / plumbing capex.
Questions for the listing agent
- Built in 1948 — when were the roof, HVAC, electrical panel, plumbing, and water heater last replaced?
- Is there a deadline driving the sale (1031 exchange, divorce, estate, relocation)? That informs how much negotiation room exists.
- What's the average days-on-market for RENTAL listings here right now (not sales)? A rising rental-DOM trend means longer vacancies and softer asking-rent achievability than the comps imply.
- What's the recent tenant-quality profile in this submarket — average credit score on applications, eviction rate, late-payment / NSF rate, and stable-employment percentage? A property-management company in the area should have these aggregated.
- How much new for-sale + rental construction is in the pipeline within 1–3 miles? Heavy new supply typically softens prices + rents 12–24 months out; constrained supply supports both.
Investment metrics
- 1% rule
- 1.03% ✓
- Cap rate
- 8.61%
- Cash-on-cash
- 8.26%
- DSCR
- 1.37
- GRM
- 8.1
CMA / ARV
- ARV (on-the-fly)
- $121,584
- Comps found
- 12
Show comp detail 12 sales within ~0.75 mi
| Address | Dist | Beds/Ba | Sqft | Sold | Price | $/sf | Match |
|---|---|---|---|---|---|---|---|
| 3714 Hillside Ave | 0.25mi | 2/2.0 | 844 (+3%) | 4mo | $143,900 | $170 | 76 |
| 3706 Baltimore Ave | 0.33mi | 2/1.0 | 812 (-0%) | 13mo | $40,000 | $49 | 73 |
| 3930 Caroline Ave | 0.33mi | 2/1.0 | 812 (-0%) | 18mo | $102,500 | $126 | 69 |
| 3511 N Keystone Ave | 0.43mi | 2/1.0 | 837 (+3%) | 10mo | $113,500 | $136 | 67 |
| 3640 N Lasalle St | 0.58mi | 2/1.0 | 720 (-12%) | 1mo | $139,500 | $194 | 52 |
| 3932 Millersville Dr | 0.27mi | 3/1.0 (+1) | 925 (+13%) | 10mo | $100,000 | $108 | 52 |
| 4221 Evanston Ave | 0.59mi | 2/1.0 | 899 (+10%) | 15mo | $186,000 | $207 | 43 |
| 4163 N Tacoma Ave | 0.38mi | 3/1.0 (+1) | 925 (+13%) | 16mo | $149,000 | $161 | 41 |
| 2217 E 34th St | 0.62mi | 3/1.0 (+1) | 912 (+12%) | 15mo | $163,450 | $179 | 34 |
| 2120 E 34th St | 0.62mi | 3/2.0 (+1) | 900 (+10%) | 19mo | $115,000 | $128 | 29 |
| 3419 Hillside Ave | 0.57mi | 3/2.0 (+1) | 912 (+12%) | 19mo | $134,900 | $148 | 29 |
| 4353 Evanston Ave | 0.73mi | 3/1.5 (+1) | 936 (+15%) | 12mo | $139,900 | $149 | 24 |
Match score weights: distance 35% · size 25% · config 20% · recency 20%. Top-matched comps best support the ARV.
Projected returns pro-forma
-3.0% appreciation · 6.21% rent growth · sell at horizon
- IRR
- -0.5%
- Equity multiple
- 0.98×
- Total profit
- $-669
- Equity at exit
- $19,234
- IRR
- 12.1%
- Equity multiple
- 2.08×
- Total profit
- $39,118
- Equity at exit
- $11,154
Cash invested: $36,120 (down + closing). Projections, not guarantees.
Landlord ↔ Tenant lean methodology
- Overall (STATE)
- 90 Strongly Landlord-Friendly
- State Indiana
- 90 Strongly Landlord-Friendly · R+11
- County
- — inherits STATE
- City
- — inherits STATE
ZIP-level market 46205
- Rents YoY
- 6.2%
- Active inventory
- 314
- Price-to-rent
- 8.1×
Monthly cashflow live
- Estimated rent
- $1,331 high interval (Pro) →
- Mortgage (P&I)
- −$676
- Tax from tax record
- −$73 /mo · $875/yr
- Insurance
- −$54
- HOA
- −$0
- Vacancy / Maint / Mgmt
- −$280
- Net cashflow
- $249
Break-even live
UW: 25.0% down · 7.5% · 30yr · 1.5% tax · 5.0% vac · 8.0% maint · 8.0% mgmt
Financing live
Cash to close
- Down payment
- $32,250
- Closing costs
- $3,870
- Reserves months
- —
- Total cash needed
- —
Loan-product check · same deal, 3 products live
Conventional
25% down · 7.5% · 30yr
- Down + closing
- —
- Monthly P&I
- —
- Monthly cashflow
- —
- DSCR
- —
- Eligible?
- —
Personal DTI + credit; lowest rate.
DSCR
20% down · 8.5% · 30yr
- Down + closing
- —
- Monthly P&I
- —
- Monthly cashflow
- —
- DSCR
- —
- Eligible?
- —
No personal income docs; deal must DSCR.
Hard money
10% down · 12.0% · 12mo
- Down + closing
- —
- Monthly P&I
- —
- Monthly cashflow
- —
- DSCR
- —
- Eligible?
- —
Short-term bridge; refi at stabilization.
Rent comps 40 comps
| Address | Beds | Baths | Sqft | Rent | $/sqft | DOM | Units | Dist |
|---|---|---|---|---|---|---|---|---|
| 3741 N Tacoma Ave Indianapolis, IN | 3.0 | 1.0 | 913 | $2,200 | $2.41 | 17d | 1 | 0.10mi |
| 3719 Hillside Ave Indianapolis, IN | 1.0 | 1.0 | 644 | $725 | $1.13 | 23d | 1 | 0.21mi |
| 3763 Baltimore Ave Unit 3765 Indianapolis, IN | 1.0 | 1.0 | 750 | $750 | $1.00 | 43d | 1 | 0.25mi |
| 3709 Kinnear Ave Indianapolis, IN | 2.0 | 1.0 | 650 | $1,000 | $1.54 | 43d | 1 | 0.40mi |
| 3535 N Oxford St Indianapolis, IN | 3.0 | 1.0 | 1015 | $1,500 | $1.48 | 21d | 1 | 0.44mi |
| 3723 Orchard Ave Unit 3723 Indianapolis, IN | 1.0 | 1.5 | 700 | $1,300 | $1.86 | 23d | 1 | 0.45mi |
| 3472 N Dearborn St Indianapolis, IN | 2.0 | 1.0 | 890 | $1,099 | $1.23 | 19d | 1 | 0.60mi |
| 1902 E 35th St Indianapolis, IN | 3.0 | 1.0 | 1100 | $1,600 | $1.45 | 43d | 1 | 0.65mi |
| 3363 Nicholas Ave Indianapolis, IN | 2.0 | 1.0 | 720 | $1,000 | $1.39 | 4d | 1 | 0.66mi |
| 4115 Meadows Dr Indianapolis, IN | 1.0–3.0 | 1.0–2.0 | 1013 | $1,374 | $1.36 | 43d | 9 | 0.71mi |
| 3522 N Olney St Indianapolis, IN | 3.0 | 1.0 | 768 | $1,300 | $1.69 | 43d | 1 | 0.77mi |
| 4303 Norwaldo Ave Indianapolis, IN | 3.0 | 1.0 | 1050 | $1,200 | $1.14 | 43d | 1 | 0.77mi |
| 4326 Crittenden Ave Indianapolis, IN | 2.0 | 1.0 | 812 | $1,045 | $1.29 | 20d | 1 | 0.78mi |
| 3615 Sherman Forest Dr Indianapolis, IN | 4.0 | 1.0–2.5 | 1057 | $1,288 | $1.22 | 4d | 1 | 0.78mi |
| 4400 E Fall Creek Parkway North Dr Indianapolis, IN | 1.0–2.0 | 1.0–1.5 | 857 | $1,349 | $1.57 | 1d | 31 | 0.81mi |
| 3421 N Olney St Indianapolis, IN | 2.0 | 1.0 | 720 | $1,195 | $1.66 | 16d | 1 | 0.86mi |
| 4309 Ralston Ave Indianapolis, IN | 3.0 | 1.0 | 918 | $1,600 | $1.74 | 14d | 1 | 0.87mi |
| 2511 E 46th St Indianapolis, IN | 1.0–2.0 | 1.0–2.0 | 830 | $1,305 | $1.57 | 43d | 2 | 0.91mi |
| 3609 Balsam Ave Indianapolis, IN | 1.0 | 1.0 | 541 | $775 | $1.43 | 3d | 1 | 0.94mi |
| 3609 Balsam Ave Indianapolis, IN | 1.0 | 1.0 | 541 | $755 | $1.40 | 14d | 1 | 0.94mi |
| 3725 N Sherman Dr #7 Indianapolis, IN | 2.0 | 1.0 | 729 | $845 | $1.16 | 4d | 1 | 0.95mi |
| 3610 Balsam Ave Indianapolis, IN | 1.0 | 1.0 | 464 | $775 | $1.67 | 3d | 9 | 0.97mi |
| 4521 Norwaldo Ave Unit A Indianapolis, IN | 2.0 | 1.5 | 1024 | $1,525 | $1.49 | 23d | 1 | 1.01mi |
| 4521 Norwaldo Ave Unit B Indianapolis, IN | 2.0 | 1.5 | 1054 | $1,600 | $1.52 | 43d | 1 | 1.01mi |
| 2106 E 46th St Indianapolis, IN | 1.0 | 1.0 | 552 | $925 | $1.68 | 10d | 1 | 1.03mi |
| 3383 Station St Indianapolis, IN | 3.0 | 1.0 | 744 | $1,250 | $1.68 | 23d | 1 | 1.04mi |
| 3909 Winthrop Ave Unit B Indianapolis, IN | 2.0 | 1.5 | 931 | $1,550 | $1.66 | 12d | 1 | 1.10mi |
| 2931 N Tacoma Ave Unit 31 Indianapolis, IN | 2.0 | 1.0 | 800 | $950 | $1.19 | 7d | 1 | 1.12mi |
| 3207 N Arsenal Ave Indianapolis, IN | 3.0 | 1.0 | 994 | $1,195 | $1.20 | 23d | 1 | 1.13mi |
| 4560 Marcy Ln Indianapolis, IN | 1.0–2.0 | 1.0 | 770 | $1,565 | $2.03 | 14d | 8 | 1.19mi |
| 2930 N Dearborn St Indianapolis, IN | 1.0 | 1.0 | 536 | $599 | $1.12 | 23d | 1 | 1.20mi |
| 916 Fairfield Ave Unit 918 Indianapolis, IN | 3.0 | 1.0 | 1000 | $1,300 | $1.30 | 7d | 1 | 1.21mi |
| 3132 Dr Andrew J Brown Ave Indianapolis, IN | 2.0 | 1.0–2.0 | 791 | $2,120 | $2.68 | 1d | 46 | 1.24mi |
| 2949 Adams St Indianapolis, IN | 2.0 | 1.0 | 978 | $1,150 | $1.18 | 43d | 1 | 1.24mi |
| 2920 N Lasalle St Indianapolis, IN | 3.0 | 1.0 | 875 | $1,095 | $1.25 | 17d | 1 | 1.24mi |
| 2820 Caroline Ave Indianapolis, IN | 3.0 | 1.5 | 1112 | $1,250 | $1.12 | 23d | 1 | 1.30mi |
| 3716 N College Ave Unit 3 Indianapolis, IN | 2.0 | 2.0 | 1100 | $1,450 | $1.32 | 43d | 1 | 1.36mi |
| 3139 Guilford Ave Indianapolis, IN | 3.0 | 1.0 | 1068 | $1,345 | $1.26 | 43d | 1 | 1.37mi |
| 636 E 37th St Unit 5 Indianapolis, IN | 2.0 | 1.0 | 700 | $695 | $0.99 | 23d | 1 | 1.37mi |
| 633 E 38th St #4 Indianapolis, IN | 3.0 | 1.0 | 650 | $1,050 | $1.62 | 43d | 1 | 1.39mi |
Listing history 14 events
-
2026-06-18days on market $129,000 Active 30 DOM
-
2026-06-17days on market $129,000 Active 29 DOM
-
2026-06-16days on market $129,000 Active 28 DOM
-
2026-06-15days on market $129,000 Active 27 DOM
-
2026-06-13days on market $129,000 Active 25 DOM
-
2026-06-13days on market $129,000 Active 24 DOM
-
2026-06-09days on market $129,000 Active 21 DOM
-
2026-06-08days on market $129,000 Active 20 DOM
-
2026-06-07days on market $129,000 Active 19 DOM
-
2026-06-03days on market $129,000 Active 15 DOM
-
2026-06-02days on market $129,000 Active 14 DOM
-
2026-06-01days on market $129,000 Active 13 DOM
-
2026-05-31days on market $129,000 Active 12 DOM
-
2026-05-19$129,000 Active
ⓘ Source: listings_history table (triggers on properties + properties_extension) + one-shot
backfill from property_details.listing_events for pre-trigger history.
Tax reassessment forecast IN · Partial reset (capped growth)
- Current annual tax
- $875 · $73/mo
- Projected year-2 tax
- $986 · $82/mo
- Expected delta
- +$111/yr (+$9/mo · 12.7%)
ⓘ Screening estimate from a state-policy table — verify with the county assessor before closing.
Climate risk First Street
- Flood 1/10 Low FEMA zone X (unshaded) · 0% chance over 30 yrs
- Wildfire 1/10 Low
- Heat 4/10 Moderate 7 d/yr ≥102°F today · 18 d/yr by 30 yrs out
- Wind 2/10 Low 0% chance of damaging wind over 30 yrs
- Air quality 4/10 Moderate 5 unhealthy d/yr today · 7 by 30 yrs out
Nearby sold comps map
Loading sold comps map…
Walkable amenities ~0.75 mi
Loading nearby amenities…
Taxation est. · year 1
- Rental income
- $15,975
- − Mortgage interest
- −$7,226
- − Property taxes
- −$875
- − Insurance
- −$645
- − Repairs & maintenance
- −$1,278
- − Management
- −$1,278
- − Depreciation
- −$3,753
- Taxable income
- $921
- Est. tax owed @ 24.0%
- −$221
- After-tax cash flow
- $2,762/yr
For passive investors: Depreciation is non-cash, so a rental often shows a tax loss while cash-flowing — sheltering income. Rental losses are passive: they offset passive income freely, and up to $25,000/yr can offset ordinary (W-2) income if you actively participate and your MAGI is under $100k (phasing out to $0 by $150k); unused losses carry forward. On sale, claimed depreciation is recaptured at up to 25%, and gains may owe capital-gains tax (a 1031 exchange can defer both). Figures are a year-1 estimate at your 24.0% rate — not tax advice; consult a CPA.
Schools (NCES district)
- District
- Indianapolis Public Schools
- NCES district ID
- 1804770
- Math proficiency
- 14% ▼ -7.00%
- Reading proficiency
- 20% ▼ -3.00%
- Median HH income
- $32,034
- Composite
- 13.69/100
- National rank
- #9499
- State rank
- #286 of 301 in IN
Livability — Indianapolis city (balance)
No livability data for this city. (Only ~50 U.S. cities are tracked.)
Census & demographics
- Census place
- Indianapolis city (balance), IN
- County
- Marion County · 998,460 people
- City population
- 881,119
- Metro
- Indianapolis-Carmel-Anderson, IN
- Population (ZIP)
- 28,259
- Household income
- $72,417
- Rent vs Own
- Severe rent burden
- 1149.0
Population outlook (Marion County) Hauer SSP2
- Today (2025)
- 1,025,572 people
- By 2030
- 1,065,727 · +3.9%
- By 2040
- 1,141,577 · +11.3%
- By 2050
- 1,208,920 · +17.9%
- By 2075
- 1,367,288 · +33.3%
- By 2100
- 1,438,201 · +40.2%
Race, ethnicity, and origin ACS 2023
- Neighborhood character
- Diverse neighborhood (Simpson 0.64)
- Race & ethnicity
- White 50% Black 32% Two or more races 10% Hispanic / Latino 7% Asian 3%
- Hispanic origin (detail)
- Mexican 4%
- Common ancestry
- Italian 3% Slovak 2% Romanian 2%
- Foreign-born
- 5% · Canada
- Languages at home
- 89% English-only · Spanish 6% Other Indo-European 2% German/W. Germanic 1%
Political lean MEDSL · Marion
- 2024 margin
- Strong D (+27.7) · D 63.0% · R 35.3% · Other 1.7%
- 2008→2024 swing
- -0.7pp no change · 2008: 28.4pp · 2024: 27.7pp
- All cycles
- 2024: D+27.7 2020: D+29.1 2016: D+22.8 2012: D+22.2 2008: D+28.4
Not yet ingested
- Civics
- —
Market trends
- HPI YoY
- ▼ -322.77%
- Current HPI
- 380.5407
- Rent YoY
- ▲ 6.21%
- Metro
- Indianapolis-Carmel-Anderson, IN
- State GDP YoY
- ▲ 2.90%
- F500 in state
- 18
Industry mix (Fortune 500 HQ in IN)
| Industry | F500 HQs | Revenue |
|---|---|---|
| Industrial Machinery | 2 | $37B |
|
||
| Healthcare | 1 | $177B |
|
||
| Pharmaceuticals | 1 | $45B |
|
||
| Metals / Steel | 1 | $18B |
|
||
| Agriculture | 1 | $17B |
|
||
| Packaging | 1 | $12B |
|
||
Price history
1 event — show timeline
- 2026-05-19 Listed $129,000 MIBOR as Distributed by MLS Grid
Property tax history
-0.7%/yrLatest (2025): $875 · +34.2% YoY. Source: county tax records.
Cash-flow waterfall
monthlySold comps — $/sqft
last 12 mo · ≤1 miLoading sold comps…