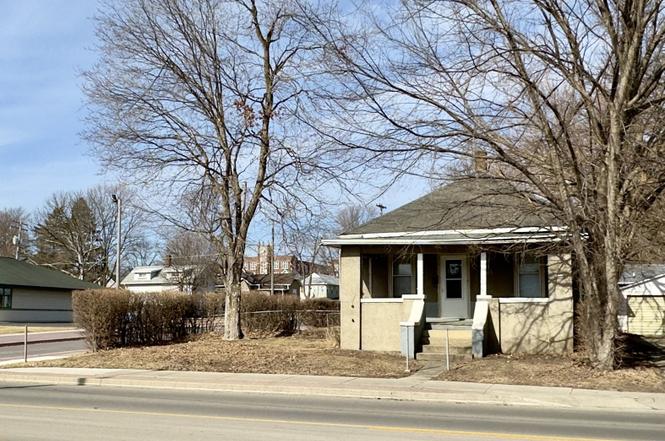
103 3rd St · LaSalle, IL
Flood risk 1/10 · Minimal
- FEMA flood zone
- X (unshaded)
- Chance of flooding over 30 yrs
- 0.0%
- Est. flood insurance / yr
- $473 – $860
Fire risk 2/10 · Minimal
- Est. fire insurance / yr
- $804 – $1,492
Heat risk 3/10 · Minor
- Hot days now (above 104°F)
- 7 days/yr
- Hot days in 30 yrs
- 16 days/yr
Wind risk 2/10 · Minimal
- Chance of severe wind over 30 yrs
- 0.0%
Air-quality risk 2/10 · Minimal
- Unhealthy air days now
- 1 days/yr
- Unhealthy air days in 30 yrs
- 1 days/yr
Risk factors via First Street. Map © Google.
Why this score? — see what drove the B grade
The composite is a weighted blend of 9 inputs, each scored 0–100. Each bar is that input's sub-score; the figure is the points it added to the 100-point composite (weight × sub-score).
- Cash flow +29.3/30.0
- ARV discount +15.0/15.0
- DSCR +10.0/10.0
- 1% rule +9.3/10.0
- Livability +3.2/5.0
- Rent growth +2.5/5.0
- Condition / age +2.5/5.0
- Schools +1.7/10.0
- Appreciation +0.0/10.0
$69,900
🖨 Deal sheet (PDF) 📄 Offer letter ✓ Due diligence
Listing remarks
Positioned on a highly visible corner along one of the busiest arteries in central Illinois, this 3-bedroom property offers unbeatable exposure and incredible upside! Zoned C-3 Commercial and located within the TIF 5 District in LaSalle, the possibilities here are wide open! Formerly a rental, the home is ready for revitalization! Off-street parking adds convenience and appeal. Selling AS IS, making it a compelling opportunity to renovate and re-lease, reposition for commercial use, or revitalize and flip for the upcoming prime season. A smart investment in a location that works for you!
Key facts
- Zoned c-3 commercial
- Off-street parking
- 2,178 sq ft lot
Tags
Property features AI
Finance
- Other: Fee simple ownership; School bus service available
- Financial info: Special service area applies
- HOA & community: No master association fee required; Community amenities nearby: park, pool, tennis courts, curbs, sidewalks, street lights
Exterior
- Parking: Off-street parking via driveway; Concrete and gravel surfaces; Total of 1 parking space
- Utilities: Public water; Public sewer; Electric service with circuit breakers
- Home design: Detached single-family home; One-story
- Construction: Over 100 years old; Stucco exterior; Brick/mortar foundation; Asphalt roof
- Exterior features: Front porch; Corner lot
Interior
- Kitchen: Country-style kitchen with walk-in pantry
- Bedrooms: 3 bedrooms (all on the main level); Master bedroom on the main level
- Flooring: Carpet in living room, dining room and bedrooms; Vinyl in kitchen and pantry
- Bathrooms: 1 full bathroom
- Heating & cooling: Natural gas heating; Window air conditioning units
- Interior features: 6 total rooms; Unfinished, partial basement; Pantry (main level)
- Laundry & utility: Laundry room
Neighborhood map
What this means for you Summary
Snapshot
- This is a 3-bed/1.0-bath single-family listed at $70k.
Deal economics
- At list price, monthly cash flow is $245 ($3k/yr) — positive.
- The deal already cash-flows at list — no discount required.
- Meets the 1% rule at list price ($1k rent vs $70k).
- Recommended offer: $62k (12.0% below list) — sets the bar for market timing.
- Cap rate 10.5% vs local median 5.6% in LaSalle — top-decile yield for the area; either an underpriced asset or a hidden risk that comps aren't pricing in. Stress-test before assuming the spread holds.
Location & tenants
- Location reads 64/100 on livability (#718 in IL) — a middle-class / working-renter tenant base. Strengths: crime A+, cost of living A+, housing A+; Watch: health & safety C-, employment D+, amenities F.
- La Salle-Peru Twp Hsd 120 (town): math 15% / reading 26% proficiency, ranked #427 of 620 in IL (top 69%) — low school quality limits family demand, transient renter base, plan for 1-2y turnover.
- Zoned schools: Northwest Elem School (math 4% / reading 18%, grade F, #1,460 of 2,056 statewide, top 72%, 634 students, 0% FRL); Lincoln Jr High School (math 4% / reading 11%, grade F, #612 of 665 statewide, top 93%, 258 students, 0% FRL); La Salle-Peru Twp High School (math 15% / reading 26%, grade F, #350 of 693 statewide, top 51%, 1,198 students, 0% FRL).
- Market conditions: 69 active listings in the ZIP; 1 comparable units currently listed for rent nearby; 82 units permitted in LaSalle County in 2024 (0 in 5+ unit buildings).
Forward outlook
- Local home prices are declining (-3.0%/yr); year-one equity from $483 of loan paydown is wiped out by about $2k of value loss. Plan a longer hold.
- LaSalle County population projected at -16% by 2050 — secular population decline; favor cash flow + early exit over multi-decade hold.
- At projected returns (-3.0% appreciation + 3.0% rent growth), your $20k cash investment doubles in ~8 years — after that, you're playing with house money.
Negotiation context
- It's been on market 129 days — a 12% lower offer ($62k) is reasonable based on typical stale-listing flexibility.
- 2 sale attempts; this cycle's ask has dropped $5k (6%) from the opening price — seller is motivated, your offer sets the floor, not the list.
Risks & watch-outs
- Watch-outs: property tax is 2.6% of price; built in 1909 — expect roof / HVAC / electrical / plumbing capex.
Questions for the listing agent
- It's been on market 129 days. Have you received any prior offers? Is the seller open to a 12% concession, seller financing, or rate buy-down credit?
- Built in 1909 — when were the roof, HVAC, electrical panel, plumbing, and water heater last replaced?
- Property tax is high relative to price — has the assessment been appealed recently, and will the sale trigger a re-assessment?
- Why hasn't it sold? Are there any deal-killer items the seller is aware of (foundation, flood, title, zoning, code violations)?
- Is there a deadline driving the sale (1031 exchange, divorce, estate, relocation)? That informs how much negotiation room exists.
- Schools are F-rated, which usually means shorter tenancies and higher turnover. Who's the typical renter profile here, and what's been the actual vacancy rate?
- What's the average days-on-market for RENTAL listings here right now (not sales)? A rising rental-DOM trend means longer vacancies and softer asking-rent achievability than the comps imply.
- What's the recent tenant-quality profile in this submarket — average credit score on applications, eviction rate, late-payment / NSF rate, and stable-employment percentage? A property-management company in the area should have these aggregated.
- How much new for-sale + rental construction is in the pipeline within 1–3 miles? Heavy new supply typically softens prices + rents 12–24 months out; constrained supply supports both.
Investment metrics
- 1% rule
- 1.43% ✓
- Cap rate
- 10.50%
- Cash-on-cash
- 15.03%
- DSCR
- 1.67
- GRM
- 5.8
CMA / ARV
- ARV (on-the-fly)
- $119,355
- Comps found
- 12
Show comp detail 12 sales within ~0.75 mi
| Address | Dist | Beds/Ba | Sqft | Sold | Price | $/sf | Match |
|---|---|---|---|---|---|---|---|
| 422 Chartres St | 0.09mi | 2/1.0 (-1) | 1,096 (+0%) | 4mo | $120,000 | $109 | 87 |
| 748 7th St | 0.54mi | 3/1.0 | 1,146 (+5%) | 1mo | $135,900 | $119 | 66 |
| 542 8th St | 0.48mi | 3/2.0 | 1,120 (+2%) | 8mo | $125,100 | $112 | 63 |
| 43 Westclox Ave | 0.45mi | 2/1.0 (-1) | 1,164 (+6%) | 4mo | $33,000 | $28 | 60 |
| 418 6th St | 0.39mi | 3/1.0 | 1,236 (+13%) | 1mo | $176,000 | $142 | 60 |
| 508 7th St | 0.40mi | 2/2.0 (-1) | 1,183 (+8%) | 3mo | $121,000 | $102 | 56 |
| 308 6th St | 0.25mi | 2/1.0 (-1) | 935 (-15%) | 8mo | $125,000 | $134 | 52 |
| 618 10th St | 0.58mi | 2/1.0 (-1) | 987 (-10%) | 1mo | $90,500 | $92 | 50 |
| 1038 Wright St | 0.63mi | 2/1.0 (-1) | 1,005 (-8%) | 3mo | $95,000 | $95 | 50 |
| 1038 Wright St | 0.63mi | 2/1.0 (-1) | 1,005 (-8%) | 3mo | $95,000 | $95 | 50 |
| 719 12th St | 0.69mi | 3/2.5 | 1,180 (+8%) | 2mo | $140,000 | $119 | 47 |
| 1409 Pulaski St | 0.50mi | 3/1.0 | 1,259 (+15%) | 8mo | $120,000 | $95 | 45 |
Match score weights: distance 35% · size 25% · config 20% · recency 20%. Top-matched comps best support the ARV.
Projected returns pro-forma
-3.0% appreciation · 3.0% rent growth · sell at horizon
- IRR
- 5.7%
- Equity multiple
- 1.22×
- Total profit
- $4,342
- Equity at exit
- $10,422
- IRR
- 15.2%
- Equity multiple
- 2.23×
- Total profit
- $24,104
- Equity at exit
- $6,044
Cash invested: $19,572 (down + closing). Projections, not guarantees.
Landlord ↔ Tenant lean methodology
- Overall (STATE)
- 43 Moderately Tenant-Leaning
- State Illinois
- 43 Moderately Tenant-Leaning · D+7
- County
- — inherits STATE
- City
- — inherits STATE
ZIP-level market 61301
- Home prices YoY
- -24.3%
- Active inventory
- 69
- Price-to-rent
- 5.8×
Monthly cashflow live
- Estimated rent
- $1,000 medium interval (Pro) →
- Mortgage (P&I)
- −$367
- Tax from tax record
- −$149 /mo · $1,790/yr
- Insurance
- −$29
- HOA
- −$0
- Vacancy / Maint / Mgmt
- −$210
- Net cashflow
- $245
Break-even live
Sensitivity live
| Price | -10% $285 | -5% $265 | +0% $245 | +5% $225 | +10% $206 |
|---|---|---|---|---|---|
| Rent | -10% $166 | -5% $206 | +0% $245 | +5% $285 | +10% $324 |
| Rate | -1.0pp $280 | -0.5pp $263 | base $245 | +0.5pp $227 | +1.0pp $209 |
UW: 25.0% down · 7.5% · 30yr · 1.5% tax · 5.0% vac · 8.0% maint · 8.0% mgmt
Financing live
Cash to close
- Down payment
- $17,475
- Closing costs
- $2,097
- Reserves months
- —
- Total cash needed
- —
Loan-product check · same deal, 3 products live
Conventional
25% down · 7.5% · 30yr
- Down + closing
- —
- Monthly P&I
- —
- Monthly cashflow
- —
- DSCR
- —
- Eligible?
- —
Personal DTI + credit; lowest rate.
DSCR
20% down · 8.5% · 30yr
- Down + closing
- —
- Monthly P&I
- —
- Monthly cashflow
- —
- DSCR
- —
- Eligible?
- —
No personal income docs; deal must DSCR.
Hard money
10% down · 12.0% · 12mo
- Down + closing
- —
- Monthly P&I
- —
- Monthly cashflow
- —
- DSCR
- —
- Eligible?
- —
Short-term bridge; refi at stabilization.
Rent comps 1 comps
| Address | Beds | Baths | Sqft | Rent | $/sqft | DOM | Units | Dist |
|---|---|---|---|---|---|---|---|---|
| 1925 Main St Peru, IL | 2.0 | 1.0 | 840 | $1,000 | $1.19 | 46d | 1 | 1.48mi |
Listing history 19 events
-
2026-06-22days on market $69,900 Active 129 DOM
-
2026-06-19days on market $69,900 Active 126 DOM
-
2026-06-18days on market $69,900 Active 125 DOM
-
2026-06-17days on market $69,900 Active 124 DOM
-
2026-06-16days on market $69,900 Active 123 DOM
-
2026-06-15days on market $69,900 Active 122 DOM
-
2026-06-14days on market $69,900 Active 120 DOM
-
2026-06-12days on market $69,900 Active 119 DOM
-
2026-06-09days on market $69,900 Active 116 DOM
-
2026-06-08days on market $69,900 Active 115 DOM
-
2026-06-07days on market $69,900 Active 114 DOM
-
2026-06-02days on market $69,900 Active 109 DOM
-
2026-06-01days on market $69,900 Active 108 DOM
-
2026-05-31days on market $69,900 Active 107 DOM
-
2026-05-30days on market $69,900 Active 106 DOM
-
2026-05-21price $69,900
-
2026-02-26status Active
-
2026-02-26historical Contingent - Continue to Show
-
2026-02-13$74,500 Active
ⓘ Source: listings_history table (triggers on properties + properties_extension) + one-shot
backfill from property_details.listing_events for pre-trigger history.
Tax reassessment forecast IL · Partial reset (capped growth)
- Current annual tax
- $1,790 · $149/mo
- Projected year-2 tax
- $1,790 · $149/mo
- Expected delta
- $0/yr ($0/mo · 0.0%)
ⓘ Screening estimate from a state-policy table — verify with the county assessor before closing.
Climate risk First Street
- Flood 1/10 Low FEMA zone X (unshaded) · 0% chance over 30 yrs
- Wildfire 2/10 Low
- Heat 3/10 Moderate 7 d/yr ≥104°F today · 16 d/yr by 30 yrs out
- Wind 2/10 Low 0% chance of damaging wind over 30 yrs
- Air quality 2/10 Low 1 unhealthy d/yr today · 1 by 30 yrs out
Nearby sold comps map
Loading sold comps map…
Walkable amenities ~0.75 mi
Loading nearby amenities…
Taxation est. · year 1
- Rental income
- $12,000
- − Mortgage interest
- −$3,915
- − Property taxes
- −$1,790
- − Insurance
- −$350
- − Repairs & maintenance
- −$960
- − Management
- −$960
- − Depreciation
- −$2,033
- Taxable income
- $1,992
- Est. tax owed @ 24.0%
- −$478
- After-tax cash flow
- $2,464/yr
For passive investors: Depreciation is non-cash, so a rental often shows a tax loss while cash-flowing — sheltering income. Rental losses are passive: they offset passive income freely, and up to $25,000/yr can offset ordinary (W-2) income if you actively participate and your MAGI is under $100k (phasing out to $0 by $150k); unused losses carry forward. On sale, claimed depreciation is recaptured at up to 25%, and gains may owe capital-gains tax (a 1031 exchange can defer both). Figures are a year-1 estimate at your 24.0% rate — not tax advice; consult a CPA.
Schools (NCES district)
- District
- La Salle-Peru Twp Hsd 120
- NCES district ID
- 1722110
- Math proficiency
- 15% ▼ -11.00%
- Reading proficiency
- 26% ▼ -11.00%
- Median HH income
- $40,449
- Composite
- 17.37/100
- National rank
- #9070
- State rank
- #427 of 620 in IL
Livability — LaSalle
- Score
- 64/100
- State rank
- #718
- US rank
- #14579
Category grades
Schools grade is shown separately in the Schools card above.
Census & demographics
- Census place
- LaSalle, IL
- Population (ZIP)
- 10,312
Population outlook (LaSalle County) Hauer SSP2
- Today (2025)
- 107,080 people
- By 2030
- 104,196 · -2.7%
- By 2040
- 97,413 · -9.0%
- By 2050
- 90,294 · -15.7%
- By 2075
- 76,252 · -28.8%
- By 2100
- 61,339 · -42.7%
Race, ethnicity, and origin ACS 2023
- Neighborhood character
- Predominantly White (74%)
- Race & ethnicity
- White 74% Hispanic / Latino 18% Two or more races 8% Black 5%
- Hispanic origin (detail)
- Mexican 18%
- Common ancestry
- Romanian 9% Lithuanian 3% Scotch-Irish 1%
- Foreign-born
- 6% · Canada
- Languages at home
- 87% English-only · Spanish 10% German/W. Germanic 1% Other Indo-European 1%
Political lean MEDSL · LaSalle
- 2024 margin
- R (+18.5) · D 40.1% · R 58.6% · Other 1.3%
- 2008→2024 swing
- -29.6pp toward R · 2008: 11.1pp · 2024: -18.5pp
- All cycles
- 2024: R+18.5 2020: R+14.3 2016: R+14.4 2012: R+0.4 2008: D+11.1
Not yet ingested
- Civics
- —
Market trends
- HPI YoY
- ▼ -52.46%
- Current HPI
- 163.091
- Rent YoY
- —
- Metro
- —
- State GDP YoY
- ▲ 1.59%
- F500 in state
- 60
Industry mix (Fortune 500 HQ in IL)
| Industry | F500 HQs | Revenue |
|---|---|---|
| Insurance | 4 | $201B |
|
||
| Consumer Goods | 4 | $87B |
|
||
| Industrial Machinery | 3 | $64B |
|
||
| Healthcare | 2 | $55B |
|
||
| Retail / Pharmacy | 1 | $148B |
|
||
| Agriculture / Food | 1 | $86B |
|
||
Price history
-6.2% since first listed4 events — show timeline
- 2026-05-21 Price Changed $69,900 MRED as Distributed by MLS Grid
- 2026-02-26 Relisted — MRED as Distributed by MLS Grid
- 2026-02-26 Contingent — MRED as Distributed by MLS Grid
- 2026-02-13 Listed $74,500 MRED as Distributed by MLS Grid
Property tax history
+4.8%/yrLatest (2024): $1,790 · +6.1% YoY. Source: county tax records.
Cash-flow waterfall
monthlySold comps — $/sqft
last 12 mo · ≤1 miLoading sold comps…