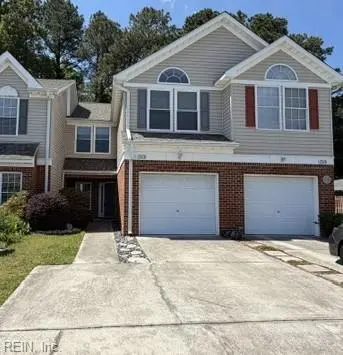
2578 Hartley St · Virginia Beach, VA
Flood risk 3/10 · Minor
- FEMA flood zone
- X (unshaded)
- Chance of flooding over 30 yrs
- 0.1%
- Est. flood insurance / yr
- $507 – $1,088
Fire risk 3/10 · Minor
- Est. fire insurance / yr
- $666 – $1,236
Heat risk 9/10 · Severe
- Hot days now (above 105°F)
- 7 days/yr
- Hot days in 30 yrs
- 18 days/yr
Wind risk 8/10 · Major
- Chance of severe wind over 30 yrs
- 99.0%
Air-quality risk 2/10 · Minimal
- Unhealthy air days now
- 0 days/yr
- Unhealthy air days in 30 yrs
- 2 days/yr
Risk factors via First Street. Map © Google.
Why this score? — see what drove the D- grade
The composite is a weighted blend of 9 inputs, each scored 0–100. Each bar is that input's sub-score; the figure is the points it added to the 100-point composite (weight × sub-score).
- Cash flow +10.1/30.0
- ARV discount +7.0/15.0
- Schools +6.4/10.0
- Livability +4.2/5.0
- Rent growth +3.4/5.0
- DSCR +2.9/10.0
- Condition / age +2.5/5.0
- 1% rule +2.3/10.0
- Appreciation +0.0/10.0
$399,900
🖨 Deal sheet 📄 Offer letter ✓ Due diligence
Listing remarks
Move-in ready all-brick townhome with a new roof, fresh paint, new carpet, and gleaming floors downstairs! Spacious living area features a cozy wood-burning fireplace and opens to the dining area with chair rail detail. Light and bright eat-in kitchen offers plenty of cabinet space, all stainless-steel appliances, and great functionality. Utility closet includes washer and dryer. Upstairs bedrooms include a primary suite with private bath. Enjoy the fenced backyard with patio and brand-new fence, perfect for relaxing outdoors. Conveniently located in a desirable school district with easy access to shopping, dining, and more!
Key facts
- Pantry
- Attached garage
- Gas fireplace
Tags
Property features AI
Finance
- HOA & community: No HOA fees indicated
Exterior
- Parking: Attached 1-car garage; Driveway parking spaces
- Utilities: City/County water; City/County sewer; Gas water heater; Electric power
- Home design: Attached property; Transitional style; Two stories (two living levels); Slab foundation
- Construction: Vinyl siding; Asphalt shingle roof
- Exterior features: Patio; Back privacy fence; Storage shed
Interior
- Kitchen: Dishwasher; Disposal; Microwave; Gas range; Refrigerator
- Bedrooms: One bedroom with ensuite
- Flooring: Carpet; Ceramic; Laminate
- Bathrooms: Two full bathrooms; One half bathroom
- Heating & cooling: Natural gas heating; Central air conditioning
- Interior features: Ceiling fan; Cable hookup; Garage door opener; Gas fireplace; Primary bedroom with double sink; Walk-in closet; Window treatments; Attic; Foyer; Breakfast area; Utility closet
- Laundry & utility: Washer; Dryer
Neighborhood map
What this means for you Summary
Snapshot
- This is a 3-bed/2.5-bath townhouse listed at $400k.
Deal economics
- At list price, monthly cash flow is $-235 ($-3k/yr) — negative.
- To cash-flow at today's rent, offer at most $358k (10.4% below list).
- To meet the 1% rule (rent ≥ 1% of price), the offer needs to be $291k (27.3% below list).
- Recommended offer: $291k (27.3% below list) — sets the bar for 1% rule.
- Cap rate 5.6% vs local median 3.5% in Virginia Beach — top-decile yield for the area; either an underpriced asset or a hidden risk that comps aren't pricing in. Stress-test before assuming the spread holds.
Location & tenants
- Location reads 83/100 on livability (#38 in VA, #880 nationally) — a professional / high-income tenant draw. Strengths: amenities A+, employment A+, housing A+; Watch: cost of living C-, commute F.
- Va Beach City Public School District (urban): math 69% / reading 78% proficiency, ranked #10 of 131 in VA (top 8%) — strong family-tenant draw, lease renewals of 3-5y typical.
- Zoned schools: Princess Anne Elementary (math 85% / reading 86%, grade A+, #61 of 1,108 statewide, top 6%, 682 students, 13% FRL); Floyd Kellam High (math 83% / reading 93%, grade A, #13 of 319 statewide, top 4%, 1,882 students, 14% FRL) — zoned schools average 13% FRL vs 28% district-wide (15 pts lower); this property's tenant base skews higher-income than the district average.
- Zoned-school proficiency averages 87% at this address vs 74% district-wide (+13 pts) — the actual schools serving this property are materially stronger than the Va Beach City Public School District average implies; a family-tenant draw the district grade alone would hide.
- Market conditions: Rents rising (+3.8%/yr); 356 active listings in the ZIP; 5 comparable units currently listed for rent nearby; rentals at typical pace (median 24d on market — plan ~3-4 weeks tenant-placement turnaround); high-income renter base; 666 units permitted in Virginia Beach city in 2024 (347 in 5+ unit buildings).
Forward outlook
- Local home prices are declining (-3.0%/yr); year-one equity from $3k of loan paydown is wiped out by about $12k of value loss. Plan a longer hold.
- Virginia Beach County population projected at +6% by 2050 — modest demand growth; plan on rents tracking national, not racing it.
Negotiation context
- Only 14 days on market — expect competitive offers; lowballing is unlikely to land.
- 3 sale attempts since 9y ago with the ask held roughly flat each time — persistent listings suggest the price (not the market) is what's stuck; bring a comps-based counter.
- Current owner paid $240k; list at $400k implies a 67% gain — meaningful room to come down on a strong offer.
Risks & watch-outs
- Climate carrying-cost: severe wind risk, 99% chance of damaging wind over 30y; extreme-heat days projected 7→18/yr by 2055 (HVAC capex compounding) — expect insurance premiums to compound above CPI over the hold.
Questions for the listing agent
- What do current leases actually rent for vs. the listed asking? Can we see a recent rent roll and the last 12 months of T-12 income?
- Is there a deadline driving the sale (1031 exchange, divorce, estate, relocation)? That informs how much negotiation room exists.
- Schools are A-rated — typically a magnet for longer-tenancy family renters. What's the average tenant stay here, and is there a school-zone premium baked into asking?
- The area grade is low — what's the realistic commute time and amenity access for the typical tenant pool here? Any planned neighborhood developments (good or bad) we should know about?
- What's the average days-on-market for RENTAL listings here right now (not sales)? A rising rental-DOM trend means longer vacancies and softer asking-rent achievability than the comps imply.
- What's the recent tenant-quality profile in this submarket — average credit score on applications, eviction rate, late-payment / NSF rate, and stable-employment percentage? A property-management company in the area should have these aggregated.
- How much new for-sale + rental construction is in the pipeline within 1–3 miles? Heavy new supply typically softens prices + rents 12–24 months out; constrained supply supports both.
Investment metrics
- 1% rule
- 0.73% ✗
- Cap rate
- 5.59%
- Cash-on-cash
- -2.52%
- DSCR
- 0.89
- GRM
- 11.5
CMA / ARV
- ARV (on-the-fly)
- $395,483
- Comps found
- 12
Show comp detail 12 sales within ~0.75 mi
| Address | Dist | Beds/Ba | Sqft | Sold | Price | $/sf | Match |
|---|---|---|---|---|---|---|---|
| 2578 Hartley St | 0.00mi | 3/2.5 | 1,727 (0%) | 1mo | $399,900 | $232 | 99 |
| 2604 Bracston Rd | 0.16mi | 3/2.5 | 1,724 (-0%) | 1mo | $379,000 | $220 | 92 |
| 2350 Charing Cross Rd | 0.20mi | 3/2.5 | 1,727 (0%) | 0mo | $410,000 | $237 | 90 |
| 2654 Bracston Rd | 0.07mi | 3/2.5 | 1,741 (+1%) | 7mo | $407,000 | $234 | 89 |
| 2656 Bracston Rd | 0.07mi | 3/2.5 | 1,751 (+1%) | 7mo | $360,000 | $206 | 88 |
| 2589 Hartley St | 0.04mi | 3/2.5 | 1,889 (+9%) | 2mo | $432,000 | $229 | 81 |
| 2697 Bracston Rd | 0.16mi | 3/2.5 | 1,586 (-8%) | 4mo | $415,500 | $262 | 75 |
| 2449 Dillingham Rd | 0.18mi | 3/2.5 | 1,849 (+7%) | 6mo | $419,900 | $227 | 75 |
| 2400 Dillingham Rd | 0.11mi | 3/2.5 | 1,889 (+9%) | 6mo | $430,000 | $228 | 74 |
| 2623 Bracston Rd | 0.12mi | 3/2.5 | 1,889 (+9%) | 7mo | $409,000 | $217 | 73 |
| 2510 Hartley St | 0.17mi | 3/2.5 | 1,889 (+9%) | 6mo | $370,000 | $196 | 72 |
| 2343 Nottoway Ln | 0.74mi | 3/2.5 | 1,884 (+9%) | 1mo | $520,000 | $276 | 50 |
Match score weights: distance 35% · size 25% · config 20% · recency 20%. Top-matched comps best support the ARV.
Projected returns pro-forma
-3.0% appreciation · 3.78% rent growth · sell at horizon
- IRR
- -19.7%
- Equity multiple
- 0.31×
- Total profit
- $-77,573
- Equity at exit
- $59,626
- IRR
- -11.2%
- Equity multiple
- 0.31×
- Total profit
- $-77,640
- Equity at exit
- $34,576
Cash invested: $111,972 (down + closing). Projections, not guarantees.
Landlord ↔ Tenant lean methodology
- Overall (STATE)
- 55 Moderately Landlord-Leaning
- State Virginia
- 55 Moderately Landlord-Leaning · D+2
- County
- — inherits STATE
- City
- — inherits STATE
ZIP-level market 23456
- Rents YoY
- 3.8%
- Active inventory
- 356
- Price-to-rent
- 11.5×
Monthly cashflow live
- Estimated rent
- $2,908 high interval (Pro) →
- Mortgage (P&I)
- −$2,097
- Tax from tax record
- −$269 /mo · $3,225/yr
- Insurance
- −$167
- HOA
- −$0
- Vacancy / Maint / Mgmt
- −$611
- Net cashflow
- $-235
Break-even live
UW: 25.0% down · 7.5% · 30yr · 1.5% tax · 5.0% vac · 8.0% maint · 8.0% mgmt
Financing live
Cash to close
- Down payment
- $99,975
- Closing costs
- $11,997
- Reserves months
- —
- Total cash needed
- —
Loan-product check · same deal, 3 products live
Conventional
25% down · 7.5% · 30yr
- Down + closing
- —
- Monthly P&I
- —
- Monthly cashflow
- —
- DSCR
- —
- Eligible?
- —
Personal DTI + credit; lowest rate.
DSCR
20% down · 8.5% · 30yr
- Down + closing
- —
- Monthly P&I
- —
- Monthly cashflow
- —
- DSCR
- —
- Eligible?
- —
No personal income docs; deal must DSCR.
Hard money
10% down · 12.0% · 12mo
- Down + closing
- —
- Monthly P&I
- —
- Monthly cashflow
- —
- DSCR
- —
- Eligible?
- —
Short-term bridge; refi at stabilization.
Rent comps 5 comps
| Address | Beds | Baths | Sqft | Rent | $/sqft | DOM | Units | Dist |
|---|---|---|---|---|---|---|---|---|
| 2591 Hartley St Virginia Beach, VA | 3.0 | 2.5 | 1589 | $2,250 | $1.42 | 7d | 1 | 0.02mi |
| 2409 Dillingham Rd Virginia Beach, VA | 3.0 | 2.5 | 1751 | $3,000 | $1.71 | 23d | 1 | 0.11mi |
| 2228 Martlet Ln Virginia Beach, VA | 3.0 | 3.0 | 2185 | $3,400 | $1.56 | 23d | 1 | 0.66mi |
| 2361 Nottoway Ln Virginia Beach, VA | 3.0 | 2.5 | 2008 | $3,200 | $1.59 | 23d | 1 | 0.77mi |
| 2250 Princess Anne Rd Virginia Beach, VA | 3.0 | 1.5 | 1680 | $2,300 | $1.37 | 23d | 1 | 1.09mi |
Listing history 9 events
-
2026-05-22status Under Contract
-
2026-05-13historical Active Under Contract
-
2026-05-08$399,900 Active
-
2026-05-04historical
-
2026-04-21$399,900 Active
-
2017-07-11soldstatus $240,000
-
2017-06-19status Under Contract
-
2017-06-01$244,900 Active
-
2001-06-26soldstatus $124,900
ⓘ Source: listings_history table (triggers on properties + properties_extension) + one-shot
backfill from property_details.listing_events for pre-trigger history.
Tax reassessment forecast VA · Resets to sale price
- Current annual tax
- $3,225 · $269/mo
- Projected year-2 tax
- $3,279 · $273/mo
- Expected delta
- +$54/yr (+$4/mo · 1.7%)
ⓘ Screening estimate from a state-policy table — verify with the county assessor before closing.
Climate risk First Street
- Flood 3/10 Moderate FEMA zone X (unshaded) · 10% chance over 30 yrs
- Wildfire 3/10 Moderate
- Heat 9/10 Extreme 7 d/yr ≥105°F today · 18 d/yr by 30 yrs out
- Wind 8/10 Severe 99% chance of damaging wind over 30 yrs
- Air quality 2/10 Low 0 unhealthy d/yr today · 2 by 30 yrs out
Nearby sold comps map
Loading sold comps map…
Walkable amenities ~0.75 mi
Loading nearby amenities…
Taxation est. · year 1
- Rental income
- $34,897
- − Mortgage interest
- −$22,401
- − Property taxes
- −$3,225
- − Insurance
- −$2,000
- − Repairs & maintenance
- −$2,792
- − Management
- −$2,792
- − Depreciation
- −$11,633
- Taxable loss
- −$9,945
- Est. tax savings @ 24.0%
- +$2,387
- After-tax cash flow
- $-434/yr
For passive investors: Depreciation is non-cash, so a rental often shows a tax loss while cash-flowing — sheltering income. Rental losses are passive: they offset passive income freely, and up to $25,000/yr can offset ordinary (W-2) income if you actively participate and your MAGI is under $100k (phasing out to $0 by $150k); unused losses carry forward. On sale, claimed depreciation is recaptured at up to 25%, and gains may owe capital-gains tax (a 1031 exchange can defer both). Figures are a year-1 estimate at your 24.0% rate — not tax advice; consult a CPA.
Schools (NCES district)
- District
- Va Beach City Public School District
- NCES district ID
- 5103840
- Math proficiency
- 69% ▼ -19.00%
- Reading proficiency
- 78% ▼ -7.00%
- Median HH income
- $66,452
- Composite
- 63.81/100
- National rank
- #594
- State rank
- #10 of 131 in VA
Livability — Virginia Beach
- Score
- 83/100
- State rank
- #38
- US rank
- #880
Category grades
Schools grade is shown separately in the Schools card above.
Census & demographics
- Census place
- Virginia Beach, VA
- County
- Virginia Beach City · 448,227 people
- City population
- 448,227
- Metro
- Virginia Beach-Norfolk-Newport News, VA-NC
- Population (ZIP)
- 61,911
- Household income
- $130,533
- Rent vs Own
- Severe rent burden
- 390.0
Population outlook (Virginia Beach County) Hauer SSP2
- Today (2025)
- 480,401 people
- By 2030
- 491,221 · +2.3%
- By 2040
- 504,882 · +5.1%
- By 2050
- 508,847 · +5.9%
- By 2075
- 504,831 · +5.1%
- By 2100
- 465,867 · -3.0%
Race, ethnicity, and origin ACS 2023
- Neighborhood character
- Diverse neighborhood (Simpson 0.60)
- Race & ethnicity
- White 60% Black 13% Asian 12% Two or more races 10% Hispanic / Latino 9%
- Hispanic origin (detail)
- Mexican 3% Puerto Rican 2%
- Common ancestry
- Romanian 2% Slovak 2% Lithuanian 2%
- Foreign-born
- 12% · Canada, China, Vietnam
- Languages at home
- 85% English-only · Tagalog/Filipino 4% Spanish 4% Other Indo-European 2%
Political lean MEDSL · Virginia Beach
- 2024 margin
- Toss-up / Even · D 50.7% · R 48.0% · Other 1.3%
- 2008→2024 swing
- +3.4pp toward D · 2008: -0.7pp · 2024: 2.6pp
- All cycles
- 2024: D+2.6 2020: D+5.4 2016: R+4.5 2012: R+2.5 2008: R+0.7
Not yet ingested
- Civics
- —
Market trends
- HPI YoY
- ▼ -328.17%
- Current HPI
- 318.3094
- Rent YoY
- ▲ 3.78%
- Metro
- Virginia Beach-Norfolk-Newport News, VA-NC
- State GDP YoY
- ▲ 2.40%
- F500 in state
- 50
Industry mix (Fortune 500 HQ in VA)
| Industry | F500 HQs | Revenue |
|---|---|---|
| Aerospace / Defense | 4 | $236B |
|
||
| Technology / Defense | 3 | $32B |
|
||
| Financial Services | 2 | $176B |
|
||
| Utilities | 2 | $27B |
|
||
| Insurance | 2 | $25B |
|
||
| Technology | 2 | $15B |
|
||
Price history
+220.2% since first listed9 events — show timeline
- 2026-05-22 Pending — REINMLS
- 2026-05-13 Contingent — REINMLS
- 2026-05-08 Listed $399,900 REINMLS
- 2026-05-04 Listing Removed — REINMLS
- 2026-04-21 Listed $399,900 REINMLS
- 2017-07-11 Sold (Public Records) $240,000 Public Records
- 2017-06-19 Pending — REINMLS
- 2017-06-01 Listed $244,900 REINMLS
- 2001-06-26 Sold (Public Records) $124,900 Public Records
Property tax history
+4.1%/yrLatest (2025): $3,225 · +4.5% YoY. Source: county tax records.
Cash-flow waterfall
monthlySold comps — $/sqft
last 12 mo · ≤1 miLoading sold comps…