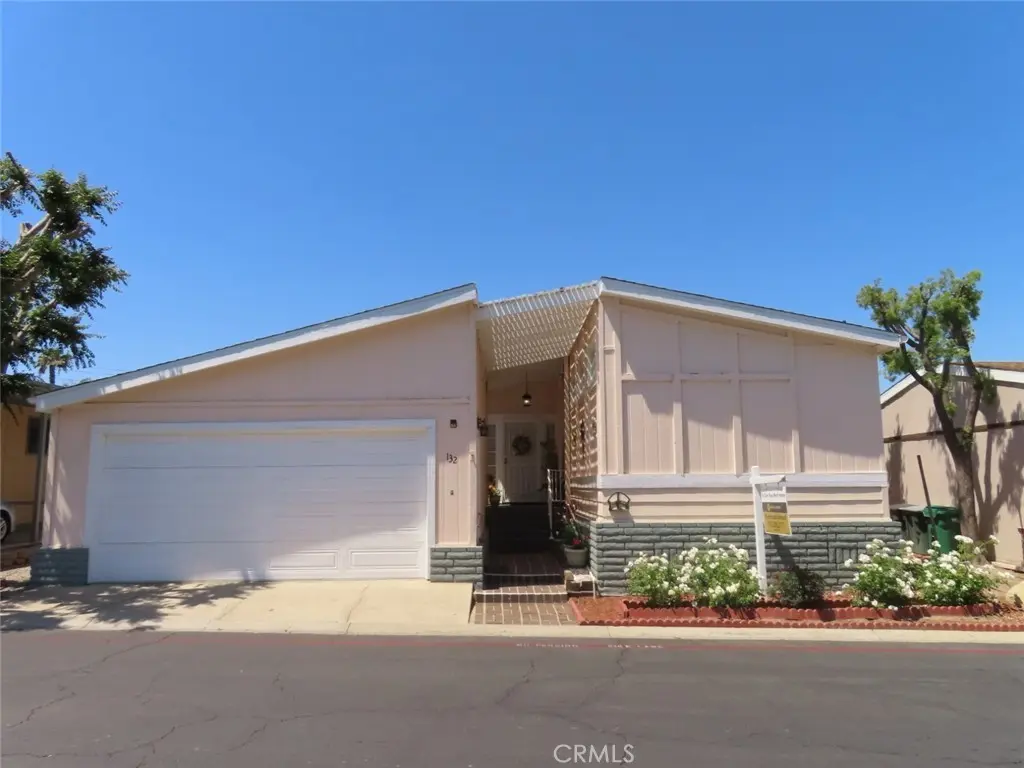
1550 Rimpau Ave #132 · Corona, CA
Flood risk 1/10 · Minimal
- FEMA flood zone
- X (unshaded)
- Chance of flooding over 30 yrs
- 0.0%
- Est. flood insurance / yr
- $507 – $1,088
Fire risk 8/10 · Major
- Est. fire insurance / yr
- $659 – $1,223
Heat risk 7/10 · Major
- Hot days now (above 101°F)
- 7 days/yr
- Hot days in 30 yrs
- 20 days/yr
Wind risk 1/10 · Minimal
- Chance of severe wind over 30 yrs
- —
Air-quality risk 9/10 · Severe
- Unhealthy air days now
- 19 days/yr
- Unhealthy air days in 30 yrs
- 23 days/yr
Risk factors via First Street. Map © Google.
Why this score? — see what drove the C+ grade
The composite is a weighted blend of 9 inputs, each scored 0–100. Each bar is that input's sub-score; the figure is the points it added to the 100-point composite (weight × sub-score).
- Cash flow +30.0/30.0
- DSCR +10.0/10.0
- 1% rule +7.9/10.0
- Schools +5.1/10.0
- Rent growth +4.1/5.0
- Livability +3.2/5.0
- Condition / age +2.5/5.0
- ARV discount +0.0/15.0
- Appreciation +0.0/10.0
$229,900
🖨 Deal sheet (PDF) 📄 Offer letter ✓ Due diligence
Listing remarks
Welcome to this spacious and exceptionally well-maintained 2-bedroom, 2-bathromm manufactured home 1,533 square feet of comfortable living space. Pride of ownership is evident throughout this move-in ready home, featuring an inviting floor plan with generous living and dining areas, abundant natural light, ample storage. The well-appointed kitchen provides plenty of cabinet and counter space, making it ideal for everyday living and entertaining. Step outside to enjoy the private patio, perfect for relaxing, outdoor dining, or entertaining guests. The home's excellent condition and thoughtful care make it a standout opportunity for buyers seeking comfort, space, and value. Property located a
Key facts
- Community amenities
- Access to shopping
- Private patio
Tags
Property features AI
Finance
- Other: Park name: Villa Corona Mobile Home Park; Pets allowed with breed restrictions
- Financial info: Land lease property (park)
- HOA & community: Land lease ($1,700) — park-managed
Exterior
- Parking: 2 garage spaces; 2 total parking spaces; Park provides parking accessibility
- Utilities: Electricity on property (electricity connected/available); Natural gas connected and available; Water connected; private water source; Public sewer (sewer connected/available); Telephone, cable connected/available
- Home design: Mobile home (model 187) — mobile home remains; Triple body type; Single story; Entry level 1
- Construction: Mobile width 39 ft, length 122 ft; Year built source: Builder
- Exterior features: Open patio; Patio; Community pool (in-ground); In-ground spa (community and rooftop listed); Close to clubhouse; Street lighting; Sidewalks
Interior
- Kitchen: Garbage disposal; Gas range and gas oven; Built-in trash/recycling; Water line to refrigerator; Dishwasher; High-efficiency water heater; Open kitchen to family room; Remodeled kitchen
- Bedrooms: Main floor bedroom(s)
- Flooring: Carpet; Laminated flooring
- Bathrooms: 2 full bathrooms
- Heating & cooling: Central heating (central furnace); Central cooling
- Interior features: Crown moldings; Entry at front; One-level home; Entry; All bedrooms on main floor; Main floor bedroom; Primary bathroom
- Laundry & utility: Laundry in closet; Dryer included; Has laundry
Neighborhood map
What this means for you Summary
Snapshot
- This is a 2-bed/2.0-bath manufactured listed at $230k.
Deal economics
- At list price, monthly cash flow is $994 ($12k/yr) — positive.
- The deal already cash-flows at list — no discount required.
- Meets the 1% rule at list price ($3k rent vs $230k).
- Recommended offer: $226k (1.5% below list) — sets the bar for market timing.
- Cap rate 11.5% vs local median 2.9% in Corona — top-decile yield for the area; either an underpriced asset or a hidden risk that comps aren't pricing in. Stress-test before assuming the spread holds.
Location & tenants
- Location reads 63/100 on livability (#461 in CA) — a middle-class / working-renter tenant base. Strengths: employment A+, housing A-; Watch: commute C-, health & safety D, amenities F.
- Corona-Norco Unified (suburban): math 46% / reading 61% proficiency, ranked #312 of 1,400 in CA (top 22%) — acceptable for families but not a draw, mixed tenant base, ~2y average lease.
- Market conditions: Rents rising fast (+6.2%/yr); 76 active listings in the ZIP; 11 comparable units currently listed for rent nearby; rentals at typical pace (median 26d on market — plan ~3-4 weeks tenant-placement turnaround); high-income renter base; 9,195 units permitted in Riverside County in 2024 (1,512 in 5+ unit buildings).
Forward outlook
- Local home prices are declining (-3.0%/yr); year-one equity from $2k of loan paydown is wiped out by about $7k of value loss. Plan a longer hold.
- Riverside County population projected at +22% by 2050 — long-run rental-demand tailwind backs the buy-and-hold thesis.
- At projected returns (-3.0% appreciation + 6.2% rent growth), your $64k cash investment doubles in ~6 years — after that, you're playing with house money.
Negotiation context
- It's been on market 17 days — a 2% lower offer ($226k) is reasonable based on typical stale-listing flexibility.
- 3 sale attempts since 21y ago with the ask held roughly flat each time — persistent listings suggest the price (not the market) is what's stuck; bring a comps-based counter.
Risks & watch-outs
- Climate carrying-cost: severe wildfire risk; extreme-heat days projected 7→20/yr by 2055 (HVAC capex compounding) — expect insurance premiums to compound above CPI over the hold.
Questions for the listing agent
- Is there a deadline driving the sale (1031 exchange, divorce, estate, relocation)? That informs how much negotiation room exists.
- Schools are B-rated — typically a magnet for longer-tenancy family renters. What's the average tenant stay here, and is there a school-zone premium baked into asking?
- What's the average days-on-market for RENTAL listings here right now (not sales)? A rising rental-DOM trend means longer vacancies and softer asking-rent achievability than the comps imply.
- What's the recent tenant-quality profile in this submarket — average credit score on applications, eviction rate, late-payment / NSF rate, and stable-employment percentage? A property-management company in the area should have these aggregated.
- How much new for-sale + rental construction is in the pipeline within 1–3 miles? Heavy new supply typically softens prices + rents 12–24 months out; constrained supply supports both.
Investment metrics
- 1% rule
- 1.29% ✓
- Cap rate
- 11.48%
- Cash-on-cash
- 18.54%
- DSCR
- 1.82
- GRM
- 6.5
CMA / ARV
- ARV (on-the-fly)
- $193,158
- Comps found
- 11
Show comp detail 11 sales within ~0.75 mi
| Address | Dist | Beds/Ba | Sqft | Sold | Price | $/sf | Match |
|---|---|---|---|---|---|---|---|
| 1550 Rimpau Ave #159 | 0.00mi | 2/2.0 | 1,440 (-6%) | 5mo | $174,900 | $121 | 86 |
| 1550 Rimpau #125 | 0.00mi | 3/2.0 (+1) | 1,456 (-5%) | 3mo | $222,500 | $153 | 84 |
| 1550 Rimpau Ave #52 | 0.00mi | 2/2.0 | 1,344 (-12%) | 4mo | $140,000 | $104 | 76 |
| 1550 Rimpau Ave #61 | 0.00mi | 3/2.0 (+1) | 1,547 (+1%) | 22mo | $268,000 | $173 | 75 |
| 1550 Rimpau Ave #138 | 0.00mi | 3/2.0 (+1) | 1,344 (-12%) | 1mo | $170,000 | $126 | 74 |
| 1550 Rimpau Ave #18 | 0.00mi | 3/2.0 (+1) | 1,680 (+10%) | 8mo | $185,000 | $110 | 73 |
| 1550 Rimpau Ave #39 | 0.00mi | 2/2.0 | 1,344 (-12%) | 9mo | $135,000 | $100 | 72 |
| 1550 Rimpau #37 | 0.00mi | 3/2.0 (+1) | 1,344 (-12%) | 3mo | $150,000 | $112 | 72 |
| 1550 Rimpau Ave #53 | 0.00mi | 2/2.0 | 1,680 (+10%) | 16mo | $217,687 | $130 | 71 |
| 1550 Rimpau Ave #93 | 0.09mi | 3/2.0 (+1) | 1,440 (-6%) | 12mo | $192,000 | $133 | 71 |
| 1550 Rimpau Ave #144 | 0.00mi | 2/2.0 | 1,344 (-12%) | 14mo | $175,000 | $130 | 68 |
Match score weights: distance 35% · size 25% · config 20% · recency 20%. Top-matched comps best support the ARV.
Projected returns pro-forma
-3.0% appreciation · 6.22% rent growth · sell at horizon
- IRR
- 13.5%
- Equity multiple
- 1.56×
- Total profit
- $35,847
- Equity at exit
- $34,279
- IRR
- 24.5%
- Equity multiple
- 3.42×
- Total profit
- $155,646
- Equity at exit
- $19,878
Cash invested: $64,372 (down + closing). Projections, not guarantees.
Landlord ↔ Tenant lean methodology
- Overall (STATE)
- 18 Strongly Tenant-Friendly
- State California
- 18 Strongly Tenant-Friendly · D+13
- County
- — inherits STATE
- City
- — inherits STATE
ZIP-level market 92881
- Rents YoY
- 6.2%
- Active inventory
- 76
- Price-to-rent
- 6.5×
Monthly cashflow live
- Estimated rent
- $2,955 high interval (Pro) →
- Mortgage (P&I)
- −$1,206
- Tax from tax record
- −$39 /mo · $464/yr
- Insurance
- −$96
- HOA
- −$0
- Vacancy / Maint / Mgmt
- −$621
- Net cashflow
- $994
Break-even live
Sensitivity live
| Price | -10% $1,124 | -5% $1,059 | +0% $994 | +5% $666 | +10% $587 |
|---|---|---|---|---|---|
| Rent | -10% $761 | -5% $878 | +0% $994 | +5% $1,111 | +10% $1,228 |
| Rate | -1.0pp $1,110 | -0.5pp $1,053 | base $994 | +0.5pp $935 | +1.0pp $874 |
UW: 25.0% down · 7.5% · 30yr · 1.5% tax · 5.0% vac · 8.0% maint · 8.0% mgmt
Financing live
Cash to close
- Down payment
- $57,475
- Closing costs
- $6,897
- Reserves months
- —
- Total cash needed
- —
Loan-product check · same deal, 3 products live
Conventional
25% down · 7.5% · 30yr
- Down + closing
- —
- Monthly P&I
- —
- Monthly cashflow
- —
- DSCR
- —
- Eligible?
- —
Personal DTI + credit; lowest rate.
DSCR
20% down · 8.5% · 30yr
- Down + closing
- —
- Monthly P&I
- —
- Monthly cashflow
- —
- DSCR
- —
- Eligible?
- —
No personal income docs; deal must DSCR.
Hard money
10% down · 12.0% · 12mo
- Down + closing
- —
- Monthly P&I
- —
- Monthly cashflow
- —
- DSCR
- —
- Eligible?
- —
Short-term bridge; refi at stabilization.
Rent comps 11 comps
| Address | Beds | Baths | Sqft | Rent | $/sqft | DOM | Units | Dist |
|---|---|---|---|---|---|---|---|---|
| 1710 Maxwell Ln Unit A Corona, CA | 3.0 | 2.5 | 1254 | $3,100 | $2.47 | 25d | 1 | 0.29mi |
| 1710 Maxwell Ln Unit A Corona, CA | 3.0 | 2.5 | 1254 | $3,300 | $2.63 | 45d | 1 | 0.29mi |
| 876 Tangerine St Corona, CA | 2.0 | 1.0 | 1054 | $2,700 | $2.56 | 25d | 1 | 0.37mi |
| 855 Tangerine St Corona, CA | 2.0 | 1.0 | 1054 | $2,400 | $2.28 | 45d | 1 | 0.40mi |
| 823 Aspen St Corona, CA | 3.0 | 2.0 | 1342 | $3,200 | $2.38 | 45d | 1 | 0.55mi |
| 2050 Napoli Ct #102 Corona, CA | 3.0 | 2.5 | 1385 | $2,995 | $2.16 | 16d | 1 | 0.66mi |
| 2050 Napoli Ct #102 Corona, CA | 3.0 | 2.5 | 1385 | $3,200 | $2.31 | 25d | 1 | 0.66mi |
| 2050 Napoli Ct #102 Corona, CA | 3.0 | 2.5 | 1385 | $2,995 | $2.16 | 18d | 1 | 0.66mi |
| 1925 S Starfire Ave Corona, CA | 3.0 | 2.0 | 1549 | $3,000 | $1.94 | 6d | 1 | 0.84mi |
| 547 Magnolia Ave Corona, CA | 3.0 | 2.5 | 1751 | $4,000 | $2.28 | 45d | 1 | 0.92mi |
| 929 E Grand Blvd Corona, CA | 2.0 | 1.5 | 1425 | $2,800 | $1.96 | 4d | 1 | 1.09mi |
Listing history 11 events
-
2026-06-21days on market $229,900 Active 17 DOM
-
2026-06-18days on market $229,900 Active 14 DOM
-
2026-06-17days on market $229,900 Active 13 DOM
-
2026-06-16days on market $229,900 Active 12 DOM
-
2026-06-15days on market $229,900 Active 11 DOM
-
2026-06-13days on market $229,900 Active 9 DOM
-
2026-06-13days on market $229,900 Active 8 DOM
-
2026-06-09days on market $229,900 Active 5 DOM
-
2026-06-08days on market $229,900 Active 4 DOM
-
2026-06-07remarks 699-char remark
-
2026-06-07$229,900 Active 3 DOM
ⓘ Source: listings_history table (triggers on properties + properties_extension) + one-shot
backfill from property_details.listing_events for pre-trigger history.
Tax reassessment forecast CA · Resets to sale price
- Current annual tax
- $464 · $39/mo
- Projected year-2 tax
- $1,747 · $146/mo
- Expected delta
- +$1,283/yr (+$107/mo · 276.5%)
ⓘ Screening estimate from a state-policy table — verify with the county assessor before closing.
Climate risk First Street
- Flood 1/10 Low FEMA zone X (unshaded) · 0% chance over 30 yrs
- Wildfire 8/10 Severe
- Heat 7/10 Severe 7 d/yr ≥101°F today · 20 d/yr by 30 yrs out
- Wind 1/10 Low
- Air quality 9/10 Extreme 19 unhealthy d/yr today · 23 by 30 yrs out
Nearby sold comps map
Loading sold comps map…
Walkable amenities ~0.75 mi
Loading nearby amenities…
Taxation est. · year 1
- Rental income
- $35,459
- − Mortgage interest
- −$12,878
- − Property taxes
- −$464
- − Insurance
- −$1,150
- − Repairs & maintenance
- −$2,837
- − Management
- −$2,837
- − Depreciation
- −$6,688
- Taxable income
- $8,606
- Est. tax owed @ 24.0%
- −$2,065
- After-tax cash flow
- $9,866/yr
For passive investors: Depreciation is non-cash, so a rental often shows a tax loss while cash-flowing — sheltering income. Rental losses are passive: they offset passive income freely, and up to $25,000/yr can offset ordinary (W-2) income if you actively participate and your MAGI is under $100k (phasing out to $0 by $150k); unused losses carry forward. On sale, claimed depreciation is recaptured at up to 25%, and gains may owe capital-gains tax (a 1031 exchange can defer both). Figures are a year-1 estimate at your 24.0% rate — not tax advice; consult a CPA.
Schools (NCES district)
- District
- Corona-Norco Unified
- NCES district ID
- 0609850
- Math proficiency
- 46% ▲ 1.00%
- Reading proficiency
- 61% ▬ 0.00%
- Median HH income
- $83,380
- Composite
- 50.72/100
- National rank
- #3920
- State rank
- #312 of 1400 in CA
Livability — Corona
- Score
- 63/100
- State rank
- #461
- US rank
- #15787
Category grades
Schools grade is shown separately in the Schools card above.
Census & demographics
- Census place
- Corona, CA
- County
- Riverside County · 2,287,001 people
- City population
- 188,369
- Metro
- Riverside-San Bernardino-Ontario, CA
- Population (ZIP)
- 30,347
- Household income
- $134,932
- Rent vs Own
- Severe rent burden
- 383.0
Population outlook (Riverside County) Hauer SSP2
- Today (2025)
- 2,664,475 people
- By 2030
- 2,802,692 · +5.2%
- By 2040
- 3,050,904 · +14.5%
- By 2050
- 3,256,783 · +22.2%
- By 2075
- 3,655,058 · +37.2%
- By 2100
- 3,766,594 · +41.4%
Race, ethnicity, and origin ACS 2023
- Neighborhood character
- Diverse neighborhood (Simpson 0.69)
- Race & ethnicity
- White 41% Hispanic / Latino 34% Two or more races 17% Asian 14% Black 4%
- Hispanic origin (detail)
- Mexican 29% Cuban 1%
- Common ancestry
- Italian 5% Portuguese 1% Lithuanian 1%
- Foreign-born
- 24% · Canada, South Korea, Vietnam
- Languages at home
- 61% English-only · Spanish 22% Other Indo-European 5% Arabic 3%
Political lean MEDSL · Riverside
- 2024 margin
- Toss-up / Even · D 48.0% · R 49.3% · Other 2.6%
- 2008→2024 swing
- -3.6pp toward R · 2008: 2.3pp · 2024: -1.3pp
- All cycles
- 2024: R+1.3 2020: D+8.0 2016: D+4.3 2012: R+0.4 2008: D+2.3
Not yet ingested
- Civics
- —
Market trends
- HPI YoY
- ▼ -239.86%
- Current HPI
- 351.8447
- Rent YoY
- ▲ 6.22%
- Metro
- Riverside-San Bernardino-Ontario, CA
- State GDP YoY
- ▲ 3.21%
- F500 in state
- 116
Industry mix (Fortune 500 HQ in CA)
| Industry | F500 HQs | Revenue |
|---|---|---|
| Technology | 27 | $1,492B |
|
||
| Financial Services | 3 | $174B |
|
||
| Retail | 3 | $44B |
|
||
| Insurance | 3 | $26B |
|
||
| Media / Entertainment | 2 | $115B |
|
||
| Pharmaceuticals / Biotech | 2 | $62B |
|
||
Price history
+35.6% since first listed7 events — show timeline
- 2026-06-04 Listed $229,900 CRMLS
- 2026-03-09 Listing Removed — CRMLS
- 2026-01-28 Price Changed $239,000 CRMLS
- 2025-11-15 Listed $289,900 CRMLS
- 2025-11-12 Coming Soon — CRMLS
- 2005-09-13 Listing Removed — CRMLS
- 2005-06-16 Listed $169,500 CRMLS
Property tax history
-5.6%/yrLatest (2025): $464 · +6.4% YoY. Source: county tax records.
Cash-flow waterfall
monthlySold comps — $/sqft
last 12 mo · ≤1 miLoading sold comps…