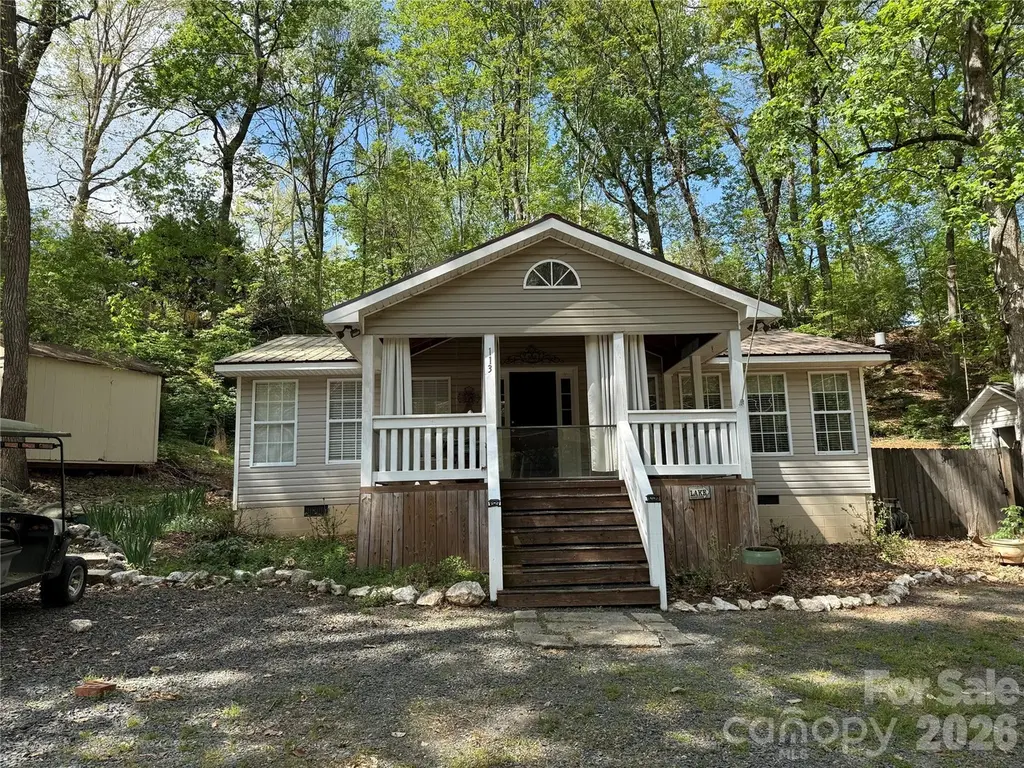
113/115 Indian Harbor Cir Unit E234/235 · Norwood, NC
Flood risk 8/10 · Major
- FEMA flood zone
- X (unshaded)
- Chance of flooding over 30 yrs
- 0.78%
- Est. flood insurance / yr
- $473 – $860
Fire risk 3/10 · Minor
- Est. fire insurance / yr
- $906 – $1,684
Heat risk 6/10 · Moderate
- Hot days now (above 108°F)
- 7 days/yr
- Hot days in 30 yrs
- 16 days/yr
Wind risk 6/10 · Moderate
- Chance of severe wind over 30 yrs
- 27.0%
Air-quality risk 2/10 · Minimal
- Unhealthy air days now
- 2 days/yr
- Unhealthy air days in 30 yrs
- 2 days/yr
Risk factors via First Street. Map © Google.
Why this score? — see what drove the C- grade
The composite is a weighted blend of 9 inputs, each scored 0–100. Each bar is that input's sub-score; the figure is the points it added to the 100-point composite (weight × sub-score).
- ARV discount +15.0/15.0
- Cash flow +11.9/30.0
- Appreciation +4.5/10.0
- 1% rule +4.1/10.0
- DSCR +3.5/10.0
- Livability +3.2/5.0
- Condition / age +2.8/5.0
- Schools +2.6/10.0
- Rent growth +2.5/5.0
$170,000
🖨 Deal sheet (PDF) 📄 Offer letter ✓ Due diligence
Listing remarks
Welcome to 113/115 Indian Harbor Cir. Quiet location within the park. Extra large master bedroom that accommodates a king size bed with plenty of room left to use. Large living room that is open to the dining area and kitchen. Decent size second bedroom. Step in shower and a real potty. Awesome covered front porch. HVAC throughout with supplemental propane heater in living room for cold winter nights. Dishwasher, washer/dryer, stove and microwave all to remain. Most furnishings included but not master bedroom set. Elec water heater 5 1/2 years old. Metal roof is approx 6 years old. New flooring 7 years ago. No title to camper, bill of sale with be provided. There is some overlap with the la
Key facts
- 7,405 sq ft lot
- Community pool
- Built 1989
Property features AI
Finance
- Other: Lake access to Lake Tillery (public beach, community boat ramp and slips)
- HOA & community: Part of Twin Harbor association; Mandatory HOA dues; HOA fee $1,100 annually; Community amenities: lake access, outdoor pool, picnic area, playground, recreation area, street lights, walking trails
Exterior
- Parking: Driveway
- Security: Gated community
- Utilities: Community well water; County sewer; Cable available; Electricity connected; Propane
- Home design: Manufactured single-family residence; One story; RV zoning; Has additional parcels
- Construction: Vinyl exterior; Metal roof; Permanent foundation with pillar/post/pier
- Exterior features: Covered front porch; Fenced backyard with chain link fencing; Patio/porch; Located on a cul-de-sac; Level lot
Interior
- Kitchen: Dishwasher; Electric range
- Bedrooms: 2 bedrooms on the main level
- Flooring: Linoleum
- Bathrooms: 1 full bathroom on the main level
- Heating & cooling: Heat pump heating; Central air conditioning; Heat pump cooling
- Interior features: Six total rooms; Storage
- Laundry & utility: Utility room
Neighborhood map
What this means for you Summary
Snapshot
- This is a 2-bed/1.0-bath single-family listed at $170k. Condition is rated average.
Deal economics
- At list price, monthly cash flow is $-100 ($-1k/yr) — negative.
- To cash-flow at today's rent, offer at most $156k (8.5% below list).
- To meet the 1% rule (rent ≥ 1% of price), the offer needs to be $155k (9.0% below list).
- Recommended offer: $155k (9.0% below list) — sets the bar for 1% rule.
- Cap rate 6.0% vs local median 2.9% in Norwood — top-decile yield for the area; either an underpriced asset or a hidden risk that comps aren't pricing in. Stress-test before assuming the spread holds.
Location & tenants
- Location reads 63/100 on livability (#410 in NC) — a middle-class / working-renter tenant base. Strengths: cost of living A+, housing A+, crime A; Watch: amenities F, commute F, employment D-.
- Montgomery County Schools (rural): math 29% / reading 34% proficiency, ranked #143 of 178 in NC (top 80%) — families likely to look elsewhere, expect single-tenant / working-renter base with shorter leases; 66% free/reduced lunch — lower-income household profile, screen leases tightly.
- Zoned schools: Mount Gilead Elementary (math 27% / reading 32%, grade F, #975 of 1,410 statewide, top 71%, 213 students, 87% FRL); West Middle (math 20% / reading 31%, grade F, #388 of 475 statewide, top 83%, 309 students, 72% FRL).
- Market conditions: 113 active listings in the ZIP; 138 units permitted in Montgomery County in 2024 (0 in 5+ unit buildings).
Forward outlook
- Local home prices are declining (-0.9%/yr); year-one equity from $1k of loan paydown is wiped out by about $2k of value loss. Plan a longer hold.
- Montgomery County population projected at -17% by 2050 — secular population decline; favor cash flow + early exit over multi-decade hold.
Negotiation context
- It's been on market 68 days — a 6% lower offer ($160k) is reasonable based on typical stale-listing flexibility.
Risks & watch-outs
- Watch-outs: flood insurance adds $56/mo.
- Climate carrying-cost: severe flood risk; major wind risk, 27% chance of damaging wind over 30y; extreme-heat days projected 7→16/yr by 2055 (HVAC capex compounding) — expect insurance premiums to compound above CPI over the hold.
Questions for the listing agent
- What do current leases actually rent for vs. the listed asking? Can we see a recent rent roll and the last 12 months of T-12 income?
- It's been on market 68 days. Have you received any prior offers? Is the seller open to a 9% concession, seller financing, or rate buy-down credit?
- What's the actual annual flood-insurance premium (NFIP or private), and is the property in a SFHA with mandatory coverage?
- What does the HOA fee cover, when was the last increase, and are there any pending special assessments or reserve-fund shortfalls?
- Why hasn't it sold? Are there any deal-killer items the seller is aware of (foundation, flood, title, zoning, code violations)?
- Is there a deadline driving the sale (1031 exchange, divorce, estate, relocation)? That informs how much negotiation room exists.
- Schools are F-rated, which usually means shorter tenancies and higher turnover. Who's the typical renter profile here, and what's been the actual vacancy rate?
- What's the average days-on-market for RENTAL listings here right now (not sales)? A rising rental-DOM trend means longer vacancies and softer asking-rent achievability than the comps imply.
- What's the recent tenant-quality profile in this submarket — average credit score on applications, eviction rate, late-payment / NSF rate, and stable-employment percentage? A property-management company in the area should have these aggregated.
- How much new for-sale + rental construction is in the pipeline within 1–3 miles? Heavy new supply typically softens prices + rents 12–24 months out; constrained supply supports both.
Investment metrics
- 1% rule
- 0.91% ✗
- Cap rate
- 5.98%
- Cash-on-cash
- -1.12%
- DSCR
- 0.95
- GRM
- 9.2
CMA / ARV
- ARV (on-the-fly)
- $205,662
- Comps found
- 8
Show comp detail 8 sales within ~0.75 mi
| Address | Dist | Beds/Ba | Sqft | Sold | Price | $/sf | Match |
|---|---|---|---|---|---|---|---|
| 109 Twin Bluff Trl Unit 29 section C | 0.37mi | 2/2.0 | 816 (-10%) | 3mo | $190,000 | $233 | 60 |
| 108/110 Cherokee Trl Unit F70/71 | 0.47mi | 2/2.0 | 792 (-13%) | 2mo | $180,000 | $227 | 52 |
| 207 Deer Park Rd | 0.31mi | 2/2.0 | 800 (-12%) | 13mo | $220,000 | $275 | 51 |
| 106 Anchor Ct Unit H93 | 0.57mi | 1/1.0 (-1) | 900 (-1%) | 21mo | $150,000 | $167 | 50 |
| 173/175 Landlubber Trl Unit H173/175 | 0.44mi | 2/2.0 | 816 (-10%) | 13mo | $230,000 | $282 | 48 |
| 112/110 Crows Nest Ct | 0.40mi | 2/1.0 | 988 (+9%) | 23mo | $188,500 | $191 | 47 |
| 119 Arrowood Trl | 0.45mi | 1/1.5 (-1) | 825 (-9%) | 13mo | $155,000 | $188 | 46 |
| 121 Hideaway Trl | 0.52mi | 2/1.0 | 800 (-12%) | 23mo | $110,000 | $138 | 37 |
Match score weights: distance 35% · size 25% · config 20% · recency 20%. Top-matched comps best support the ARV.
Projected returns pro-forma
-0.94% appreciation · 3.0% rent growth · sell at horizon
- IRR
- -9.0%
- Equity multiple
- 0.61×
- Total profit
- $-18,571
- Equity at exit
- $41,541
- IRR
- -2.1%
- Equity multiple
- 0.80×
- Total profit
- $-9,558
- Equity at exit
- $44,053
Cash invested: $47,600 (down + closing). Projections, not guarantees.
Landlord ↔ Tenant lean methodology
- Overall (STATE)
- 85 Strongly Landlord-Friendly
- State North Carolina
- 85 Strongly Landlord-Friendly · R+3
- County
- — inherits STATE
- City
- — inherits STATE
ZIP-level market 27306
- Home prices YoY
- -0.3%
- Active inventory
- 113
- Price-to-rent
- 9.2×
Monthly cashflow live
- Estimated rent
- $1,548 medium interval (Pro) →
- Mortgage (P&I)
- −$891
- Tax est. 1.5%
- −$212 /mo · $2,550/yr
- Insurance
- −$71
- Flood insurance flood zone
- −$56 /mo · $666/yr
- HOA
- −$92
- Vacancy / Maint / Mgmt
- −$325
- Net cashflow
- $-100
Break-even live
Sensitivity live
| Price | -10% $18 | -5% $-41 | +0% $-100 | +5% $-159 | +10% $-217 |
|---|---|---|---|---|---|
| Rent | -10% $-222 | -5% $-161 | +0% $-100 | +5% $-39 | +10% $22 |
| Rate | -1.0pp $-14 | -0.5pp $-57 | base $-100 | +0.5pp $-144 | +1.0pp $-189 |
UW: 25.0% down · 7.5% · 30yr · 1.5% tax · 5.0% vac · 8.0% maint · 8.0% mgmt
Financing live
Cash to close
- Down payment
- $42,500
- Closing costs
- $5,100
- Reserves months
- —
- Total cash needed
- —
Loan-product check · same deal, 3 products live
Conventional
25% down · 7.5% · 30yr
- Down + closing
- —
- Monthly P&I
- —
- Monthly cashflow
- —
- DSCR
- —
- Eligible?
- —
Personal DTI + credit; lowest rate.
DSCR
20% down · 8.5% · 30yr
- Down + closing
- —
- Monthly P&I
- —
- Monthly cashflow
- —
- DSCR
- —
- Eligible?
- —
No personal income docs; deal must DSCR.
Hard money
10% down · 12.0% · 12mo
- Down + closing
- —
- Monthly P&I
- —
- Monthly cashflow
- —
- DSCR
- —
- Eligible?
- —
Short-term bridge; refi at stabilization.
HOA detail
- Monthly dues
- $92 · $1,104/yr
- Likely covers
- water
Listing history 17 events
-
2026-06-18days on market $170,000 Active 68 DOM
-
2026-06-17days on market $170,000 Active 67 DOM
-
2026-06-16days on market $170,000 Active 66 DOM
-
2026-06-15days on market $170,000 Active 65 DOM
-
2026-06-14days on market $170,000 Active 63 DOM
-
2026-06-13days on market $170,000 Active 62 DOM
-
2026-06-10days on market $170,000 Active 60 DOM
-
2026-06-09days on market $170,000 Active 59 DOM
-
2026-06-08days on market $170,000 Active 58 DOM
-
2026-06-07days on market $170,000 Active 57 DOM
-
2026-06-05days on market $170,000 Active 54 DOM
-
2026-06-03days on market $170,000 Active 53 DOM
-
2026-06-02days on market $170,000 Active 52 DOM
-
2026-06-01days on market $170,000 Active 51 DOM
-
2026-05-31days on market $170,000 Active 50 DOM
-
2026-05-31days on market $170,000 Active 49 DOM
-
2026-04-11$170,000 Active
ⓘ Source: listings_history table (triggers on properties + properties_extension) + one-shot
backfill from property_details.listing_events for pre-trigger history.
Climate risk First Street
- Flood 8/10 Severe FEMA zone X (unshaded) · 78% chance over 30 yrs
- Wildfire 3/10 Moderate
- Heat 6/10 Major 7 d/yr ≥108°F today · 16 d/yr by 30 yrs out
- Wind 6/10 Major 27% chance of damaging wind over 30 yrs
- Air quality 2/10 Low 2 unhealthy d/yr today · 2 by 30 yrs out
Nearby sold comps map
Loading sold comps map…
Walkable amenities ~0.75 mi
Loading nearby amenities…
Taxation est. · year 1
- Rental income
- $18,570
- − Mortgage interest
- −$9,523
- − Property taxes
- −$2,550
- − Insurance
- −$1,516
- − Repairs & maintenance
- −$1,486
- − Management
- −$1,486
- − HOA
- −$1,104
- − Depreciation
- −$4,945
- Taxable loss
- −$4,040
- Est. tax savings @ 24.0%
- +$970
- After-tax cash flow
- $-229/yr
For passive investors: Depreciation is non-cash, so a rental often shows a tax loss while cash-flowing — sheltering income. Rental losses are passive: they offset passive income freely, and up to $25,000/yr can offset ordinary (W-2) income if you actively participate and your MAGI is under $100k (phasing out to $0 by $150k); unused losses carry forward. On sale, claimed depreciation is recaptured at up to 25%, and gains may owe capital-gains tax (a 1031 exchange can defer both). Figures are a year-1 estimate at your 24.0% rate — not tax advice; consult a CPA.
Condition & rehab AI · 13 photos
This home requires moderate renovations to address roof, HVAC, and flooring issues, but has potential for significant value increase with updates.
Repairs flagged
- Major roof — visible wear and tear
- Moderate HVAC — age and potential inefficiency
- Moderate electrical water heater — 5.5 years old
Value-add opportunities
- Both paint interior walls — Fresh paint enhances curb appeal and interior aesthetics
- Both replace worn flooring — New flooring improves comfort and value
- Both repair roof — A new roof ensures long-term durability and enhances curb appeal
- Both service HVAC system — A well-maintained HVAC system improves comfort and energy efficiency
Renovation cost estimate screening
| Repair item | Severity | Est. cost |
|---|---|---|
| roof · visible wear and tear | Major | $15,000–50,000 |
| HVAC · age and potential inefficiency | Moderate | $3,000–15,000 |
| electrical water heater · 5.5 years old | Moderate | $3,000–15,000 |
| Total estimated repair cost · 3 items | $21,000–80,000 |
Value-add ROI direction
- Both paint interior walls — Fresh paint enhances curb appeal and interior aesthetics ↑
- Both replace worn flooring — New flooring improves comfort and value ↑
- Both repair roof — A new roof ensures long-term durability and enhances curb appeal ↑
- Both service HVAC system — A well-maintained HVAC system improves comfort and energy efficiency ↑
ⓘ Cost ranges are severity-bucket heuristics (US national rule-of-thumb). Get contractor quotes + a written scope before underwriting a rehab budget.
Schools (NCES district)
- District
- Montgomery County Schools
- NCES district ID
- 3703060
- Math proficiency
- 29% ▼ -6.00%
- Reading proficiency
- 34% ▼ -2.00%
- Median HH income
- $34,706
- Composite
- 25.97/100
- National rank
- #7328
- State rank
- #143 of 178 in NC
Livability — Norwood
- Score
- 63/100
- State rank
- #410
- US rank
- #15485
Category grades
Schools grade is shown separately in the Schools card above.
Census & demographics
- Population (ZIP)
- 5,457
Population outlook (Montgomery County) Hauer SSP2
- Today (2025)
- 26,533 people
- By 2030
- 25,724 · -3.0%
- By 2040
- 23,842 · -10.1%
- By 2050
- 22,077 · -16.8%
- By 2075
- 18,754 · -29.3%
- By 2100
- 15,537 · -41.4%
Race, ethnicity, and origin ACS 2023
- Neighborhood character
- Majority White (64%)
- Race & ethnicity
- White 64% Black 26% Asian 6% Hispanic / Latino 2% Two or more races 2%
- Common ancestry
- Slovak 2% Serbian 1% Iranian 1%
- Foreign-born
- 6% · China, Canada, Philippines
- Languages at home
- 92% English-only · Other Asian/Pacific 5% Spanish 2% Chinese 1%
Political lean MEDSL · Montgomery
- 2024 margin
- Solid R (+37.8) · D 30.8% · R 68.6%
- 2008→2024 swing
- -26.9pp toward R · 2008: -11.0pp · 2024: -37.8pp
- All cycles
- 2024: R+37.8 2020: R+31.8 2016: R+25.9 2012: R+15.2 2008: R+11.0
Not yet ingested
- Civics
- —
Market trends
- HPI YoY
- ▼ -0.94%
- Current HPI
- 334.2599
- Rent YoY
- —
- Metro
- —
- State GDP YoY
- ▲ 3.28%
- F500 in state
- 26
Industry mix (Fortune 500 HQ in NC)
| Industry | F500 HQs | Revenue |
|---|---|---|
| Financial Services | 2 | $213B |
|
||
| Retail | 2 | $95B |
|
||
| Industrial Conglomerate | 1 | $38B |
|
||
| Metals / Steel | 1 | $35B |
|
||
| Utilities | 1 | $30B |
|
||
| Industrial Machinery | 1 | $19B |
|
||
Price history
1 event — show timeline
- 2026-04-11 Listed $170,000 CANOPYMLS as Distributed by MLS Grid
Cash-flow waterfall
monthlySold comps — $/sqft
last 12 mo · ≤1 miLoading sold comps…