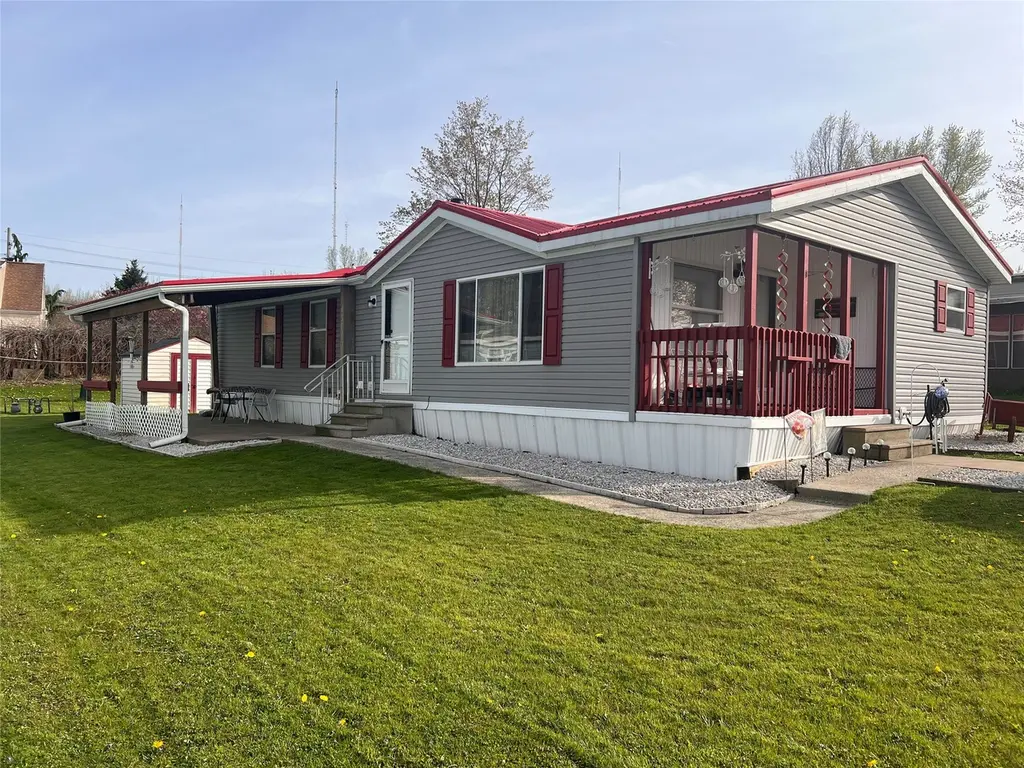
1561 Edgewood Dr · Erie, PA
Flood risk 6/10 · Moderate
- FEMA flood zone
- X (unshaded)
- Chance of flooding over 30 yrs
- 0.54%
- Est. flood insurance / yr
- $473 – $860
Fire risk 1/10 · Minimal
- Est. fire insurance / yr
- $511 – $949
Heat risk 1/10 · Minimal
- Hot days now (above 88°F)
- 7 days/yr
- Hot days in 30 yrs
- 18 days/yr
Wind risk 1/10 · Minimal
- Chance of severe wind over 30 yrs
- —
Air-quality risk 2/10 · Minimal
- Unhealthy air days now
- 1 days/yr
- Unhealthy air days in 30 yrs
- 3 days/yr
Risk factors via First Street. Map © Google.
Why this score? — see what drove the B grade
The composite is a weighted blend of 9 inputs, each scored 0–100. Each bar is that input's sub-score; the figure is the points it added to the 100-point composite (weight × sub-score).
- Cash flow +30.0/30.0
- 1% rule +10.0/10.0
- DSCR +10.0/10.0
- ARV discount +9.9/15.0
- Schools +5.1/10.0
- Livability +4.2/5.0
- Rent growth +2.5/5.0
- Condition / age +2.5/5.0
- Appreciation +0.0/10.0
$56,000
🖨 Deal sheet 📄 Offer letter ✓ Due diligence
Listing remarks
Move in ready! New roof in 2022, hot water tank 2021, central air 2019. Includes all appliances! Covered patio and fenced in yard!
Key facts
- Hot water tank
- Covered patio
- Central air
Tags
Property features AI
Exterior
- Utilities: Public water; Public sewer
- Home design: Single-family residence; Residential property; R-1 zoning
- Construction: Vinyl siding; Metal roof
- Exterior features: Storage; Shed
Interior
- Kitchen: Dishwasher; Gas oven; Gas range; Microwave; Refrigerator
- Flooring: Laminate flooring
- Bathrooms: 2 full bathrooms
- Heating & cooling: Forced air heat; Central air conditioning; Ceiling fan cooling
- Interior features: Ceiling fans; Skylights
Neighborhood map
What this means for you Summary
Snapshot
- This is a 3-bed/2.0-bath manufactured listed at $56k.
Deal economics
- At list price, monthly cash flow is $782 ($9k/yr) — positive.
- The deal already cash-flows at list — no discount required.
- Meets the 1% rule at list price ($2k rent vs $56k).
- Cap rate 23.1% vs local median 5.2% in Erie — top-decile yield for the area; either an underpriced asset or a hidden risk that comps aren't pricing in. Stress-test before assuming the spread holds.
Location & tenants
- Location reads 83/100 on livability (#109 in PA, #840 nationally) — a professional / high-income tenant draw. Strengths: amenities A+, commute A+, cost of living A+; Watch: crime D+, employment F.
- Fort Leboeuf SD (rural): math 52% / reading 68% proficiency, ranked #77 of 539 in PA (top 14%) — acceptable for families but not a draw, mixed tenant base, ~2y average lease.
- Market conditions: 116 active listings in the ZIP; 364 units permitted in Erie County in 2024 (188 in 5+ unit buildings).
Forward outlook
- Local home prices are declining (-3.0%/yr); year-one equity from $387 of loan paydown is wiped out by about $2k of value loss. Plan a longer hold.
- Erie County population projected at -14% by 2050 — secular population decline; favor cash flow + early exit over multi-decade hold.
- At projected returns (-3.0% appreciation + 3.0% rent growth), your $16k cash investment doubles in ~2 years — after that, you're playing with house money.
Negotiation context
- Only 1 days on market — expect competitive offers; lowballing is unlikely to land.
- 4 sale attempts since 5y ago with the ask held roughly flat each time — persistent listings suggest the price (not the market) is what's stuck; bring a comps-based counter.
Risks & watch-outs
- Climate carrying-cost: major flood risk — expect insurance premiums to compound above CPI over the hold.
Questions for the listing agent
- Is there a deadline driving the sale (1031 exchange, divorce, estate, relocation)? That informs how much negotiation room exists.
- Crime grade is D in this area — have there been break-ins, vandalism, or insurance claims at this property in the last 3 years? What carrier currently insures it and at what premium?
- What's the average days-on-market for RENTAL listings here right now (not sales)? A rising rental-DOM trend means longer vacancies and softer asking-rent achievability than the comps imply.
- What's the recent tenant-quality profile in this submarket — average credit score on applications, eviction rate, late-payment / NSF rate, and stable-employment percentage? A property-management company in the area should have these aggregated.
- How much new for-sale + rental construction is in the pipeline within 1–3 miles? Heavy new supply typically softens prices + rents 12–24 months out; constrained supply supports both.
Investment metrics
- 1% rule
- 2.68% ✓
- Cap rate
- 23.05%
- Cash-on-cash
- 59.85%
- DSCR
- 3.66
- GRM
- 3.1
CMA / ARV
- ARV (on-the-fly)
- $59,136
- Comps found
- 11
Show comp detail 11 sales within ~0.75 mi
| Address | Dist | Beds/Ba | Sqft | Sold | Price | $/sf | Match |
|---|---|---|---|---|---|---|---|
| 1520 Pinegrove Way | 0.08mi | 3/2.0 | 1,352 (+1%) | 2mo | $102,500 | $76 | 93 |
| 1595 Edgewood Dr | 0.01mi | 3/2.0 | 1,344 (0%) | 13mo | $18,000 | $13 | 88 |
| 1632 Edgewood Dr | 0.04mi | 4/2.0 (+1) | 1,344 (0%) | 7mo | $59,500 | $44 | 88 |
| 8215 Timberwood Ln | 0.06mi | 3/2.0 | 1,248 (-7%) | 2mo | $59,000 | $47 | 83 |
| 1640 Edgewood Dr | 0.12mi | 3/2.0 | 1,232 (-8%) | 4mo | $45,000 | $37 | 77 |
| 1540 Edgewood Dr | 0.02mi | 3/2.0 | 1,296 (-4%) | 23mo | $42,500 | $33 | 74 |
| 8205 Cloveridge Dr | 0.45mi | 3/2.0 | 1,288 (-4%) | 9mo | $68,000 | $53 | 65 |
| 8223 Timberwood Ln | 0.06mi | 4/2.0 (+1) | 1,512 (+12%) | 9mo | $60,000 | $40 | 64 |
| 8191 Willow Glen Dr | 0.45mi | 3/2.0 | 1,456 (+8%) | 15mo | $94,400 | $65 | 52 |
| 8233 Cloveridge Dr | 0.48mi | 3/2.0 | 1,248 (-7%) | 23mo | $55,000 | $44 | 46 |
| 8230 Willow Glen Dr | 0.49mi | 3/2.0 | 1,456 (+8%) | 21mo | $77,500 | $53 | 46 |
Match score weights: distance 35% · size 25% · config 20% · recency 20%. Top-matched comps best support the ARV.
Projected returns pro-forma
-3.0% appreciation · 3.0% rent growth · sell at horizon
- IRR
- 58.6%
- Equity multiple
- 3.60×
- Total profit
- $40,767
- Equity at exit
- $8,350
- IRR
- 63.4%
- Equity multiple
- 7.36×
- Total profit
- $99,769
- Equity at exit
- $4,842
Cash invested: $15,680 (down + closing). Projections, not guarantees.
Landlord ↔ Tenant lean methodology
- Overall (STATE)
- 62 Landlord-Friendly
- State Pennsylvania
- 62 Landlord-Friendly · EVEN
- County
- — inherits STATE
- City
- — inherits STATE
ZIP-level market 16509
- Home prices YoY
- -30.7%
- Active inventory
- 116
- Price-to-rent
- 3.1×
Monthly cashflow live
- Estimated rent
- $1,501 medium interval (Pro) →
- Mortgage (P&I)
- −$294
- Tax from tax record
- −$87 /mo · $1,043/yr
- Insurance
- −$23
- HOA
- −$0
- Vacancy / Maint / Mgmt
- −$315
- Net cashflow
- $782
Break-even live
UW: 25.0% down · 7.5% · 30yr · 1.5% tax · 5.0% vac · 8.0% maint · 8.0% mgmt
Financing live
Cash to close
- Down payment
- $14,000
- Closing costs
- $1,680
- Reserves months
- —
- Total cash needed
- —
Loan-product check · same deal, 3 products live
Conventional
25% down · 7.5% · 30yr
- Down + closing
- —
- Monthly P&I
- —
- Monthly cashflow
- —
- DSCR
- —
- Eligible?
- —
Personal DTI + credit; lowest rate.
DSCR
20% down · 8.5% · 30yr
- Down + closing
- —
- Monthly P&I
- —
- Monthly cashflow
- —
- DSCR
- —
- Eligible?
- —
No personal income docs; deal must DSCR.
Hard money
10% down · 12.0% · 12mo
- Down + closing
- —
- Monthly P&I
- —
- Monthly cashflow
- —
- DSCR
- —
- Eligible?
- —
Short-term bridge; refi at stabilization.
Listing history 6 events
-
2026-04-30status Pending
-
2026-04-29$56,000 Active
-
2024-04-18$68,000 Active
-
2022-08-01$65,000
-
2021-09-30soldstatus $53,000
-
2021-09-01$55,000
ⓘ Source: listings_history table (triggers on properties + properties_extension) + one-shot
backfill from property_details.listing_events for pre-trigger history.
Tax reassessment forecast PA · Partial reset (capped growth)
- Current annual tax
- $1,043 · $87/mo
- Projected year-2 tax
- $1,043 · $87/mo
- Expected delta
- $0/yr ($0/mo · 0.0%)
ⓘ Screening estimate from a state-policy table — verify with the county assessor before closing.
Climate risk First Street
- Flood 6/10 Major FEMA zone X (unshaded) · 54% chance over 30 yrs
- Wildfire 1/10 Low
- Heat 1/10 Low 7 d/yr ≥88°F today · 18 d/yr by 30 yrs out
- Wind 1/10 Low
- Air quality 2/10 Low 1 unhealthy d/yr today · 3 by 30 yrs out
Nearby sold comps map
Loading sold comps map…
Walkable amenities ~0.75 mi
Loading nearby amenities…
Taxation est. · year 1
- Rental income
- $18,015
- − Mortgage interest
- −$3,137
- − Property taxes
- −$1,043
- − Insurance
- −$280
- − Repairs & maintenance
- −$1,441
- − Management
- −$1,441
- − Depreciation
- −$1,629
- Taxable income
- $9,043
- Est. tax owed @ 24.0%
- −$2,170
- After-tax cash flow
- $7,214/yr
For passive investors: Depreciation is non-cash, so a rental often shows a tax loss while cash-flowing — sheltering income. Rental losses are passive: they offset passive income freely, and up to $25,000/yr can offset ordinary (W-2) income if you actively participate and your MAGI is under $100k (phasing out to $0 by $150k); unused losses carry forward. On sale, claimed depreciation is recaptured at up to 25%, and gains may owe capital-gains tax (a 1031 exchange can defer both). Figures are a year-1 estimate at your 24.0% rate — not tax advice; consult a CPA.
Schools (NCES district)
- District
- Fort Leboeuf SD
- NCES district ID
- 4209990
- Math proficiency
- 52% ▼ -12.00%
- Reading proficiency
- 68% ▼ -6.00%
- Median HH income
- $54,607
- Composite
- 51.46/100
- National rank
- #1725
- State rank
- #77 of 539 in PA
Livability — Erie
- Score
- 83/100
- State rank
- #109
- US rank
- #840
Category grades
Schools grade is shown separately in the Schools card above.
Census & demographics
- County
- Erie County · 92,215 people
- City population
- 92,215
- Metro
- Erie, PA
- Population (ZIP)
- 28,595
- Household income
- $68,846
- Rent vs Own
- Severe rent burden
- 870.0
Population outlook (Erie County) Hauer SSP2
- Today (2025)
- 272,159 people
- By 2030
- 266,299 · -2.2%
- By 2040
- 250,987 · -7.8%
- By 2050
- 234,925 · -13.7%
- By 2075
- 199,164 · -26.8%
- By 2100
- 162,985 · -40.1%
Race, ethnicity, and origin ACS 2023
- Neighborhood character
- Predominantly White (87%)
- Race & ethnicity
- White 87% Two or more races 6% Black 4% Hispanic / Latino 3% Asian 1%
- Common ancestry
- Romanian 14% Slovak 4% Scotch-Irish 2%
- Foreign-born
- 6% · Canada
- Languages at home
- 92% English-only · Russian/Polish/Slavic 3% German/W. Germanic 1% Spanish 1%
Political lean MEDSL · Erie
- 2024 margin
- Toss-up / Even · D 49.0% · R 50.0%
- 2008→2024 swing
- -20.9pp toward R · 2008: 19.9pp · 2024: -1.0pp
- All cycles
- 2024: R+1.0 2020: D+1.0 2016: R+2.0 2012: D+16.9 2008: D+19.9
Not yet ingested
- Civics
- —
Market trends
- HPI YoY
- ▼ -106.54%
- Current HPI
- 240.361
- Rent YoY
- —
- Metro
- Erie, PA
- State GDP YoY
- ▲ 1.68%
- F500 in state
- 34
Industry mix (Fortune 500 HQ in PA)
| Industry | F500 HQs | Revenue |
|---|---|---|
| Healthcare | 2 | $309B |
|
||
| Insurance | 2 | $27B |
|
||
| Telecommunications / Media | 1 | $124B |
|
||
| Industrial Distribution | 1 | $22B |
|
||
| Financial Services | 1 | $20B |
|
||
| Chemicals / Materials | 1 | $18B |
|
||
Price history
+1.8% since first listed6 events — show timeline
- 2026-04-30 Pending — GEBOR
- 2026-04-29 Listed $56,000 GEBOR
- 2024-04-18 Listed $68,000 GEBOR
- 2022-08-01 Listed $65,000 GEBOR
- 2021-09-30 Sold (MLS) $53,000 GEBOR
- 2021-09-01 Listed $55,000 GEBOR
Property tax history
+2.8%/yrLatest (2026): $1,043 · +4.8% YoY. Source: county tax records.
Cash-flow waterfall
monthlySold comps — $/sqft
last 12 mo · ≤1 miLoading sold comps…